

Abstract
Objective
Injury related morbidity and mortality is an important emergency medicine and public health challenge in the United States (US). Here we describe the epidemiology of traumatic injury presenting to US emergency departments, define changes in types and causes of injury among the elderly and the young, characterize the role of trauma centers and teaching hospitals in providing emergency trauma care, and estimate the overall economic burden of treating such injuries.
Methods
We conducted a secondary retrospective, repeated cross-sectional study of the Nationwide Emergency Department Data Sample (NEDS), the largest all-payer emergency department survey database in the US. Main outcomes and measures were survey-adjusted counts, proportions, means, and rates with associated standard errors, and 95% confidence intervals. We plotted annual age-stratified emergency department discharge rates for traumatic injury and present tables of proportions of common injuries and external causes. We modeled the association of Level 1 or 2 trauma center care with injury fatality using a multi-variable survey-adjusted logistic regression analysis that controlled for age, gender, injury severity, comorbid diagnoses, and teaching hospital status.
Results
There were 181,194,431 (standard error, se = 4234) traumatic injury discharges from US emergency departments between 2006 and 2012. There was an average year-to-year decrease of 143 (95% CI -184.3, -68.5) visits per 100,000 US population during the study period. The all-age, all-cause case-fatality rate for traumatic injuries across US emergency departments during the study period was 0.17% (se = 0.001). The case-fatality rate for the most severely injured averaged 4.8% (se = 0.001), and severely injured patients were nearly four times as likely to be seen in Level 1 or 2 trauma centers (relative risk = 3.9 (95% CI 3.7, 4.1)). The unadjusted risk ratio, based on group counts, for the association of Level 1 or 2 trauma centers with mortality was RR = 4.9 (95% CI 4.5, 5.3), however, after accounting for gender, age, injury severity and comorbidities, Level 1 or 2 trauma centers were not associated with an increased risk of fatality (odds ratio = 0.96 (0.79, 1.18)).
There were notable changes at the extremes of age in types and causes of emergency department discharges for traumatic injury between 2009 and 2012. Age-stratified rates of diagnoses of traumatic brain injury increased 29.5% (se = 2.6) for adults older than 85, and increased 44.9% (se = 1.3) for children younger than 18. Firearm related injuries increased 31.7% (se = 0.2) in children five years and younger. The total inflation-adjusted cost of emergency department injury care in the US between 2006 and 2012 was $99.75 billion (se = 0.03).
Conclusions
Emergency departments are a sensitive barometer of the continuing impact of traumatic injury as an important cause of morbidity and mortality in the US. Level 1 or 2 trauma centers remain a bulwark against the tide of severe trauma in the US. But, the types and causes of traumatic injury in the US are changing in consequential ways, particularly at the extremes of age, with traumatic brain injuries and firearm-related trauma presenting increased challenges.
Introduction
Injury-related morbidity and mortality is a public health burden in the United States (US) in terms of lives impacted, cost of care, and lost productivity. Unintentional traumatic injuries killed 136,053 people in the US in 2014, surpassed only by heart disease (614,348), cancer (591,699), and chronic lower respiratory diseases (147,101).1 For children and adults younger than age 45, traumatic injuries account for an estimated 79,000 deaths each year, compared to 49,000 non-communicable disease deaths and 15,000 infectious disease deaths.1 In the US, trauma is the single most important cause of potential years of life lost for persons under age 65.2
The impact of traumatic injury in the US extends beyond mortality. In 2014, there were 30,838,741 non-fatal injuries presenting to emergency departments (ED) for care.3 In 2013, the total cost of traumatic injuries in the US—including lost wages and medical expenses—was estimated at $671 billion, with non-fatal injuries comprising 68% of the cost.4
Importance
Despite the importance of injury as a public health issue, research gaps remain in our understanding of the basic epidemiology of traumatic injury in the US. Nearly two decades ago, the US Institute of Medicine (IOM) advocated for improving injury surveillance systems to “gather nationally representative data on all injuries treated in EDs, to increase knowledge of the causes and severity of non-fatal injuries.”5 The IOM Committee on Injury Prevention envisioned expanding the National Electronic Injury Surveillance System (NEISS), which for three decades had tracked consumer product injury data, helping establish consumer safety standards and informing product recalls.6 In 2000, this surveillance system was expanded to include data collection on all injuries, thus greatly increasing its utility in public health research. The IOM also encouraged reliable International Classification of Diseases (ICD)-based coding of injuries in hospital administrative datasets. Since that time, there has been a proliferation of administrative medical data, much of it extracted from electronic hospital records. Injury epidemiologists have increasingly used administrative databases including the National Trauma Data Bank (NTDB) and Healthcare Cost and Utilization Project (HCUP) National Inpatient Sample (NIS) to investigate a wide range of trauma-related injuries and treatments. The nationwide scope of these studies and their findings inform clinicians, researchers, and policymakers alike. Most of these studies have focused on mortality7 or on inpatient hospital care for specific injury mechanisms and outcomes in distinct populations.8,9,10,11 There have been far fewer population-based, multi-year studies of ED discharges for traumatic injury.
Goals of the Investigation
The objective of this manuscript is to characterize the epidemiology and incidence of traumatic injury (both fatal and non-fatal) in the US, describe trends in types and causes of injury, characterize the role of trauma centers and teaching hospitals in providing emergency trauma care, and estimate the economic burden of such care, using data from the Nationwide Emergency Department Sample (NEDS). We believe the descriptive epidemiology of traumatic injury in the US has changed in important ways in recent years. We aim to provide one of the most comprehensive recent pictures of ED traumatic injury care in the US.
Methods
Data were obtained from the US Agency for Healthcare Research and Quality (AHRQ) HCUP NEDS for the years 2006 to 2012. HCUP is a group of inpatient and outpatient files created by AHRQ. NEDS is the largest single publicly available ED database in the US. NEDS is based on a 20% stratified single-cluster sample of hospital-based EDs in the US. The stratification variables included in the sampling strategy are intended to make the sample representative of all hospital-based EDs. For example, NEDS includes the same proportion of trauma centers as are found in the US. In 2013, 30 states participated in NEDS accounting for 66% of all ED visits. The core files contain 100% of visits from sampled hospitals. The most recent NEDS core file contains about 30 million ED records.12 Hospitals are defined as non-federal general and specialty hospitals including public hospitals and academic medical centers. Additional stratification variables include geographic area, urban/rural, ownership, trauma center and teaching status, and bed size.
Comma-separated core files for each year were read into an R13 data-frame. Survey-adjusted point estimates and standard errors for individual years were verified against estimates obtained from a publicly available HCUP online query system.14 Traumatic injury discharges were identified using principle or first-listed ICD 9th edition15 diagnosis codes for acute injury 800-904.9, 909.4, 909.9, 910-994.9, 995.5-995.59, and 995.80-995.85. As noted in the HCUP documentation, the ICD-9-CM coding guidelines define principal diagnosis as “that condition established after study to be chiefly responsible for occasioning the admission of the patient to the hospital for care.”16 Discharges with codes for “late effect” primary diagnoses (ICD 905.0-909.9), insect bites (910.4, 910.5, 911.4, 911.5, 912.4, 912.5, 913.4, 913.5, 914.4, 914.5, 915.4, 915.5, 916.4, 916.5, 917.4, 917.5, 919.4, 919.5), poisonings (960.0-964.9, 965.00-965.02, 965.09, 965.1, 965.4, 965.5, 965.61, 965.69, 965.7-969.0, 969.00-969.09, 969.70-969.73, 969.1-969.7, 967.0-967.9, 969.79, 969.8-980.9, 970.81, 970.89, 981, 982.0-985.9, 986, 987.0-989.7, 989.81:989.89, 989.9, 990, 991.0-995.2, 995.20-995.29, 995.3, 995.4), anaphylaxis (995.60-995.69,995.7), and some additional miscellaneous diagnoses (malignant hyperthermia, systemic inflammatory response syndrome, malfunctioning cardiac devices, 995.86-996.00) were removed. The R “icd9”17 package was used to apply descriptors to the diagnostic ICD-9 codes and external cause of injury E-codes.
Injury severity was quantified using the ICD-derived Injury Severity Score (ICISS)18 and then categorized as severe vs. non-severe. Osler et al18 first proposed ICISS in 1996 as a means of estimating injury severity using ICD codes in administratively collected hospital discharge data. It is calculated in two steps. First, survival risk ratios (SRRs) for each injury diagnosis in a data set are “…calculated as the ratio of the number of times a given ICD-9 code occurs in (surviving patients) to the total number of occurrences of that code”. Second, the ICISS for an individual patient is calculated as “the product of all the survival risk ratios for each of an individual patient's injuries (for as many as ten different injuries).”19 The ICISS is then defined as the probability of patient surviving their injuries and ranges from 0 to 1. ICISS cut-off of less than 0.94 was used to categorize patients into those with the most severe injuries.20 This indicator variable identifies patients with a 6% or greater probability of dying, and has performed well in previous analyses, returning an odds ratio of 6.75 (95% CI 6.48, 7.03) in a multivariate logistic regression analysis of trauma mortality.21
To control for chronic conditions and other non-traumatic injury diagnoses, a Charlson comorbidity index (CCI) score22 was calculated for each discharge using the listed ICD-9 codes.17 Because of the very high proportion of patients without CCI conditions, the score variable was heavily skewed, so was categorized into an indicator variable for patients with a CCI greater than 2. Trauma center designations were based on the AHRQ “HOSP_TRAUMA” indicator variable found in the NEDS hospital file for that year. In the US, state authorities designate trauma centers. Level 1 and 2 trauma centers are both capable of providing immediate definitive care for all injured patients with 24-hour availability of emergency medicine, general surgical and surgical subspecialty services. Level I centers differ in that general surgical coverage is available in-house at all times, and that they operate an organized teaching and trauma research effort. Teaching hospitals were also identified using an AHRQ variable. We used the HCUP Clinical Classification Software system to categorize procedure codes. Primary ICD-9 codes were categorized according to the Barell Matrix, an injury diagnosis matrix tool used internationally to standardize the classification of ICD-9 injury codes 800 to 995 according to 12 nature-of-injury columns and 36 body-location rows.23,24
All analyses were based on weighted data adjusted for the complex survey design of HCUP NEDS using the R packages “survey” 25 and “sqlsurvey”26. The R “rms”27 package was used for models not supported by “survey” and “sqlsvy”, with robust covariances specified to account for clustering by strata within the NEDS survey design. Because they are not available in “survey”, “sqlsvy” or “rms”, relative risks were calculated using simulations based on survey-adjusted counts and standard errors for the numerator and denominator of the ratio. Each simulation consisted of 1,000 random normal draws. Year-to-year variability of rates was assessed with the robust linear model function in the R package “MASS”28 and bootstrap simulations for confidence intervals using the “Boot” function in the R package “car.”29 Descriptive statistical analysis consisted of survey-adjusted counts, proportions, means, with associated standard errors, and 95% confidence intervals. Annual total and age-specific rates were calculated using US census data obtained from AHRQ as part of the HCUP family of data products. Age classifications were chosen to broadly reflect clinical populations and to be generally consistent with census population categories. We analyzed yearly data with overlying loess smoothing lines and present tables of the proportion of common injury categories and causes. Because the analyses involved comparisons and assessment of trend over time, we tested for the assumption of linearity of the year-to-year variability in the survey results using an approach appropriate to multi-year survey data.30 We assessed the association of level 1 or 2 trauma centers and teaching hospitals with the risk of injury mortality using unadjusted risk ratios and survey-adjusted logistic regression controlling for age as a continuous variable, and indicator variables for gender, injury severity (severe vs. not severe), and Charlson comorbidity index ( >2 conditions vs. none). The covariate selection process for multivariable models was based on previous studies of univariate associations between the covariate and the primary putative exposure variable and the covariate and the outcome of interest, 21 changes in the strength of the association between the primary exposure variable and the outcome with the covariate included or excluded, and on a priori assumptions about potential confounders.
A complete set of notes and code to reproduce or adapt the study methods are available at http://www.injuryepi.org/resources/Misc/nedsNotesOnline.pdf. An R file containing the data to calculate total and population-specific rates and to recreate figures 1-5 is available for download at http://www.injuryepi.org/resources/Misc/figureDat.Rdata. The study was approved by the New York University School of Medicine Institutional Review Board, and conforms to the STROBE statement on the reporting of observational studies, excluding elements of the checklist not applicable to a retrospective, repeated cross-sectional study design.31
Figure 1.
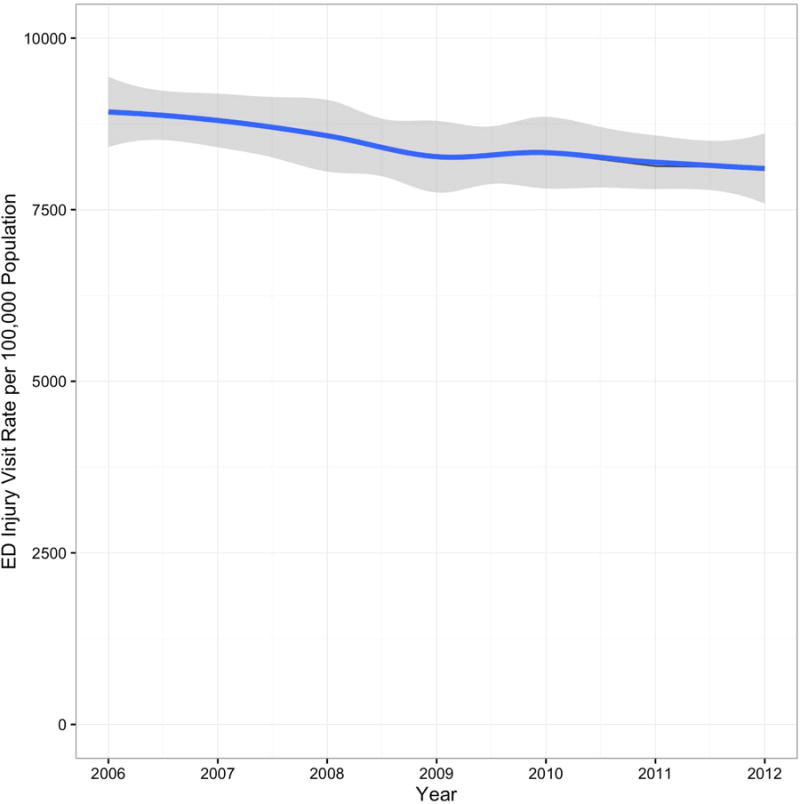
Emergency Department Visits for Traumatic Injury per 100,000 Population, US Hospitals, 2006-2012 in survey-adjusted (weighted) numbers.
Figure 5.
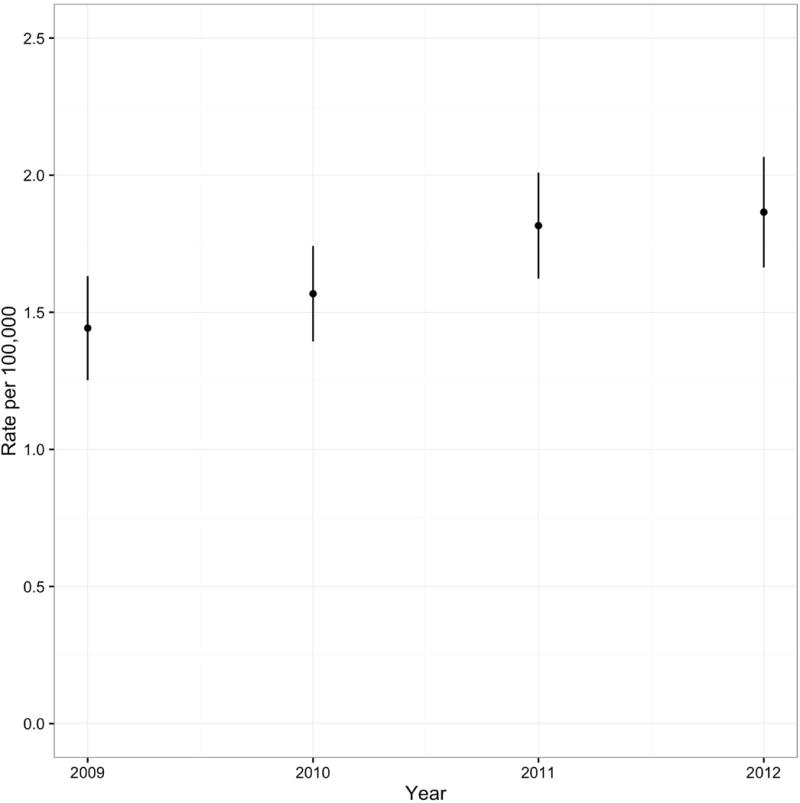
Rate per 100,000 Population, Emergency Department Visits for Firearm Related Injuries in Children 5 Years and Younger. United States, 2009-2012.
Results
Between 2006 and 2012, there were 181,194,431 (standard error (se) = 4,234) ED visits for traumatic injury in the US (Table 1). There was an average year-to-year decrease of 143 (95% Confidence Interval (CI) -184.2637, -68.52282) visits per 100,000 US population during the study period, from a high of 8,923 per 100,000 (95% Confidence Interval, CI 8916, 8930) in 2006 to a low of 8,115 (95% CI 8109, 8121) in 2012 (Figure 1).
Table 1.
Emergency Department Visits for Traumatic Injury, US Hospitals, 2006-2012, in survey- adjusted (weighted) numbers.
| Year | Count (SE) |
|---|---|
| 2006 | 26,624,017 (10,381) |
| 2007 | 26,519,522 (10,448) |
| 2008 | 26,084,855 ( 9,888) |
| 2009 | 25,376,355 (10,296) |
| 2010 | 25,771,892 (9,933) |
| 2011 | 25,347,338 (8,907) |
| 2012 | 25,470,453 (9,400) |
| Total | 181,194,431 (4,234) |
The mean age of a person discharged from a US ED for a traumatic injury between 2006 and 2012 was 34.7 years (se = 0.1). The mean age ranged from a low of 33.8 years (se=0.01) in 2006 to a high of 35.3 years in 2011 (se = 0.001). The average year-to-year increase in mean age was 1.1 years (se = 0.27, 95% CI 0.6, 1.6). There was little change in the population-based visit rate by age group over the study period (Table 2, Figure 2). Females comprised 46.6% (se = 0.01) of all traumatic ED visits during the study period and 34.9% (se = 0.01) of severely injured patients.
Table 2.
Emergency Department Visits for Traumatic Injury by Age Group and Year, US Hospitals, 2006-2012 in survey-adjusted (weighted) numbers.
| Year | Age Group | Count | SE | |
|---|---|---|---|---|
| 1 | 2006 | Younger than 18 | 7,457,903.00 | 5963.93 |
| 2 | 2007 | 7,379,373.00 | 5938.79 | |
| 3 | 2008 | 7,072,187.00 | 5649.37 | |
| 4 | 2009 | 6,920,894.00 | 5756.46 | |
| 5 | 2010 | 6,761,431.00 | 5637.68 | |
| 6 | 2011 | 6,845,915.00 | 5466.50 | |
| 7 | 2012 | 6,951,220.00 | 5561.03 | |
| 8 | 2006 | 18 to 45 | 11,297,852.00 | 7218.43 |
| 9 | 2007 | 11,117,346.00 | 7179.34 | |
| 10 | 2008 | 10,860,471.00 | 6877.82 | |
| 11 | 2009 | 10,294,296.00 | 6965.59 | |
| 12 | 2010 | 10,531,512.00 | 6952.26 | |
| 13 | 2011 | 10,072,285.00 | 6444.13 | |
| 14 | 2012 | 10,024,540.00 | 6604.61 | |
| 15 | 2006 | 45 to 55 | 4,745,698.00 | 4830.58 |
| 16 | 2007 | 4,826,772.00 | 4872.49 | |
| 17 | 2008 | 4,865,721.00 | 4742.89 | |
| 18 | 2009 | 4,808,729.00 | 4881.30 | |
| 19 | 2010 | 5,043,254.00 | 4963.50 | |
| 20 | 2011 | 4,957,956.00 | 4710.57 | |
| 21 | 2012 | 4,962,435.00 | 4763.83 | |
| 22 | 2006 | 65 to 85 | 2,318,552.00 | 3401.10 |
| 23 | 2007 | 2,357,144.00 | 3436.13 | |
| 24 | 2008 | 2,400,043.00 | 3373.40 | |
| 25 | 2009 | 2,435,519.00 | 3520.23 | |
| 26 | 2010 | 2,485,301.00 | 3535.61 | |
| 27 | 2011 | 2,501,217.00 | 3394.97 | |
| 28 | 2012 | 2,555,035.00 | 3454.13 | |
| 29 | 2006 | Older than 85 | 804,011.80 | 2013.52 |
| 30 | 2007 | 838,886.80 | 2072.28 | |
| 31 | 2008 | 886,432.50 | 2064.62 | |
| 32 | 2009 | 916,916.00 | 2179.21 | |
| 33 | 2010 | 950,394.80 | 2200.10 | |
| 34 | 2011 | 969,965.80 | 2143.67 | |
| 35 | 2012 | 977,223.10 | 2149.26 |
Figure 2.
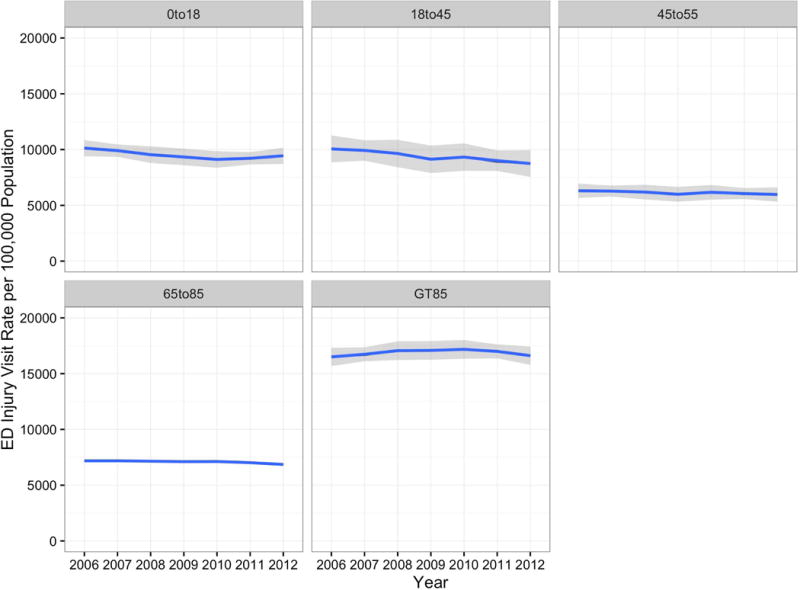
Emergency Department Visit Rate for Traumatic Injury per 100,000 Population by Age Group and Year, US Hospitals, 2006-2012 in survey-adjusted (weighted) numbers.
During the study period there were 73,655 (se = 618) pre-admission and 229,810 (se = 1,078) post-admission traumatic injury-related deaths in US ED's, yielding a total case-fatality rate of 0.17% (se = 0.01). The case-fatality rate for all traumatic injury visits ranged from a high of 0.18% (se = 0.002) in 2006 to a low of 0.15% in 2012 (se = 0.02) in 2012, with no meaningful year-to-year difference. The case-fatality rate for severely injured persons, defined as those with an ICISS greater than 0.94, averaged 4.8% (se = 0.001) over the study period. The case-fatality rate for severely injured persons ranged from a high of 5.2% (se = 0.001) in 2006 to a low of 4.3% in 2012 (se = 0.001) with a year-to-year average decline of 0.1% (se = 0.003, 95% CI -0.002, -0.0005).
There was graphical evidence of a decrease in average ICISS across all age groups in the final two years of the study period, indicating an increase in injury severity (Figure 3). The proportion of visits with a CCI score of 2 or greater increased 67.1% (se = 1.1) from 0.67% (se = 0.004) of all visits in 2006 to 1.12% (se = 0.005) of all visits in 2012. The average year-to-year increase in CCI was 0.08 (95\% CI 0.07, 0.09). Over the entire study period 0.90% (se = 0.002) of individuals who died in the ED due to traumatic injury had a CCI score of 2 or greater.
Figure 3.
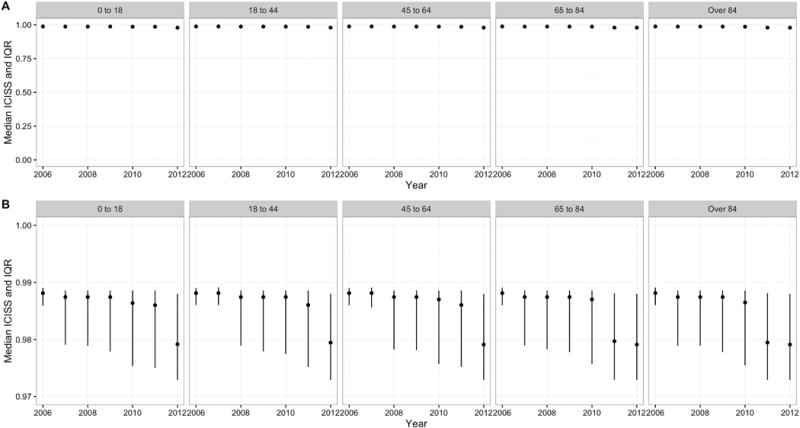
Median and Intraquartile Range. ICD9 Derived Injury Severity Scores by Age Group and Year, total scale (A) and focused scale (B). Emergency Department Visits for Traumatic Injury, US Hospitals, 2006-2012.
During the study period, there were 79,632,500 (se = 2154) traumatic injury-related ED visits to non-teaching hospitals in metropolitan areas and 64,792,147 (se = 3005) visits to teaching hospitals in metropolitan areas. A remaining 36,486,771 (se = 2064) visits were to non-metropolitan hospitals. The non-adjusted risk ratio for the association of severe traumatic injuries, i.e. those with a high risk of mortality based on ICISS, presenting to metropolitan teaching hospitals, compared to non-teaching metropolitan hospitals, was 2.16 (95% CI 2.01, 2.31). During that same time period, there were 181,171.33 (se = 950) injury fatalities at metropolitan teaching hospital EDs, compared to 92,772 (se = 679) at non-teaching metropolitan EDs, accounting for an unadjusted risk ratio for the association of injury fatality with metropolitan teaching hospital of 2.40 (95% CI 2.11, 2.77).
In total, there were 33,332,579 (se = 1765) traumatic injury-related ED discharges from Level 1 or 2 trauma centers during the study period, of which 1,603,010 (se = 2779), or 4.8%, (95% CI 4.6, 4.9) were classified as severe. By contrast, the proportion of patients with severe injuries who were discharged from non-Level 1 or 2 trauma centers was 1.3% (95% CI 1.2, 1.4). The relative risk for the association of severely injured persons presenting to Level 1 or 2 trauma centers was 3.9 (95% CI 3.7, 4.1). During that time, there were a total of 138,072 (se = 816) deaths in Level 1 or 2 trauma centers, yielding a case-fatality rate of 0.41% (95% CI 0.32, 0.51). There were 113,993 (se = 749) traumatic-injury deaths in non-Level 1 or 2 trauma centers, yielding a case fatality rate of 0.09% (95% CI 0.04, 0.13). The unadjusted risk ratio for fatality in Level 1 or 2 trauma centers vs. non-Level 1 or 2 trauma centers was 4.9 (95% 4.5, 5.3]). In a logistic regression model that adjusted for complex survey design, gender, age, injury severity and Charlson score, neither teaching hospital nor trauma centers were associated with an increased risk of fatality (Table 3).
Table 3.
Survey-Adjusted Logistic Regression Odds Ratios for Association with Fatality. Emergency Department Visits for Traumatic Injury, US Hospitals, 2006-2012.
| Variable | Odds Ratio (95% CI) |
|---|---|
| Age Group | 0.99 (0.96, 1.02) |
| Female | 0.93 (0.92, 0.94) |
| Teaching Hospital | 1.07 (0.80, 1.42) |
| Trauma Center | 0.96 (0.79, 1.18) |
| Severe Injury | 4.19 (3.87, 4.53) |
| Charlson Score | 10.3 (7.12, 15.04) |
Table 4 lists the most common Barell Matrix designations for anatomic locations of traumatic injuries presenting to US EDs between 2006 and 2012. Population-based injury rates of Barell matrix injury categories were highest for those over 84 years of age. There were notable changes in annual rates at the extremes of age. The rate of traumatic brain injury (TBI) diagnoses in the over-84 age group increased 29.5% (se = 2.6) over the study period, from 545.0 (se = 8.6) per 100,000 US population older than 84 in 2006 to 705.8 (se = 8.7) per 100,000 US population older than 84 in 2012, for a rate difference of 160.5 (se = 12.2) diagnoses per 100,000 US population. The average year-to-year increase was 29.7 TBI diagnoses per 100,000 population (95% CI -0.9, 54.5). Over the same time period, lower extremity injuries in the over-84 age group, including hip fractures, decreased 12.3% (se = 0.6) from 5,108 (se = 26.4) per 100,000 US population older than 85 in 2006 to 4,477 (se = 21.9) per 100,000 in 2012, for an overall rate difference of - 629.7 (se = 12.2) per 100,000, and an average year-to-year decrease of -104.5 diagnoses per 100,000 (95% CI -142.0, -76.5).
Table 4.
Barell Matrix Categories Emergency Department Visits for Traumatic Injury, US Hospitals, 2006-2012 in survey-adjusted (weighted) numbers.
| Injury Category | Count (SE) |
|---|---|
| Superficial Contusions | 39,055,035 (12,353) |
| Sprains / Strains | 43,306,062 (12,762) |
| Open Wounds | 40,534,722 (12,534) |
| System Wide | 4,303,484 (4581) |
| Unspecified | 12,687,322 (7591) |
| Fractures | 28,836,088 (10,999) |
| Dislocation | 3,247,192 (4004) |
| Amputations | 369,822 (1371) |
| Internal Organ | 5,155,054 (5022) |
| Burns | 2,881,833 (3788) |
| Crushing | 667,234 (1852) |
| Blood Vessels | 69,722 (597) |
| Nerves | 80,855 (638) |
There was an even greater increase in the rate of TBI diagnoses in the under-18 age group, which experienced a 44.9% (se = 1.3) increase in diagnosed TBIs, from 190.1 (se = 1.3) per 100,000 US population under 18 in 2006 to 275.4 (se = 1.5) per 100,000 in 2012, for an overall rate difference of 85.3 (se = 2.0) per 100,000, and an average year-to-year increase of 14.2 TBI diagnoses per 100,000 population (95% CI 11.7, 17.0). Over the same time period, the under age-18 group experienced a 14.7% (se = 0.6) decline in injuries to the torso, from 352.3 (se = 1.8) per 100,000 US population under 18 in 2006 to 300.7 (se = 1.6) per 100,000 in 2012, for a rate difference of -51.6 (se = 2.3) per 100,000 (Figure 4) and a year-to-year decrease of 282.2 diagnoses (95% CI -318.3, -215.6).
Figure 4.
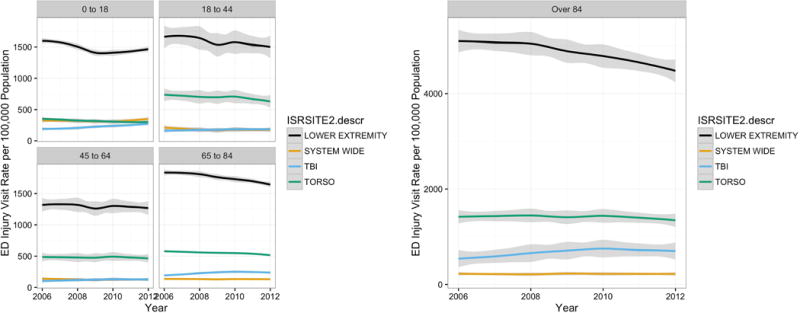
Barell Matrix Injury Types by Age Group and Year. Emergency Department Visits for Traumatic Injury, US Hospitals, 2006-2012.
Information on external causes of injury was available for the years 2009 to 2012. There were 2,656,790 (se = 3652) ED discharges for traumatic injury related to motor vehicles and other modes of transportation in 2009, for a US population-based rate of 866.0 (se = 1.2) per 100,000. This declined 3.5% (se = 0.2) to 2,623,246 (se = 3568) in 2012, for a rate difference of -30.2 (se = 1.7). In the youngest age group—under 18—the motor vehicle and transportation-related injury rate declined 8.3% (se = 0.2) from 480.2 (se = 0.7) per 100,000 US population under 18 in 2009 to 440.4 (se = 0.6) per 100,000 in 2012, for an absolute risk difference of -39.8 (se = 0.9) per 100,000.
Falls accounted for an important proportion of traumatic injuries seen in EDs that changed over the study period, as did firearm injuries particularly in children. Total injuries due to falls declined 2.3% (se = 0.1), from 7,713,447 (se = 6098) or 2,514 (se = 1.8) per 100,000 total US population to 7,781,310 (se = 5,839) or 2,479 (se = 1.8) per 100,000 in 2012, for an absolute rate decrease of 57.2 (se = 2.6) per 100,000 population. There was little or no change in the number and rate of falls as a cause of injury for adults over the age of 65 during the study period, which accounted for 7,713,447 (se = 6098) discharges in 2009 and 7,781,310 (se = 5839) in 2012.
There were a total of 71,111 (se = 613) ED diagnoses of firearm-related injuries in the US in 2009, for a rate of 23.2 (se = 0.2) per 100,000 US population. This increased 3.9% (se = 1.2) to 75,559 (se = 610) such diagnoses in 2012 for a rate of 24.1 (se = 0.2) per 100,000, or an absolute rate increase of 0.9 (se = 0.3) per 100,000 US population. The 18 to 44 year old age group accounted for a large proportion of firearm-related ED diagnoses. In 2009 there were 52,187 (se = 527) firearm-related ED visits among 18 to 44 year olds for a rate of 46.3 (se = 0.5) diagnoses per 100,000 US population aged 18 to 44. In 2012, there were 56,644 (se = 528) such diagnoses, for a rate of 49.6 (se = 0.6) per 100,000, which constituted a 7.2% (se = 1.6) relative rate increase, and an absolute increase of 3.3 (se = 0.7) diagnoses per 100,000 18 to 44 year olds. In 2006, there were 351 (se = 46) ED visits for firearms-related injuries to children 5 years and younger, for a rate of 1.4 (se = 0.2) firearm related diagnoses per 100,000 children age younger than 5. By 2012, this category of injury increased to 450 (se = 49) such diagnoses in this age group, for a rate of 1.9 (se = 0.2) per 100,000, which constituted a 31.7% (se = 0.2) relative increase in the rate, and a 0.4 (se = 0.3) absolute increase (Figure 5). Additional causes of injury are listed in Table 5.
Table 5.
Injury Causes Classified by Agency for Healthcare Research and Quality Clinical Classification Software. Emergency Department Visits for Traumatic Injury, US Hospitals, 2006-2012 in survey-adjusted (weighted) numbers.
| Injury Cause | Count (SE) |
|---|---|
| Cutting / Piercing | 14,717,767 (8209) |
| Drowning / Submersion | 32,582 (410) |
| Fire / Burn | 2,478,927 (3517) |
| Machinery | 918,969 (2147) |
| Pedal Cyclist | 2,254,208 (3348) |
| Pedestrian | 141,375 (838) |
| Non Motor-Vehicle Transport | 2,296,248 (3416) |
| Natural Environment | 3,248,078 (3988) |
| Overexertion | 15,686,930 (8410) |
| Struck By / Against | 26,876,289 (10650) |
| Suffocation | 222,728 (1058) |
Discussion
It is with good reason that the ED has been referred to as the “canary in the coal mine” of public health.32 In this comprehensive survey of the descriptive epidemiology of emergency department care for traumatic injuries in the US, we can begin to consider the possible implications of recent trends and changes for policy and resource allocation.
As the epidemiological landscape continues to evolve, large database studies such as NEDS have the potential to both reinforce and—in some cases—redefine our current understanding of trauma incidence and trends. Rates of ED visits for traumatic injuries are declining, as are fatalities from those injuries, consistent with similar trends during the last decade.7 As the US population ages, the mean age of injured trauma patients is increasing, as are the number of patient comorbidities. We also found a trend toward higher injury severity in these patients during the later years of the study, somewhat more pronounced in the elderly.
Consistent with a previous inpatient trauma study based on HCUP, we found that the proportion of patients with a Charlson comorbidity index over two doubled during the study period. Despite older and sicker patients presenting to US EDs21, outcomes are no worse compared with a decade earlier. The underlying reason for this remains unclear. Certainly there have been interval improvements in trauma systems and critical care, but there has also been an increase in the number of independent urgent care centers, potentially absorbing some of the injury burden that traditionally presented to hospital EDs.44 Whether this new phenomenon of urgent care centers significantly contributes to the fewer traumatic injuries presenting to EDs must be further characterized.
Our results highlight the role of trauma systems across the US. Level 1 or 2 trauma centers were four times more likely to see patients who are at highest risk of death, and indeed the trauma centers were associated with an increased unadjusted risk of death. But notably, when controlling for possible confounders and injury severity, any association with increased risk of fatality disappeared. We would venture to say that had we been able to control for the kinds of important traumatic-death related variables that were unavailable to us such as Glasgow Coma Scale, TRISS33, or the Injury Prevention Priority Score34, it is possible that we might have been able to demonstrate a statistically significant decreased risk of death. We note that we observed similar results for teaching vs. non-teaching hospitals, likely reflecting, in part, that most Level 1 or 2 trauma centers are also teaching hospitals.
We chose to compare and contrast the oldest and youngest age groups because they are perhaps the most vulnerable populations identifiable using routinely collected administrative data, and they were the populations who experienced the most notable differences. Our choice of the types and causes of injuries for comparison was similarly based on those that appeared to have undergone the greatest changes during the study period. It appears TBI is increasingly a disease of the very young and the very old. Both groups saw increasing rates of ED diagnoses of TBI. This may not, however, entirely reflect increasing underlying incidence. Our data utilized principle ICD-9 diagnoses. Thus, with the increasing recognition of the importance of TBI as well as continued increases in head computed tomography utilization35, other injuries once classified as primary diagnoses may now have declined in priority.
We also noted an overall decrease in fall-related diagnoses of 1.4%, with no significant change in those over 65. Despite reporting a statistically significant decline, the clinical significance is questionable given its low magnitude. However, the mortality rate from falls in the elderly is increasing1,36 and, according the Centers for Disease Control (CDC), unintentional fall fatalities in this group have increased from 44/100,000 in 2006 to 56/100,000 in 2012. One theory is the increasing use of the new oral anticoagulants, which are challenging to reverse. Recent studies, however, suggest that these medications are actually improving outcomes in injured trauma patients.37,38 Perhaps this mortality increase is simply a reflection of an aging US population with increasing comorbidities.21 Given this alarming trend, further characterization and risk-reduction strategies are warranted.
One of the most notable findings in this study is the ubiquity of firearm-related injuries across the US. Our results indicate that there is an ED visit for a firearm-related injury every 7 minutes. This injury mechanism is becoming increasingly common, up 4% overall and nearly 30% among children under the age of five. Suicide attempts, which on average are associated with a high mortality, may be contributing to the increase in firearm-related injuries in the 18 to 44 age group41, however this does not account for the increases in the very young. Firearm-related injury trends in young children disproportionately affect African-American and other minority communities, irrespective of socioeconomic standing.39,40,41 The most effective way to counteract this growing public health crisis remains an issue of intense and ongoing national debate. The clinical and social significance of a 30% increase in firearm-related injuries among children is tragic and raises policy concerns and questions as to what interventions may be effective.42,43
Limitations
There are inherent limitations to using cross-sectional observational data to comprehensively capture injury trends. Our results do not account for related secular trends such as recent increase in the availability of non-ED urgent care facilities that would divert less critically ill patients away from hospital EDs and results in a relative increase in acuity unrelated to population changes. While NEDS is more comprehensive than other national datasets44, it is difficult to accurately measure and control for how care provided by walk-in clinics and independent urgent care centers may contribute to some of the observed trends in this study. Nonetheless, any such effect is unlikely for traumatic injuries that require specialized high-acuity care. Another limitation is that NEDS is a relatively new database, with HCUP distributing annual data beginning in only 2006, so accounting for longer-term trends is not yet possible. While comprehensive, the NEDS database has not yet made the transition to the more informative ICD-10 and still relies on the less explanatory administrative ICD-9-CM diagnosis and external cause injury codes. Although these have been found to be reliable indicators of injury classification in hospital admissions45, their validity with respect to ED visits has not been widely established. They may also be incomplete and subject to individual coding variations and coder error.46 And, while the accuracy of ICD-9 codes in identifying trauma is considered acceptable, there is variability in reported sensitivity.47 Our estimates, particularly for older adults who may not immediately exhibit physical findings consistent with traumatic injury, may be an undercount. Also, external cause of injury data were available only for the final four years of the study period limiting our ability to assess trends. Finally, NEDS does not capture longitudinal data, so we could not ascertain rates of trauma recidivism (i.e. the percentage of patients with multiple presentations for traumatic injury) in the studied population.
We included age as a continuous variable in our model of hospital type and mortality. While age is generally accepted and “well-known risk factor”48 for trauma mortality, and there is a general clinical recognition that the consequences of traumatic injury are increased in the elderly compared to the very young, there is some room for debate on how or if the relationship is linear. Age has been shown to behave as an effect modifier in some settings49, and to demonstrate a threshold effect in other settings.50 By treating age as a continuous variable in our model, we hoped to capture some of the variability within age groups that was likely lost in our stratification scheme for categorical analysis. We note that our approach is consistent with other studies and returned similar results.51 In contrast, entered CCI in our model as a dichotomous variable, when it could be debated it should have been linear or perhaps ordinal. This decision was based on preliminary analyses that showed it was highly skewed with a natural cut off of 2.
We chose to dichotomize injury severity into severe vs. less severe both as a way to capture injury acuity and to address inherent problems with injury severity score as a continuous variable.52 Dichotomizing a continuous variable like ICISS can result in the loss of important information, and our choice of 0.94 as the cut off for severe vs. non-severe injury, while not entirely arbitrary, can be subject to debate.53 Dichotomization erases inter-categorical differences. So, in our study, a patient with an ICISS of 0.93 is the same as one with a score of 0.01. Injury severity scoring itself is inherently statistically problematic. Both the traditional and ICD-derived injury severity score behave poorly as a continuous variable, with some authors recommending, “that for statistical or analytical purposes the ISS/ NISS should not be considered a continuous variable.”52 While ICISS has been reported to generally perform as well as ISS53, it also behaves similarly poorly as a continuous variable. We found statistical manipulations as log, square root and inverse logit transformations to be unhelpful in this regard and chose to dichotomize. This approach also allowed us to calculate useful and informative statistics based on probabilities, like odds ratios. A categorization scheme for ICISS using cutoffs for minor to critical injuries has been proposed19 and may be informative for future studies. The injury severity indicator variable used in this study should identify patients with a 6% or greater probability of dying. We note that it has performed well in previous analyses, returning an odds ratio of 6.75 (95% CI 6.48, 7.03) in a multivariate logistic regression analysis of in-patient trauma mortality21, and that the unadjusted odds of pre-ED admission mortality in the current data was 67.
NEDS is not only the largest ED database in the US, but because of its sampling design it is also the most representative, and according to AHRQ “represents a ‘microcosm” of EDs in the US’”.54 Despite this strength, NEDS relies on the comprehensiveness of the data they receive from state agencies, and while the AHRQ goes to great lengths to minimize missing data gaps are inevitable. We found the variables we analyzed to be generally complete. There were, for example, no missing data for age, primary diagnosis (and the variables that depended on it, like ICISS and Charlson score), and fatality status. Similarly, external cause of injury data were complete for the years reported (2009 to 2012). We found hospital trauma center status to be missing in 0.14% of observations. Information necessary to calculate Barell matrix designations was missing for 20.2% of entries. This last issue was not unexpected since the Barell matrix relies on a full 5-digit ICD-9 code and some of the codes were limited to 4 digits. We deferred using multiple imputation methods given the overly complex survey design requiring complex linkages and the number or records (millions) requiring computation power exceeding the capability of our research team, and instead restricted our statistics to full-case records with sensitivity analyses recognizing the limitations of this approach.
Conclusions
In conclusion, this analysis represents one of the most comprehensive, recent snapshots of trauma in US emergency departments. We find that ED care for traumatic injury is evolving in consequential ways. The types and causes of traumatic injury, particularly among the oldest and youngest members of society are changing, with traumatic brain injury and violence increasingly important. While Level 1 or 2 trauma centers continue to provide the bulk of care and with good results, increasing comorbidities and injury severity may be expected to exert both clinical and economic pressures across the full spectrum of hospital-based emergency trauma care.
Figure 6.
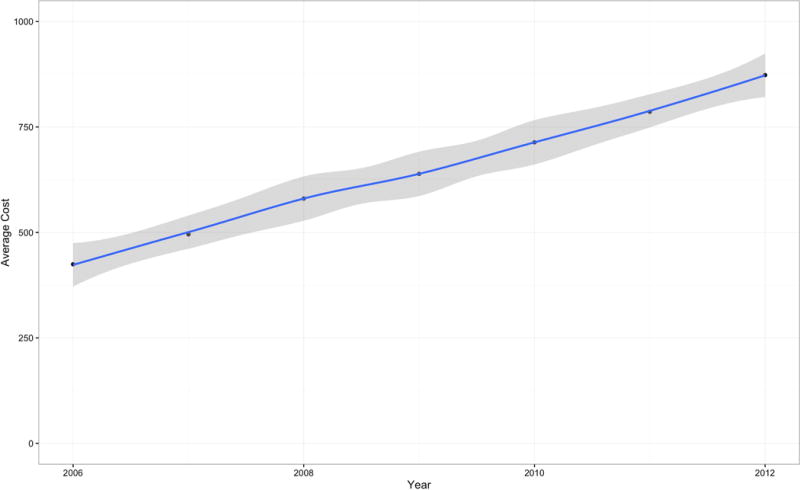
Average Cost of Injury-Related Emergency Department Visit by Year, 2012 Inflation-Adjusted Dollars. United States Hospitals, 2006-2012.
Acknowledgments
This study was funded in part by grant, R01-HD087460, awarded by the National Institute of Child Health and Human Development at the National Institutes of Health. Study funders had no role in the study design, analysis, drafting of the manuscript, or decision to submit the study for publication.
Grants: Grant 1 R01 HD087460, National Institute of Child Health and Human Development (DiMaggio).
Footnotes
Conflicts of interest: The authors have no conflicts of interest to declare.
Author contributions: CD conceived the study, acquired and had full access to the data, obtained IRB approval, conducted all analyses, co-wrote the initial draft of the manuscript, interpreted the results, made critical revisions, and had final approval of the version to be published. JA co-wrote the initial draft of the manuscript and provided important revisions and edits. DL and SF provided important revisions and edits, and approved the final version of the report. Along with CD, SW conceived of the study, reviewed, approved and contributed to the final version of the report.
References
- 1.Web-based injury statistics query and reporting system (WISQARS), Leading causes of death reports, national and regional, 1999-2014. Centers for Disease Control and Prevention; [Accessed Sept 11, 2016]. http://webappa.cdc.gov/sasweb/ncipc/leadcaus10_us.html. Published June 24, 2015. [Google Scholar]
- 2.Segui-Gomez M, MacKenzie E. Measuring the public health impact of injuries. Epidemiol Rev. 2003;25:3–19. doi: 10.1093/epirev/mxg007. [DOI] [PubMed] [Google Scholar]
- 3.Web-based injury statistics query and reporting system (WISQARS), Leading causes of nonfatal injury reports, 2001-2014. Centers for Disease Control and Prevention; [Accessed Sept 10, 2016]. http://webappa.cdc.gov/sasweb/ncipc/nfilead2001.html Published March 28, 2013. [Google Scholar]
- 4.Web-based injury statistics query and reporting system (WISQARS), Cost of injuries and violence in the United States. Centers for Disease Control and Prevention; [Accessed Sept 11, 2016]. http://www.cdc.gov/injury/wisqars/overview/cost_of_injury.html Published July 29, 2016. [Google Scholar]
- 5.Bonnie RJ, Fulco CE, Liverman CT, editors. Reducing the burden of injury: advancing prevention and treatment. Washington, D.C.: National Academies Press; 1999. [PubMed] [Google Scholar]
- 6.National electronic injury surveillance system (NEISS) [Sept 20, 2016];US Consumer Product Safety Commission. http://www.cpsc.gov/en/Research--Statistics/NEISS-Injury-Data/
- 7.Sise RG, Calvo RY, Spain DA, Weiser TG, Staudenmayer KL. The epidemiology of trauma-related mortality in the United States from 2002 to 2010. J Trauma Acute Care Surg. 2014;76(4):913–20. doi: 10.1097/TA.0000000000000169. [DOI] [PubMed] [Google Scholar]
- 8.Kauvar D, Sarfati M, Kraiss L. National trauma databank analysis of mortality and limb loss in isolated lower extremity vascular trauma. J Vasc Surg. 2011;53(6):1598–1603. doi: 10.1016/j.jvs.2011.01.056. [DOI] [PubMed] [Google Scholar]
- 9.Jain NB, Ayers GD, Peterson EN, et al. Traumatic spinal cord injury in the United States,1993-2012. JAMA. 2015;313(22):2236–43. doi: 10.1001/jama.2015.6250. [DOI] [PMC free article] [PubMed] [Google Scholar]
- 10.Nabeel Zafar S, Rushing A, Haut ER, et al. Outcome of selective non-operative management of penetrating abdominal injuries from the North American National Trauma Database. Br J Surg. 2012;99(S1):155–64. doi: 10.1002/bjs.7735. [DOI] [PubMed] [Google Scholar]
- 11.Asemota AO, George BP, Bowman SM, Haider AH, Schneider EB. Causes and trends in traumatic brain injury for United States adolescents. J Neurotrauma. 2013;30(2):67–75. doi: 10.1089/neu.2012.2605. [DOI] [PubMed] [Google Scholar]
- 12.Introduction to the Healthcare Cost and Utilization Project's (HCUP) Nationwide Emergency Department Sample (NEDS), 2013. Agency for Healthcare Research and Quality; [Sept 20, 2016]. https://www.hcup-us.ahrq.gov/db/nation/neds/NEDS2013Introduction.pdf. Published Dec, 2015. [Google Scholar]
- 13. [Sept 15, 2015];R: A language and environment for statistical computing R development core team, version 3.0.2. http://www.r-project.org/ht Published 2015.
- 14.HCUPnet. Healthcare Cost and Utilization Project, 2006-2009. Agency for Healthcare Research and Quality; [Sept 15, 2015]. http://hcupnet.ahrq.gov. [PubMed] [Google Scholar]
- 15.American Medical Association. International classification of diseases, 9th revision, clinical modification: physician ICD-9-CM, 2005. Chicago, IL: AMA Press; 2004. [Google Scholar]
- 16.HCUP methods series: special study on the meaning of the first listed diagnosis on emergency department and ambulatory surgery records. Agency for Healthcare Research and Quality; [Sept 15, 2015]. https://www.hcup-us.ahrq.gov/reports/methods/2011_03.pdf Published Oct 4, 2011. [Google Scholar]
- 17.Wasey J. icd9: tools for working with ICD-9 codes, and finding comorbidities. R Package. http://CRAN.R-project.org/package=icd9 Published April 15, 2016.
- 18.Osler T, Rutledge R, Deis J, Bedrick E. ICISS: an international classification of disease-9 based injury severity score. J Trauma. 1996;41(3):380–8. doi: 10.1097/00005373-199609000-00002. [DOI] [PubMed] [Google Scholar]
- 19.Seguí-Gómez M, Lopez-Valdes FJ. Injury Severity Scaling. In: Li G, Baker SP, editors. Injury Research. Vol. 2012. New York, NY: Springer; p. 291. [Google Scholar]
- 20.Gedeborg R. Joint meeting of international collaborative effort on injury statistics and the global burden of disease-injury expert group. National Center for Health Statistics. Centers for Disease Control and Prevention; [Sept 15, 2016]. Injury incidence over time based on hospital admissions filtering by thresholds, risk categories or indicator diagnoses. http://www.cdc.gov/nchs/injury/ice/boston2009/boston2009_proceedings.htm - proceeding_07 Published Dec 18, 2009. Updated Nov 6, 2015. [Google Scholar]
- 21.DiMaggio C, Ayoung-Chee P, Shinseki M, et al. Traumatic injury in the United States: In-patient epidemiology 2000-2011. Injury. 2016;47(7):1393–1403. doi: 10.1016/j.injury.2016.04.002. [DOI] [PMC free article] [PubMed] [Google Scholar]
- 22.Charlson ME, Pompei P, Ales KL, MacKenzie CR. A new method of classifying prognostic comorbidity in longitudinal studies: development and validation. J Chronic Diseases. 1987;40(5):373–83. doi: 10.1016/0021-9681(87)90171-8. [DOI] [PubMed] [Google Scholar]
- 23.Barell V, Aharonson-Daniel L, Fingerhut LA, et al. An introduction to the Barell body region by nature of injury diagnosis matrix. Inj Prev. 2002;8(2):91–6. doi: 10.1136/ip.8.2.91. [DOI] [PMC free article] [PubMed] [Google Scholar]
- 24.Fingerhut LA, Aharonson DL, Mackenzie EJ, et al. The barell matrix. Inj Prev. 2002;8(3):259. doi: 10.1136/ip.8.3.259. [DOI] [PMC free article] [PubMed] [Google Scholar]
- 25.Lumley T. Analysis of complex survey samples. Journal of Statistical Software. 2004;9(1):1–19. [Google Scholar]
- 26.Lumley Thomas. [Nov 10, 2016];Sqlsurvey: Analysis of Very Large Complex Survey Samples (Experimental) R package version 0.6-11/r41. https://R-Forge.R-project.org/projects/sqlsurvey/. Published 2014.
- 27.Harrell Frank E., Jr [Sept 24, 2016];RMS: Regression Modeling Strategies. R package version 4.5-0. https://CRAN.R-project.org/package=rms.
- 28.Venables WN, Ripley BD. Modern Applied Statistics with S. New York, NY: Springer; 2002. [Google Scholar]
- 29.Fox J, Weisberg S. An R companion to applied regression. Sage; 2010. [Sept 25, 2016]. http://socserv.socsci.mcmaster.ca/jfox/Books/Companion. Modified April 26, 2011. [Google Scholar]
- 30.Bieler GS, Brown GG, Williams RL, Brogan DJ. Estimating model-adjusted risks, risk differences, and risk ratios from complex survey data. Am J of Epidem. 2010;171(5):618–23. doi: 10.1093/aje/kwp440. [DOI] [PubMed] [Google Scholar]
- 31.STROBE Statement. Strengthening the reporting of observational studies in epidemiology. Institute for Social and Preventative Medicine; University of Bern: [Oct 23, 2016]. http://www.strobe-statement.org/fileadmin/Strobe/uploads/checklists/STROBE_checklist_v4_combined.pdf. Published Oct 2007. [Google Scholar]
- 32.Venkat A. The Challenge for Emergency Medicine: The Next Five Years and Beyond. Emerg Med News. 2011;33(12) [Google Scholar]
- 33.Boyd CR, Tolson MA, Copes WS. Evaluating trauma care: the TRISS method. J Trauma and Acute Care Surg. 1987;27(4):370–8. [PubMed] [Google Scholar]
- 34.Haider AH, Risucci DA, Omer SB, et al. Injury prevention priority score: a new method for trauma centers to prioritize injury prevention initiatives. J Am College of Surg. 2004;198(6):906–13. doi: 10.1016/j.jamcollsurg.2004.02.013. [DOI] [PubMed] [Google Scholar]
- 35.Zonfrillo MR, Kim KH, Arbogast KB. Emergency department visits and head computed tomography utilization for concussion patients from 2006 to 2011. Acad Emerg Med. 2015;22(7):872–7. doi: 10.1111/acem.12696. [DOI] [PMC free article] [PubMed] [Google Scholar]
- 36.Hu G, Baker SP. Recent increases in fatal and non-fatal injury among people aged 65 years and over in the USA. Inj Prev. 2010;16(1):26–30. doi: 10.1136/ip.2009.023481. [DOI] [PubMed] [Google Scholar]
- 37.Feeney JM, Neulander M, DiFiori M, et al. Direct oral anticoagulants compared with warfarin in patients with severe blunt trauma. Injury. 2016;S0020-1383(16):30416–8. doi: 10.1016/j.injury.2016.08.016. [DOI] [PubMed] [Google Scholar]
- 38.Wood B, Ackery A, Rizoli S, et al. P142: The anticoagulated trauma patient: a Canadian experience in the era of direct oral anticoagulants. CJEM. 2016;18(S1):S125. [Google Scholar]
- 39.Kalesan B, Vyliparambil MA, Bogue E, et al. Race and ethnicity, neighborhood poverty and pediatric firearm hospitalizations in the United States. Ann Epidemiol. 2016;26(1):1–6. doi: 10.1016/j.annepidem.2015.10.009. [DOI] [PubMed] [Google Scholar]
- 40.Kalesan B, Vasan S, Mobily ME, et al. State-specific, racial and ethnic heterogeneity in trends of firearm-related fatality rates in the USA from 2000 to 2010. BMJ Open. 2014;4(9):e005628. doi: 10.1136/bmjopen-2014-005628. [DOI] [PMC free article] [PubMed] [Google Scholar]
- 41.Srinivasan S, Mannix R, Lee LK. Epidemiology of paediatric firearm injuries in the USA, 2001-2010. Arch Dis Child. 2014;99(4):331–5. doi: 10.1136/archdischild-2013-304642. [DOI] [PubMed] [Google Scholar]
- 42.Tashiro J, Lane RS, Blass LW, Perez EA, Sola JE. The effect of gun control laws on hospital admissions for children in the United States. J Trauma Acute Care Surg. 2016;81(4S1):S54–60. doi: 10.1097/TA.0000000000001177. [DOI] [PubMed] [Google Scholar]
- 43.Kalesan B, Mobily ME, Keiser O, Fagan JA, Galea S. Firearm legislation and firearm mortality in the USA: a cross-sectional, state-level study. Lancet. 2016;387(10030):1847–55. doi: 10.1016/S0140-6736(15)01026-0. [DOI] [PubMed] [Google Scholar]
- 44.Owens PL, Barrett ML, Gibson TB, Andrews RM, Weinick RM, Mutter RL. Emergency department care in the United States: a profile of national data sources. Ann Emerg Med. 2010;56(2):150–65. doi: 10.1016/j.annemergmed.2009.11.022. [DOI] [PubMed] [Google Scholar]
- 45.LeMier M, Cummings P, West TA. Accuracy of external cause of injury codes reported in Washington State hospital discharge records. Inj Prev. 2001;7(4):334–8. doi: 10.1136/ip.7.4.334. [DOI] [PMC free article] [PubMed] [Google Scholar]
- 46.Hirshon JM, Warner M, Irvin CB, et al. Research using emergency department–related data sets: current status and future directions. Acad Emerg Med. 2009;16(11):1103–9. doi: 10.1111/j.1553-2712.2009.00554.x. [DOI] [PMC free article] [PubMed] [Google Scholar]
- 47.Miller ML, Wang MC. Accuracy of ICD-9-CM coding of cervical spine fractures: Implications for research using administrative databases. Ann Adv Automot Med. 2008;52:101–108. [PMC free article] [PubMed] [Google Scholar]
- 48.Kuhne CA, Ruchholtz S, Kaiser GM, Nast-Kolb D, Working Group on Multiple Trauma of the German Society of Trauma Mortality in severely injured elderly trauma patients--when does age become a risk factor? World J Surg. 2005;29(11):1476–82. doi: 10.1007/s00268-005-7796-y. [DOI] [PubMed] [Google Scholar]
- 49.Calland JF, Xin W, Stukenborg GJ. Effects of leading mortality risk factors among trauma patients vary by age. J Trauma Acute Care Surg. 2013;75(3):501–5. doi: 10.1097/TA.0b013e31829bb75c. [DOI] [PubMed] [Google Scholar]
- 50.Ottochian M, Salim A, DuBose J, Teixeira PG, Chan LS, Margulies DR. Does age matter? The relationship between age and mortality in penetrating trauma. Injury. 2009;40(4):354–7. doi: 10.1016/j.injury.2008.10.015. [DOI] [PubMed] [Google Scholar]
- 51.Joohyun S, Jaeheon J, Cook-Jong L, Yunjung H, Heejung W, Kyoungwon J. Risk factors for mortality of severe trauma based on 3 years' data at a single Korean institution. Annuls of surg treatment and research. 2015;89(4):215–19. doi: 10.4174/astr.2015.89.4.215. [DOI] [PMC free article] [PubMed] [Google Scholar]
- 52.Stevenson M, Segui-Gomez M, Lescohier I, Di Scala C, McDonald-Smith G. An overview of the injury severity score and the new injury severity score. Inj Prev. 2001;7(1):10–3. doi: 10.1136/ip.7.1.10. [DOI] [PMC free article] [PubMed] [Google Scholar]
- 53.Palmer C. Major trauma and the injury severity score--where should we set the bar? Annu Proc Assoc Adv Automot Med. 2007;51:13–29. [PMC free article] [PubMed] [Google Scholar]
- 54.Agency for Healthcare Research and Quality. Healthcare Cost and Utilization Project. [10 February 2017];Introduction to the HCUP Nationwide Emergency Department Sample (NEDS) 2012 https://www.hcup-us.ahrq.gov/db/nation/neds/NEDS_Introduction_2012.jsp.