

Abstract
Elevated iron and decreased copper levels are cardinal features of the degenerating substantia nigra pars compacta in the Parkinson’s disease brain. Both of these redox-active metals, and fellow transition metals manganese and zinc, are found at high concentrations within the midbrain and participate in a range of unique biological reactions. We examined the total metal content and cellular compartmentalisation of manganese, iron, copper and zinc in the degenerating substantia nigra, disease-affected but non-degenerating fusiform gyrus, and unaffected occipital cortex in the post mortem Parkinson’s disease brain compared with age-matched controls. An expected increase in iron and a decrease in copper concentration was isolated to the soluble cellular fraction, encompassing both interstitial and cytosolic metals and metal-binding proteins, rather than the membrane-associated or insoluble fractions. Manganese and zinc levels did not differ between experimental groups. Altered Fe and Cu levels were unrelated to Braak pathological staging in our cases of late-stage (Braak stage V and VI) disease. The data supports our hypothesis that regional alterations in Fe and Cu, and in proteins that utilise these metals, contribute to the regional selectively of neuronal vulnerability in this disorder.
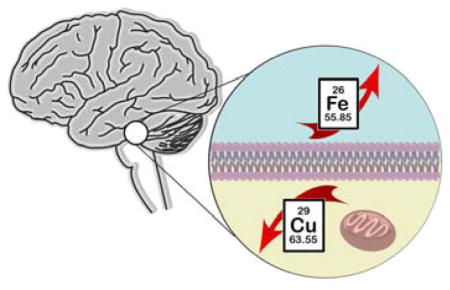
Graphical Abstract
Altered iron and copper levels in the Parkinson’s disease substantia nigra are confined to the cytosolic compartment of the cell.
Introduction
The brain contains some of the highest concentrations of iron (Fe), copper (Cu), zinc (Zn) and manganese (Mn) in the human body.1 These metals are responsible for numerous cellular functions including synaptic transmission, myelinogenesis, energy production and regulation of oxidative stress. Many of these biochemical processes rely on metals for transfer of electrons via redox chemistry, neuronal excitation, protein structure and enzymatic function.2 Alterations in the levels and distribution of these transition metals are consistently reported in the Parkinson’s disease brain,3,4 with the best documented change being elevated levels of Fe in the substantia nigra pars compacta (SNc). Abnormal deposition of Fe in the Parkinson’s disease brain was first reported in 1924;5 since then numerous studies have identified significantly increased Fe levels within vulnerable brain regions in this disorder beyond those observed in healthy aged-matched brains.6,7
Additionally, a concomitant decrease in Cu concentration has also been reported in degenerating regions of the Parkinson’s disease brain,8,9 while data regarding Zn levels are conflicting.3,10 Occupational exposure to Mn alone has been demonstrated to cause parkinsonism,11 highlighting the necessity for tight Mn regulation in the brain.
To date, most studies have described regional alterations in total metal levels (typically Fe) in whole tissue samples.3,6,12,13 While such studies are useful to identify the neuroanatomical location of changes in specific metals, alterations at the cellular and subcellular level in the Parkinson’s disease brain are less well understood. Determining the cellular compartment in which these changes occur may aid in determining the underlying cause of these alterations, and the pathological effects subsequently produced in their subcellular environment.
In this study, we examined the subcellular compartmentalisation of Mn, Fe, Cu and Zn in three regions of the Parkinson’s disease brain displaying varying degrees of neurodegeneration and proteinopathology. We separated tissue samples into three fractions representing the ‘soluble’, ‘membrane-associated’ and ‘insoluble’ tissue components respectively, to identify the specific cellular compartment in which metal alterations are most marked. We also examined whether total metal levels were altered according to late-stage Braak pathology.
Experimental
Ethics, consent and permissions
Human ethics for this study was granted by the University of Sydney (ID: 2015/202) and the University of Melbourne (ID: 1136882).
Human brain tissue
In total, fresh frozen human post-mortem brain tissue was obtained from 13 Parkinson’s disease (PD) subjects and 11 age-matched controls (Ctrl). Three specific regions were analyzed: substantia nigra (SN; encompassing both pars reticulata and pars compacta regions; nPD = 9, nCtrl = 8), fusiform gyrus (FUS; nPD = 9, nCtrl = 8) and occipital cortex (OCx; nPD = 11, nCtrl = 11) were obtained from the New South Wales and Sydney Brain Banks. Demographic details for these cases are shown in Table 1. All Parkinson’s disease cases were receiving levodopa at the time of death; other anti-parkinsonian medications prescribed (n = 1 case per medication) were a COMT inhibitor, a MAO inhibitor, a drug trial of Sarizotan (a 5-HT1A agonist and D2 dopamine receptor antagonist), and a dopamine agonist.
Table 1.
Demographic details for experimental tissue. PD = Parkinson’s disease; PMI = post-mortem interval; SEM = standard error of mean; NA = not available
| Case | Age | Sex | Disease duration | Primary cause of Death | Tissue pH | Braak staging of PD | PMI |
|---|---|---|---|---|---|---|---|
| PD1 | 82 | M | 5 | Cardiorespiratory failure | 6.72 | V | NA |
| PD2 | 82 | F | 15 | Cerebrovascular accident | 6.95 | V | NA |
| PD3 | 83 | F | 14 | Pneumonia | 6.69 | V | 7 |
| PD4 | 69 | M | 17 | Bronchopneumonia | 5.99 | V | NA |
| PD5 | 90 | M | 7 | Respiratory failure | 6.25 | V | NA |
| PD6 | 85 | F | 17 | Cerebrovascular accident | 6.58 | V | 26 |
| PD7 | 74 | M | 8 | Cerebrovascular accident | 5.86 | VI | NA |
| PD8 | 83 | F | 14 | Cardiorespiratory failure | 6.2 | V | 32 |
| PD9 | 79 | M | 17 | Septicaemia | 6.7 | VI | 42 |
| PD10 | 88 | M | 23 | Cardiorespiratory failure | 6.6 | V | 5 |
| PD11 | 82 | M | 22 | Cardiorespiratory failure | 6.4 | VI | 19 |
| PD12 | 82 | M | 8 | Cardiorespiratory failure | 6.3 | VI | 22 |
| PD13 | 77 | M | 15 | Aspiration pneumonia | 6.4 | V | 15 |
| Mean (SEM) | 81.23 (2.36) | 9M:4F | 14 (2.37) | - | 6.43 (0.56) | 9V:4VI | 21 (3.52) |
|
| |||||||
| Ctrl1 | 85 | F | - | Pneumonia | 6.4 | - | 23 |
| Ctrl2 | 79 | M | - | Pulmonary embolism | 6.7 | - | 8 |
| Ctrl3 | 84 | F | - | Cardiorespiratory failure | 6.5 | - | 6 |
| Ctrl4 | 89 | F | - | Metastatic adenocarcinoma | 6 | - | 23 |
| Ctrl5 | 91 | M | - | Cardiorespiratory failure | 5.9 | - | 13 |
| Ctrl6 | 89 | M | - | Cardiorespiratory failure | 6.1 | - | 33 |
| Ctrl7 | 102 | F | - | Acute renal failure | 5.92 | - | NA |
| Ctrl8 | 89 | M | - | Cardiorespiratory failure | 6.7 | - | 22 |
| Ctrl9 | 88 | F | - | Cardiorespiratory failure | 6.2 | - | 31 |
| Ctrl10 | 49 | M | - | Cardiorespiratory failure | 6.5 | - | 47 |
| Ctrl11 | 41 | M | - | Cardiorespiratory failure | 7 | - | 48 |
| Mean (SEM) | 80.55 (4.30) | 6M:5F | - | 6.36 (0.60) | - | 25.4 (3.82) | |
Tissue preparation
Tissue preparation was adapted from our previously published methods.14–17 Tissue samples (11.6–22.5 mg wet weight) were homogenised with a hand-held dounce (Omni BioMasher, Georgia, USA) in 3 × tissue weight of Tris buffered saline (TBS: 50 mM Tris; 150 mM NaCl; pH 8.0) containing EDTA free protease inhibitors (Roche, NSW, Australia). Samples were centrifuged at 16,000 g for 15 min at 4°C before the supernatant fraction was collected and stored at −80°C. This was termed the ‘soluble fraction’, and represented all cytosolic proteins and the interstitium. The remaining tissue pellet was resuspended in 3 × tissue weight of urea buffer (7M urea; 2M thiourea, 4% 3-[(3-cholamindopropyl) dimethylammonio]-1-propanesulfonate (CHAPS); 30mM Bicine; pH 8.5; Sigma, NSW, Australia) and centrifuged 16,000 g for 30 min at 4°C and the resultant supernatant was collected and stored at −80°C. This was termed the ‘membrane fraction’, representing both membrane-bound proteins and those encased within cellular organelles. The final pellet was resuspended in 3 × tissue weight of 70% formic acid overnight before being centrifuged at 16,000 g for 30 min and the resultant supernatant collected and stored at −80°C. This was termed the ‘insoluble fraction’, and represented all material not previously extracted. No observable material remained following the final preparation step.
Inductively coupled plasma-mass spectrometry (ICP-MS)
ICP-MS analysis was performed according methods previously reported.18 Each fraction was randomised before being thawed on ice and diluted 1:20 with 1% HNO3 (v/v; Suprapur grade, Merk Millipore, VIC, Australia) prior to analysis. Total metal levels in each fraction were measured using an Agilent Technologies 7700x ICP-MS system with a Teflon MiraMist concentric nebuliser and Scott-type double-pass spray chamber (Glass Expansion, VIC, Australia). Helium (3 mL min−1) was used as a collision gas for removal of polyatomic interferences. Measured mass-to-charge (m/z) ratios were 55 (Mn), 56 (Fe), 63 (Cu) and 64 (Zn). External calibration was performed using multi-element standards (Sigma) diluted in 1% HNO3 and yttrium (Y; m/z = 89; Accustandard, Connecticut, USA) was used as reference element via online introduction with a Teflon T-piece.
Statistical analysis
Statistical analyses were performed using Prism v6.0h (GraphPad, California, USA) for absolute metal levels, and SPSS v22.0 (IBM), and CoDaPack for compositional data.19 A Student’s two-tailed t-test was performed to confirm age-matching, and a chi-squared test for sex-matching and comparing Braak stage. Tissue samples were background corrected according to their respective buffers, adjusted for dilution factors and standardised against original wet sample weights to obtain concentrations in microgram per gram (μg g−1) of wet tissue weight. Samples below instrument limit of detection were excluded from analysis.20 Outliers were identified using the combined robust regression and outlier removal (ROUT) method with a maximum false discovery rate of 5%.21 Total metal levels were calculated as the sum of the metal content in each fraction. Metal concentrations in each fraction for control and Parkinson’s disease groups were compared using one-way analysis of variance (ANOVA) followed by Sidak post hoc correction for multiple comparisons, or a Student’s two-tailed t-test, as noted in the results. For analysis of metal distribution within fractions between control and Parkinson’s disease groups, centered-transformations22 were performed in CoDaPack and the subsequent compositional data was compared using multivariate ANOVA in SPSS. All charts were drawn using Prism. A significant difference was defined as p < 0.05.
Results
Regional distribution of total metal levels in the healthy and diseases substantia nigra, occipital cortex and fusiform gyrus
Copper concentrations were regionally varied in the healthy brain with significantly higher levels of Cu in the healthy SN compared with the OCx and FUS (+153% vs OCx, p < 0.01; +233% vs FUS, p < 0.001; one-way ANOVA; Fig. 1a). The concentration of Cu in the Parkinson’s disease SN was approximately half that of control SN (−54%, p < 0.05; Student’s two-tailed t-test), resulting in the significant difference between nigral Cu concentration and that in the OCx and FUS observed in the healthy brain being absent in Parkinson’s disease tissue.
Fig. 1.

Biometal distribution in the occipital cortex (OCx) fusiform gyrus (FUS) and substantia nigra (SN) of healthy aged controls and Parkinson’s disease. (a) The concentration of Cu in control tissue was highest in the SN, though in the Parkinson’s disease brain Cu concentrations decreased to levels equivalent to that in the control SN. (b) In control brains, the concentration of Fe in the SN was also significantly higher than the FUS and OCx regions. Iron concentrations were further elevated in the Parkinson’s disease SN. (c) Zinc concentrations were lowest in the OCx, and (d) Mn was highest within the SN. Neither Zn or Mn were altered in the Parkinson’s disease OCx, FUS or SN. * p < 0.05, ** p < 0.01, *** p < 0.001 (vs control regions); # p < 0.05, ### p < 0.001 (control vs Parkinson’s disease SN). All concentrations are μg g−1 wet weight of tissue.
As expected, Fe was significantly higher in the healthy SN compared with FUS (+106%, p < 0.05) and OCx (+61%, p < 0.05; Fig. 1b). In Parkinson’s disease brain, this greater concentration of nigral Fe was more pronounced, with nigral concentrations representing more than twice (+210%) that of the Parkinson’s disease OCx (p < 0.001) and three times (+338%) that of the Parkinson’s disease FUS (p < 0.001; all one-way ANOVA), reflecting an accumulation of Fe within the Parkinson’s disease SN (+105% vs control SN, p < 0.05; Student’s two-tailed t-test). Both the Parkinson’s disease OCx and FUS did not show significant changes in Fe concentration when compared to healthy controls. Zinc levels were unaltered in the Parkinson’s disease brain in the three regions analysed, though the control OCx contained less Zn than both the healthy FUS (−24%, p < 0.01) and SN (−22%, p < 0.01; one-way ANOVA; Fig. 1c). Manganese concentrations were significantly higher in both healthy and diseased SN, compared with the FUS (+40%, p < 0.01) and OCx (+ 32%, p < 0.01; Fig. 1d). Like Cu and Fe, Mn was more concentrated in the healthy SN than the OCx (+38%, p < 0.01) and FUS (+49%, p < 0.01; one-way ANOVA; Fig. S1b), though no changes were observed within regions according to disease state.
Transition metal alterations in cellular compartments of the Parkinson’s disease substantia nigra
In the Parkinson’s disease SN, the decreased Cu concentration was confined to the soluble faction (−53%; p < 0.01; Fig. 2a). No detectable Cu was observed in the insoluble fraction in control brains, but was detected in four of seven of the Parkinson’s disease SN samples. Similarly, in this region, we observed elevations in total Fe levels in the Parkinson’s disease SN that were also attributable to the soluble fraction (+124%, p < 0.01; Fig. 2b). Although total zinc levels were unchanged in the Parkinson’s disease SN, the membrane-associated fraction exhibited a significant decrease in this metal confined to this brain region (−34%; p < 0.01; Fig. 2c; Student’s two-tailed t-tests). Manganese levels did not differ in any fraction between controls and Parkinson’s disease tissue (Fig. 2d).
Fig. 2.

Within both the Parkinson’s disease and control SN, the majority of (a) Cu, (b) Fe, and (c) Zn was present in the soluble fraction, followed by the membrane and insoluble fractions, respectively. (d) For Mn, equivalent amounts were distributed between the soluble and membrane-bound fractions. In the Parkinson’s disease SN, the observed reduction in total Cu and increase in total Fe are confined to the soluble fraction, and a decrease in Zn within the membrane-associated fraction was also observed, although total Zn levels were not altered. ## p < 0.01, (control vs Parkinson’s disease). All concentrations are μg g−1 wet weight of tissue.
The percentage distribution of Cu, Fe, Zn and Mn (Table 2) in the insoluble, membrane-associated and soluble fraction was not altered in any brain region between the healthy aged-control and Parkinson’s disease brain. This suggests that intrinsic metal dyshomeostasis (i.e. decreased Cu and increased Fe levels) is not merely a redistribution of available metals, but instead remains distributed equivalently, with only absolute levels markedly altered in the Parkinson’s disease SN.
Table 2.
Percentage distribution of Cu, Fe, Zn and Mn in insoluble, membrane-bound and soluble fractions of control and Parkinson’s disease brain. All data mean ± 1SD.
| OCx | FUS | SN | ||||
|---|---|---|---|---|---|---|
| Control | PD | Control | PD | Control | PD | |
| Cu | ||||||
| Insoluble | 0.66 ± 1.57 | 0.16 ± 0.54 | >0.01 | >0.01 | >0.01 | 2.04 ± 5.30 |
| Membrane | 21.41 ± 7.88 | 19.92 ± 9.78 | 20.49 ± 3.93 | 22.13 ± 5.56 | 14.94 ± 4.97 | 11.14 ± 5.63 |
| Soluble | 77.93 ± 7.28 | 79.92 ± 9.67 | 79.51 ± 3.93 | 77.87 ± 5.56 | 85.06 ± 4.97 | 86.82 ± 7.15 |
|
| ||||||
| Fe | ||||||
| Insoluble | 5.10 ± 3.48 | 6.16 ± 2.97 | 3.64 ± 3.12 | 3.48 ± 2.52 | 5.60 ± 3.71 | 6.50 ± 3.55 |
| Membrane | 36.60 ± 12.68 | 35.04 ± 12.16 | 44.56 ± 8.31 | 41.13 ± 4.39 | 37.93 ± 8.48 | 26.56 ± 14.32 |
| Soluble | 58.30 ± 10.23 | 58.79 ± 12.36 | 51.80 ± 6.50 | 55.40 ± 4.89 | 56.47 ± 8.89 | 66.94 ± 14.44 |
|
| ||||||
| Zn | ||||||
| Insoluble | 7.16 ± 3.78 | 6.47 ± 2.08 | 7.37 ± 3.95 | 6.66 ± 3.46 | 4.45 ± 1.20 | 7.33 ± 3.66 |
| Membrane | 43.19 ± 7.85 | 44.34 ± 10.02 | 48.24 ± 4.43 | 51.83 ± 4.01 | 40.40 ± 4.69 | 29.96 ± 6.62 |
| Soluble | 49.65 ± 5.63 | 49.20 ± 9.58 | 44.39 ± 5.46 | 41.51 ± 2.97 | 55.15 ± 5.16 | 62.71 ± 4.41 |
|
| ||||||
| Mn | ||||||
| Insoluble | 2.24 ± 2.55 | 6.47 ± 6.67 | 2.48 ± 3.71 | 2.22 ± 2.39 | 2.46 ± 3.37 | 4.49 ± 2.80 |
| Membrane | 45.05 ± 12.58 | 44.83 ± 17.92 | 54.13 ± 7.49 | 51.67 ± 5.22 | 44.71 ± 4.03 | 38.73 ± 14.37 |
| Soluble | 52.71 ± 11.72 | 48.70 ± 15.65 | 43.39 ± 5.20 | 46.12 ± 4.85 | 52.83 ± 4.46 | 56.77 ± 12.37 |
Are altered metal levels in the Parkinson’s disease substantia nigra related to late Braak staging?
All cases assessed were late-stage Parkinson’s disease, and at post mortem all were classified as either Braak stage V and four stage VI, per the established pathological criteria.23 No significant difference in total metal levels were observed in any of Parkinson’s disease tissue from three regions assessed, other than a slight, non-significant decrease in Fe levels in the FUS (−12%, p = 0.055) (Fig. S2). A significantly higher Fe concentration in the membrane fraction of the SN (+392%; p < 0.05), and lower Fe concentration in the soluble phase of the OCx (−31%; p < 0.01; Fig. 3), was observed in stage VI cases compared to stage V, though the small sample size and large variance within the SN suggests these data should be interpreted with caution (see Discussion).
Fig. 3.

Concentration of (a) Cu, (b) Fe, (c) Zn, (d) and Mn in cellular fractions according to Braak staging in the Parkinson’s disease OCx, FUS and SN. Only Fe shows any significant change in concentration between Braak stage V and VI, with a decrease in the soluble fraction of OCx and increase in the membrane-bound fraction in the SN in stage VI. # p < 0.05; ## p < 0.01. I = insoluble, M = membrane, S = soluble.
Discussion
The regions selected in this study represent three distinct pathological states in the Parkinson’s disease brain. The SN is the primary site of dopaminergic neurodegeneration which results in the clinical movement disorder.24 The dopaminergic FUS displays synucleinopathy and atrophy25 and is associated with visual hallucinations and Parkinson’s disease with dementia, albeit in the absence of neurodegeneration.26 Finally, the OCx represents an ‘internal control’, in that this region exhibit neither Lewy pathology nor degeneration in Parkinson’s disease.
The region-specific distribution of total Cu and Fe in the three measured regions of the healthy brain we report here was consistent with previous reports.27–29 In the Parkinson’s disease brain, significant differences in metal levels were confined to the SN, specifically a decrease in total Cu and increase in total Fe. Our group has previously reported a −45% change in total SN Cu levels,8 while others have reported similar decreases (−51% by Ayton et al.30 and −34–45% in Dexter et al.’s landmark study from 198931). Increased nigal Fe is a well-established feature of Parkinson’s disease from numerous observational studies, and was further supported by a recent meta-analysis of these reports.7
For the first time, we have isolated these changes to the ‘soluble’ cellular fraction, which represents the interstitium and cytoplasm.17 Within this fraction are aqueous proteins including antioxidant enzymes, as well as free metals present in the tissue. Membrane-associated metal-protein complexes likely comprises of protein channels and pumps involved in transfer of metals across cell plasma membrane, and metals found within membrane-bound organelles. Despite moderate metal concentrations in the membrane-associated fractions (~35% total Fe, ~20% total Cu and ~45% total Zn; Table 2), similar changes in Cu and Fe observed in the soluble fraction were not observed. Metal-protein interactions for the purpose of transport across the plasma membrane or directed transport within the cells are likely to be transient however, and thus only a small proportion of membrane-associated transport proteins are likely to have been metal-bound at the time of extraction. A more stable pool of metals may be represented by plasma bound organelles such as mitochondria, which internalise Fe, Cu, Mn and Zn for both specific biological function or the synthesis of metalloproteins such as Fe-sulfur complexes or cytochrome c oxidase. Although mitochondrial dysfunction, and resulting effects on metal levels, are proposed to contribute to neuronal death in Parkinson’s disease,32 the fractionation technique used here may have masked subtle changes in mitochondrial metal levels and specific isolation of mitochondria from other membrane-encapsulated metals in Parkinson’s disease and control samples would be required.
The purpose of the current study was to establish the specific subcellular compartments in which known alterations in biometals occur. In doing so, we can then narrow the scope of future proteomic studies targeting these specific subcellular compartments using high-throughput shotgun proteomics methods,33 which are currently underway in our laboratory. In addition, as both a-synuclein and SOD1 are demonstrated to aggregate in Parkinson’s disease,34 determining the subcellular fraction where these metal changes occur allows us to then identify whether these alterations are associated with the soluble forms of these proteins, or the aggregated form which would reside in the insoluble fraction.
The insoluble component of SN homogenates represented only a small proportion of total metal levels and we observed no changes in metals in this fraction in any brain region. Within the healthy SN, the insoluble fraction is likely to comprise of the insoluble macromolecules neuromelanin and lipofuscin, cellular pigments which accumulate in the aging human brain35 and associate with metals, including Fe, Cu, Zn and Mn.28,29,35,36 These pigments are highly abundant in the aged human brain, for example neuromelanin fills almost 50% of the volume of SN dopaminergic soma in individuals in their eighth decade of life.37 Using in situ subcellular chemical imaging, we have previously reported increased Fe and decreased Cu associated with neuromelanin in the SNc neurons from the Parkinson’s disease brain,8 although here these changes may have been obscured by the presence of other equally abundant, but not disease-related, metal-binding biomolecules, such as lipofuscin, in this tissue fraction. The insoluble fraction of the Parkinson’s disease SN is also likely to include a smaller proportion by mass of small insoluble proteinaceous deposits, including Lewy bodies24 and SOD1 aggregates.34 While metals have been suggested to induce α-synculein oligomerisation and aggregation in vitro,38 it is unclear whether Lewy bodies retain metal ions. We recently demonstrated that SOD1 aggregates recently identified in Parkinson’s disease share pathological similarities with the deposited protein in familial amyotrophic lateral sclerosis spinal cord and SN,34 and this class of aggregate has been shown to be deficient in Cu.39 The different populations of insoluble protein aggregates in degenerating regions of the Parkinson’s disease brain may thus display metal associations that differ from that in the normal soluble protein, a hypothesis that could be tested using, for example, biochemical imaging analysis at the single aggregate level.
The disease-affected, but non-degenerating, FUS exhibited no evidence of perturbed metal levels supporting the hypothesis that metal dyshomeostasis, and associated oxidative stress, are restricted to specific degenerating regions of the Parkinson’s disease brain.40,41 This poses an interesting question regarding the toxicity of synucleinopathy pathways in brain regions where metal levels are normal. In vitro evidence suggests that metal ions interact with α-synuclein to promote oxidative stress and neuronal death,42 however, we report here that the FUS, which features accumulation of α-synuclein in Parkinson’s disease in the absence cell death does not exhibit altered metal levels. Maintenance of metal homeostasis may thus be sufficient to mitigate cell death, despite proteinopathy. Further, no measurable increase in Fe within the FUS compared to control implies that increased oxidative stress arising from the Fe/dopamine/α-synuclein axis does not occur within this brain region.43 The FUS has recently been established as a site of marked glial activation in Parkinson’s disease44 which suggests that neuroinflammatory processes are not contributing to an increased amount of total Fe.
Given that many transition metals pose a significant oxidative threat to tissues, the proportion of free, or ‘labile’ metals present is limited and highly regulated.45 In the healthy cell, the majority of Fe is present in the cytoplasm as the reduced ferric species46 and as part of a redox-silenced protein complex, which may utilise the metal for a specific biological function (e.g. Fe-catalysed activity of aromatic amino acid hydroxylases) or provide a mechanism for safe storage (e.g. ferritin). For instance, labile Fe present in a typical cell is estimated to account for around 3–5% of total cellular iron (~1–3 μg g−1), and labile Cu in the human cortex has been empirically measured at a similar concentration.47
Elevated Fe in the Parkinson’s disease SN has long been associated with neurotoxicity via various mechanisms such as oxidative,48 ferroptosis,49 and deleterious interactions between dopamine and Fe.43,50 It has long been argued whether Fe accumulation in the Parkinson’s disease SN is a potential upstream cause of disease51,52 or merely an effect of inflammation.53,54 Despite this however, both inflammatory responses, and increased intraneuronal Fe and altered intracellular Fe-regulating systems have been implicated Fe dyshomeostasis in neuronal loss in the PD brain. The importance of brain Fe changes in the aetiology of Parkinson’s disease may best be demonstrated by removal of excess levels of this metal. Iron chelation therapy using deferiprone to lower brain iron levels has showed promise in pilot clinical studies55 and is now in Phase IIa trials in recently-diagnosed Parkinson’s disease patients (FAIR PARK II; ClinicalTrials.gov identifier: NCT02655315).
Dysfunction in a range of Fe regulatory pathways have been associated with its neuronal accumulation in Parkinson’s disease,56 which we show here is primarily present in the soluble tissue fraction. These changes include decreased activity of the ferroxidase ceruloplasmin, an extracellular protein responsible for reducing Fe(II) to Fe(III) for transferrin loading after neuronal export,57 due to a lack of its required Cu cofactor.30 Modulation of ceruloplasmin has been proposed as a potential therapeutic strategy for Parkinson’s disease.58
An additional cuproprotein potentially affected by a reduction in cytosolic Cu is the antioxidant conferring enzyme superoxide dismutase-1 (SOD1). Recent data has demonstrated increased SOD1 protein levels, yet a marked decrease in enzymatic activity in the Parkinson’s disease SN,34 proposed to result due to a lack of an essential Cu-association with this protein. Given the key bioactive role for Cu-mediated antioxidant activity in the brain, Cu modulation is a potential therapeutic avenue for Parkinson’s disease,59 and the repurposed positron emission tomography agent copper(II) diacetylbis(N(4)-methylthiosemi-carbazonato), or CuII(atsm), has shown efficacy in transgenic and neurotoxin mouse models of Parkinson’s disease.60
The Braak staging scale used to describe the severity of Lewy pathology in the Parkinson’s disease brain does not necessarily reflect the more restricted pattern of neuronal loss in this disorder;24 nevertheless this method is considered the pathological standard for assessing Parkinson’s disease progression and severity. Braak staging refers to the progressive pattern of synucleinopathy deposition which originates in the brainstem and olfactory regions and spreads throughout the brain, classified according to six distinct stages at autopsy.23 Lewy pathology is first observed in the SN at stage III, and by stage VI it has spread throughout the neocortex. As post mortem Parkinson’s disease cases are typically retrieved at end-stage disease, our analysis was limited to Braak stage V and VI cases. We did not observe any consistent progression in the alterations in Cu or Fe levels between the two stages, suggesting that metal dyshomeostasis within the Parkinson’s disease SN occurs during earlier stages of the disease. This is consistent with reports of elevated Fe and Cu reductions in the SN of patients with incidental Lewy body disease,8 considered a prodromal form of Parkinson’s disease.61 A larger scale study examining metal levels in the SN and other degenerating, and non-degenerating brain regions, from Parkinson’s disease cases representing all six pathologically confirmed Braak stages would assist in determining possible relationships between metal dyshomeostasis and disease progression.
Conclusions
Although decreased Cu and elevated Fe levels in the Parkinson’s disease SN have been observed in numerous studies over the past few decades, we present here evidence that these changes are primarily present within the soluble component of this primary site of neurodegeneration. Further, no differences between Braak staging indicates that these alterations are likely to occur early in the disease process and are not merely a redistribution of metals within cellular fractions. In line with our previous studies, we postulate that disturbed levels of Fe and Cu within the Parkinson’s disease SN results in increased oxidative stress from excessive labile Fe, as well as an inadequate cellular response to increased oxidative load by Cu-deficient, dysfunctional cuproproteins. Combined, these two factors may represent key mechanisms contributing to neuronal death, but also practical targets for next-generation therapies.
Supplementary Material
Acknowledgments
We acknowledge funding from the Victorian Government’s Operational Infrastructure Support Program, Parkinson’s NSW and the University of Sydney (Biomedical Science, BRIG). DJH is supported by a National Health and Medical Research Council Industry Career Development Fellowship (1122981) in partnership with Agilent Technologies, GMH is the recipient of a National Health and Medical Research Council (Australia) Senior Principal Research Fellowship (1079679). We wish to thank the New South Wales and Sydney Brain Banks, the donors and their families. Tissues were received from the New South Wales Tissue Resource Centre at the University of Sydney supported by the National Health and Medical Research Council of Australia, Schizophrenia Research Institute and the National Institute of Alcohol Abuse and Alcoholism (NIH (NIAAA) R24AA012725) and from the Sydney Brain Bank which is supported by Neuroscience Research Australia, the University of New South Wales and the National Health and Medical Research Council of Australia.
Footnotes
Electronic Supplementary Information (ESI) available: Supplementary Figures. See DOI: 10.1039/x0xx00000x
Conflicts of interest
B.R.R. and D.J.H. receive material support from Agilent Technologies.
Author contributions
SG: designed and performed experiments, analyzed data, wrote drafts of manuscript. BRR: designed experiments. APG: performed experiments. GMH: provided materials support. SJGL: provided materials support. HJB: analyzed data. DJH: designed experiments, analyzed data, wrote and edited manuscript, administered project. KLD: designed experiments, analysed data, wrote and edited manuscript, administered project. All authors read and approved the manuscript.
Notes and references
- 1.Que EL, Domaille DW, Chang CJ. Chem Rev. 2008;108:4328–4328. doi: 10.1021/cr078203u. [DOI] [PubMed] [Google Scholar]
- 2.Chang CJ. Nat Chem Biol. 2015;11:744–747. doi: 10.1038/nchembio.1913. [DOI] [PubMed] [Google Scholar]
- 3.Dexter DT, Carayon A, Javoy-Agid F, Agid Y, Wells FR, Daniel SE, Lees AJ, Jenner P, Marsden CD. Brain. 1991;114:1953–1975. doi: 10.1093/brain/114.4.1953. [DOI] [PubMed] [Google Scholar]
- 4.Barnham KJ, Bush AI. Curr Opin Chem Biol. 2008;12:222–228. doi: 10.1016/j.cbpa.2008.02.019. [DOI] [PubMed] [Google Scholar]
- 5.Lhermitte J, Kraus WM, McAlpine D. J Neurol Psychopathol. 1924;5:195–208. doi: 10.1136/jnnp.s1-5.19.195. [DOI] [PMC free article] [PubMed] [Google Scholar]
- 6.Ward RJ, Zucca FA, Duyn JH, Crichton RR, Zecca L. Lancet Neurol. 2014;13:1045–1060. doi: 10.1016/S1474-4422(14)70117-6. [DOI] [PMC free article] [PubMed] [Google Scholar]
- 7.Wang JY, Zhuang QQ, Zhu LB, Zhu H, Li T, Li R, Chen SF, Huang CP, Zhang X, Zhu JH. Sci Rep. 2016;6:36669. doi: 10.1038/srep36669. [DOI] [PMC free article] [PubMed] [Google Scholar]
- 8.Davies KM, Bohic S, Carmona A, Ortega R, Cottam V, Hare DJ, Finberg JPM, Reyes S, Halliday GM, Mercer JFB, Double KL. Neurobiol Aging. 2014;35:858–866. doi: 10.1016/j.neurobiolaging.2013.09.034. [DOI] [PubMed] [Google Scholar]
- 9.Torsdottir G, Kristinsson J, Sveinbjornsdottir S, Snaedal J, Johannesson T. Pharmacol Toxicol. 1999;85:239–243. doi: 10.1111/j.1600-0773.1999.tb02015.x. [DOI] [PubMed] [Google Scholar]
- 10.Forsleff L, Schauss AG, Bier ID, Stuart S. J Altern Complement Med. 1999;5:57–64. doi: 10.1089/acm.1999.5.57. [DOI] [PubMed] [Google Scholar]
- 11.Racette BA, Searles Nielsen S, Criswell SR, Sheppard L, Seixas N, Warden MN, Checkoway H. Neurology. 2017;88:344–351. doi: 10.1212/WNL.0000000000003533. [DOI] [PMC free article] [PubMed] [Google Scholar]
- 12.Dexter DT, Jenner P, Schapira AH, Marsden CD. Ann Neurol. 1992;32(Suppl):S94–100. doi: 10.1002/ana.410320716. [DOI] [PubMed] [Google Scholar]
- 13.Zucca FA, Segura-Aguilar J, Ferrari E, Muñoz P, Paris I, Sulzer D, Sarna T, Casella L, Zecca L. Prog Neurobiol. 2017;155:96–119. doi: 10.1016/j.pneurobio.2015.09.012. [DOI] [PMC free article] [PubMed] [Google Scholar]
- 14.Rembach A, Doecke JD, Roberts BR, Watt AD, Faux NG, Volitakis I, Pertile KK, Rumble RL, Trounson BO, Fowler CJ, Wilson W, Ellis KA, Martins RN, Rowe CC, Villemagne VL, Ames D, Masters CL, Bush AI Ar group. J Alzheimers Dis. 2013;34:171–182. doi: 10.3233/JAD-121474. [DOI] [PubMed] [Google Scholar]
- 15.Roberts RF, Wade-Martins R, Alegre-Abarrategui J. Brain. 2015;138:1642–1657. doi: 10.1093/brain/awv040. [DOI] [PMC free article] [PubMed] [Google Scholar]
- 16.Roberts BR, Lind M, Wagen AZ, Rembach A, Frugier T, Li QX, Ryan TM, McLean CA, Doecke JD, Rowe CC, Villemagne VL, Masters CL. Brain. 2017;140:1486–1498. doi: 10.1093/brain/awx057. [DOI] [PubMed] [Google Scholar]
- 17.Gunn AP, Roberts BR. In: Neuromethods - Metals in the Brain: Measurement and Imaging. White AR, editor. Vol. 124. Springer; New York: 2017. pp. 119–125. [Google Scholar]
- 18.Roberts BR, Doecke JD, Rembach A, Yévenes LF, Fowler CJ, McLean CA, Lind M, Volitakis I, Masters CL, Bush AI, Hare DJ. Acta Neuropathol Commun. 2016;4:119. doi: 10.1186/s40478-016-0390-8. [DOI] [PMC free article] [PubMed] [Google Scholar]
- 19.Comas-Cufí M, Thió-Henestrosa S. Sant Feliu de Guíxols. Spain: 2011. [Google Scholar]
- 20.Ripp J. Analytical Detection Limit Guidance & Laboratory Guide for Determining Method Detection Limits. Wisconsin Department of Natural Resources, Laboratory Certification Program; 1996. [Google Scholar]
- 21.Motulsky HJ, Brown RE. BMC Bioinformatics. 2006;7:1–20. doi: 10.1186/1471-2105-7-123. [DOI] [PMC free article] [PubMed] [Google Scholar]
- 22.van den Berg RA, Hoefsloot HC, Westerhuis JA, Smilde AK, van der Werf MJ. BMC Genomics. 2006;7:142. doi: 10.1186/1471-2164-7-142. [DOI] [PMC free article] [PubMed] [Google Scholar]
- 23.Braak H, Tredici K, Rüb U, de Vos R, Steur E, Braak E. Neurobiol Aging. 2003;24:197–211. doi: 10.1016/s0197-4580(02)00065-9. [DOI] [PubMed] [Google Scholar]
- 24.Surmeier DJ, Obeso JA, Halliday GM. Nat Rev Neurosci. 2017;18:101–113. doi: 10.1038/nrn.2016.178. [DOI] [PMC free article] [PubMed] [Google Scholar]
- 25.Watanabe H, Senda J, Kato S, Ito M, Atsuta N, Hara K, Tsuboi T, Katsuno M, Nakamura T, Hirayama M, Adachi H, Naganawa S, Sobue G. Mov Disord. 2013;28:1732–1736. doi: 10.1002/mds.25641. [DOI] [PubMed] [Google Scholar]
- 26.Gratwicke J, Jahanshahi M, Foltynie T. Brain. 2015;138:1454–1476. doi: 10.1093/brain/awv104. [DOI] [PMC free article] [PubMed] [Google Scholar]
- 27.Davies KM, Hare DJ, Cottam V, Chen N, Hilgers L, Halliday G, Mercer JFB, Double KL. Metallomics. 2013;5:43–51. doi: 10.1039/c2mt20151h. [DOI] [PubMed] [Google Scholar]
- 28.Zecca L, Stroppolo A, Gatti A, Tampellini D, Toscani M, Gallorini M, Giaveri G, Arosio P, Santambrogio P, Fariello RG, Karatekin E, Kleinman MH, Turro N, Hornykiewicz O, Zucca FA. Proc Natl Acad Sci U S A. 2004;101:9843–9848. doi: 10.1073/pnas.0403495101. [DOI] [PMC free article] [PubMed] [Google Scholar]
- 29.Zecca L, Gallorini M, Schünemann V, Trautwein AX, Gerlach M, Riederer P, Vezzoni P, Tampellini D. J Neurochem. 2001;76:1766–1773. doi: 10.1046/j.1471-4159.2001.00186.x. [DOI] [PubMed] [Google Scholar]
- 30.Ayton S, Lei P, Duce JA, Wong BX, Sedjahtera A, Adlard PA, Bush AI, Finkelstein DI. Ann Neurol. 2013;73:554–559. doi: 10.1002/ana.23817. [DOI] [PubMed] [Google Scholar]
- 31.Dexter DT, Wells FR, Lee AJ, Agid F, Agid Y, Jenner P, Marsden CD. J Neurochem. 1989;52:1830–1836. doi: 10.1111/j.1471-4159.1989.tb07264.x. [DOI] [PubMed] [Google Scholar]
- 32.Liddell JR, White AR. Neurochem Int. 2017 doi: 10.1016/j.neuint.2017.05.016. [DOI] [PubMed] [Google Scholar]
- 33.Licker V, Turck N, Kovari E, Burkhardt K, Cote M, Surini-Demiri M, Lobrinus JA, Sanchez JC, Burkhard PR. Proteomics. 2014;14:784–794. doi: 10.1002/pmic.201300342. [DOI] [PubMed] [Google Scholar]
- 34.Trist BG, Davies KM, Cottam V, Genoud S, Ortega R, Roudeau S, Carmona A, De Silva K, Wasinger V, Lewis SJG, Sachdev P, Smith B, Troakes C, Vance C, Shaw C, Al-Sarraj S, Ball HJ, Halliday GM, Hare DJ, Double KL. Acta Neuropathol. 2017;134:113–127. doi: 10.1007/s00401-017-1726-6. [DOI] [PubMed] [Google Scholar]
- 35.Double KL, Dedov VN, Fedorow H, Kettle E, Halliday GM, Garner B, Brunk UT. Cell Mol Life Sci. 2008;65:1669–1682. doi: 10.1007/s00018-008-7581-9. [DOI] [PMC free article] [PubMed] [Google Scholar]
- 36.Bohic S, Murphy K, Paulus W, Cloetens P, Salome M, Susini J, Double K. Anal Chem. 2008;80:9557–9566. doi: 10.1021/ac801817k. [DOI] [PubMed] [Google Scholar]
- 37.Halliday GM, Ophof A, Broe M, Jensen PH, Kettle E, Fedorow H, Cartwright MI, Griffiths FM, Shepherd CE, Double KL. Brain. 2005;128:2654–2664. doi: 10.1093/brain/awh584. [DOI] [PubMed] [Google Scholar]
- 38.Uversky VN. J Neurochem. 2007;103:17–37. doi: 10.1111/j.1471-4159.2007.04764.x. [DOI] [PubMed] [Google Scholar]
- 39.Bourassa MW, Brown HH, Borchelt DR, Vogt S, Miller LM. Front Aging Neurosci. 2014;6:110. doi: 10.3389/fnagi.2014.00110. [DOI] [PMC free article] [PubMed] [Google Scholar]
- 40.Barnham KJ, Bush AI. Chem Soc Rev. 2014;43:6727–6749. doi: 10.1039/c4cs00138a. [DOI] [PubMed] [Google Scholar]
- 41.Chinta SJ, Andersen JK. Biochim Biophys Acta, Gen Subj. 2008;1780:1362–1367. doi: 10.1016/j.bbagen.2008.02.005. [DOI] [PMC free article] [PubMed] [Google Scholar]
- 42.Deas E, Cremades N, Angelova PR, Ludtmann M, Yao Z, Chen S, Horrocks MH, Banushi B, Little D, Devine MJ, Gissen P, Klenerman D, Dobson CM, Wood NW, Gandhi S, Abramov AY. Antiox Redox Signal. 2016;24:376–391. doi: 10.1089/ars.2015.6343. [DOI] [PMC free article] [PubMed] [Google Scholar]
- 43.Hare DJ, Double KL. Brain. 2016;139:1026–1035. doi: 10.1093/brain/aww022. [DOI] [PubMed] [Google Scholar]
- 44.Terada T, Yokokura M, Yoshikawa E, Futatsubashi M, Kono S, Konishi T, Miyajima H, Hashizume T, Ouchi Y. Ann Nucl Med. 2016;30:579–587. doi: 10.1007/s12149-016-1099-2. [DOI] [PubMed] [Google Scholar]
- 45.New EJ. Dalton Trans. 2013;42:3210–3219. doi: 10.1039/c2dt31933k. [DOI] [PubMed] [Google Scholar]
- 46.MacKenzie EL, Iwasaki K, Tsuji Y. Antioxid Redox Signal. 2008;10:997–1030. doi: 10.1089/ars.2007.1893. [DOI] [PMC free article] [PubMed] [Google Scholar]
- 47.James SA, Volitakis I, Adlard PA, Duce JA, Masters CL, Cherny RA, Bush AI. Free Radic Biol Med. 2012;52:298–302. doi: 10.1016/j.freeradbiomed.2011.10.446. [DOI] [PubMed] [Google Scholar]
- 48.Barnham KJ, Masters CL, Bush AI. Nat Rev Drug Discovery. 2004;3:205–214. doi: 10.1038/nrd1330. [DOI] [PubMed] [Google Scholar]
- 49.Guiney SJ, Adlard PA, Bush AI, Finkelstein DI, Ayton S. Neurochem Int. 2017;104:34–48. doi: 10.1016/j.neuint.2017.01.004. [DOI] [PubMed] [Google Scholar]
- 50.Hare DJ, Lei P, Ayton S, Roberts BR, Grimm R, George JL, Bishop DP, Beavis AD, Donovan SJ, McColl G, Volitakis I, Masters CL, Adlard PA, Cherny RA, Bush AI, Finkelstein DI, Doble PA. Chem Sci. 2014;5:2160–2169. [Google Scholar]
- 51.Hare DJ, Cardoso B, Raven EP, Double KL, Finkelstein DI, Szymlek-Gay EA, Biggs BA. npj Parkinsons Dis. 2017;3:1. doi: 10.1038/s41531-016-0004-y. [DOI] [PMC free article] [PubMed] [Google Scholar]
- 52.Hare DJ, Arora M, Jenkins NL, Finkelstein DI, Doble PA, Bush AI. Nat Rev Neurol. 2015;11:536–544. doi: 10.1038/nrneurol.2015.100. [DOI] [PubMed] [Google Scholar]
- 53.Niranjan R. Mol Neurobiol. 2014;49:28–38. doi: 10.1007/s12035-013-8483-x. [DOI] [PubMed] [Google Scholar]
- 54.Collins LM, Toulouse A, Connor TJ, Nolan YM. Neuropharmacol. 2012;62:2154–2168. doi: 10.1016/j.neuropharm.2012.01.028. [DOI] [PubMed] [Google Scholar]
- 55.Devos D, Moreau C, Devedjian JC, Kluza J, Petrault M, Laloux C, Jonneaux A, Ryckewaert G, Garçon G, Rouaix N, Duhamel A, Jissendi P, Dujardin K, Auger F, Ravasi L, Hopes L, Grolez G, Firdaus W, Sablonnière B, Strubi-Vuillaume I, Zahr N, Destée A, Corvol JC, Pöltl D, Leist M, Rose C, Defebvre L, Marchetti P, Cabantchik ZI, Bordet R. Antiox Redox Signal. 2014;21:195–210. doi: 10.1089/ars.2013.5593. [DOI] [PMC free article] [PubMed] [Google Scholar]
- 56.Hare D, Ayton S, Bush A, Lei P. Front Aging Neurosci. 2013:5. doi: 10.3389/fnagi.2013.00034. [DOI] [PMC free article] [PubMed] [Google Scholar]
- 57.Moos T, Nielsen TR, Skjorringe T, Morgan EH. J Neurochem. 2007;103:1730–1740. doi: 10.1111/j.1471-4159.2007.04976.x. [DOI] [PubMed] [Google Scholar]
- 58.Grolez G, Moreau C, Sablonniere B, Garcon G, Devedjian JC, Meguig S, Gele P, Delmaire C, Bordet R, Defebvre L, Cabantchik IZ, Devos D. BMC Neurol. 2015;15:74. doi: 10.1186/s12883-015-0331-3. [DOI] [PMC free article] [PubMed] [Google Scholar]
- 59.Davies KM, Mercer JFB, Chen N, Double KL. Clin Sci. 2016;130:565–574. doi: 10.1042/CS20150153. [DOI] [PubMed] [Google Scholar]
- 60.Hung LW, Villemagne VL, Cheng L, Sherratt NA, Ayton S, White AR, Crouch PJ, Lim S, Leong S, Wilkins S, George J, Roberts BR, Pham C, Liu X, Chiu F, Shackleford DM, Powell AK, Masters CL, Bush AI, O’Keefe G, Culvenor JG, Cappai R, Cherny RA, Donnelly PS, Hill AF, Finkelstein DI, Barnham KJ. J Exp Med. 2012;209:837–854. doi: 10.1084/jem.20112285. [DOI] [PMC free article] [PubMed] [Google Scholar]
- 61.Dickson DW, Fujishiro H, DelleDonne A, Menke J, Ahmed Z, Klos KJ, Josephs KA, Frigerio R, Burnett M, Parisi JE, Ahlskog JE. Acta Neuropathol. 2008;115:437–444. doi: 10.1007/s00401-008-0345-7. [DOI] [PubMed] [Google Scholar]
Associated Data
This section collects any data citations, data availability statements, or supplementary materials included in this article.