

Abstract
Protein folding process involves formation of transiently occurring intermediates that are difficult to isolate and characterize. It is both necessary and interesting to characterize the structural conformations adopted by these intermediates, also called molten globules (MG), to understand protein folding. Here, we investigated the equilibrium (un)folding intermediate state of T4 phage gene product 45 (gp45, also known as DNA polymerase processivity factor or sliding clamp) obtained during chemical denaturation. We show that gp45 undergoes substantial conformational rearrangement during unfolding and forms an expanded dry-MG. By monitoring the fluorescence of tryptophans that were strategically introduced at various sites, we demonstrate that the urea-treated molecule has its surface residues flip inside the core, and closely placed residues move farther. We were also able to isolate and purify the MG form of gp45 in native condition (i.e., nondenaturing buffer, at physiological pH and temperature); characteristics of this purified molecule substantially match with urea-treated wild-type gp45. To the best of our knowledge, this is one of the few reports that demonstrate the isolation and purification of a protein folding intermediate in native condition. We believe that our work not only allows us to dissect the process of protein folding, but will also help in the designing of folding inhibitors against sliding clamps to treat a wide variety of diseases from bacterial infection to cancer, due to the vast presence of clamps in all the domains of life.
Introduction
The primary sequence of protein, due to the rotations about all the single bonds present in it, can adopt a gigantic number of conformations immediately after its synthesis. Yet, the molecule achieves only a single native state. It, therefore, becomes very interesting to explore what governs protein folding. Many folding pathways have been uncovered in the recent past, which are unlike the conventional two-state folding models (1, 2). Proteins, during folding, adopt single or multiple intermediate states, characterized by either loss or gain of compact packing, which are generally referred to as molten globule (MG) states (3, 4, 5, 6, 7, 8). A significant amount of interest in understanding the structure and properties of these states is now noticed in the literature and crucial questions regarding protein folding have been addressed (4, 9, 10, 11, 12). These states are suggested to be the key step during protein folding (13). An understanding of the MGs will, therefore, help in addressing the protein folding problem. Reports are available that present a detailed examination of the folding intermediate of a protein under physiological buffer conditions (14, 15). Besides being the folding intermediates, MGs are also known to hold functional significance and are known to carry out biological functions (16, 17, 18, 19, 20, 21). Some notable examples include the functional role in protein-ligand interaction (22), recognition of chaperones (23), cellular toxins (24), enzymatic roles (25), translocation across membrane (26) and genetic disease (27). This suggests that MG may not only be a folding intermediate of protein, but also a state adopted by the protein to perform a specific function inside cell (21).
MG is generally identified as a compact state of the protein in which side-chain interactions are lost whereas the secondary structures are retained (3, 6, 7, 28). MGs have been discovered as both equilibrium and kinetic intermediates during the unfolding/folding of many proteins, i.e., bovine carbonic anhydrase (29), α-lactalbumin (7), cytochrome c (6), ribonuclease A (30), monellin (9), apo-myoglobin (31), etc. These states are either wet molten globules (WMGs) with a hydrated core or dry molten globules (DMGs) with a dehydrated cavity. Various thermodynamic as well as biochemical studies characterize DMG as a state where the protein’s native side-chain interactions are lost and the core swells without significant alteration in the backbone secondary structure (9, 32, 33). However, water molecules are absent in the core. DMG slowly allows entry of water molecules and is eventually rendered solvated during unfolding (34, 35). Thus, DMGs are near-native structures with an expanded conformation that has a dry hydrophobic interior. In contrast, WMGs contain a water-hydrated hydrophobic core (6, 10, 11, 36, 37). Recently, a single substitution L93A in the phosphofructokinase-2 of Escherichia coli yielded a monomeric molecule with a solvent-penetrated hydrophobic core (38).
DMGs are mainly seen as kinetic intermediates that appear transiently during the initial phase of protein unfolding (9, 25, 32, 39, 40, 41, 42). However, a few other findings suggest that DMGs are equilibrium intermediates (43, 44). In some studied cases, DMG is confined to a single or a few domains of a multidomain protein (33, 45). Protein unfolding induced by either pH or urea has resulted in the capturing of DMG (33, 46, 47). Urea destabilizes the protein by displacing water molecules and forming H-bonds with the protein that causes protein swelling, resulting in dry molten-globule formation (47). Molecular dynamics simulation studies suggest that during DMG formation, urea penetrates protein’s core and interacts with peptide backbone, whereas water molecules do not invade, thus leaving the core dry (41, 48). As the denaturant concentration increases, urea and water molecules start entering the hydrophobic protein core, thus making the cavity solvated; this finally causes disruption of the H-bonding that holds the secondary structures, leading to complete protein unfolding (49, 50).
We report here the existence of a stable equilibrium folding intermediate in the T4 bacteriophage gp45 sliding clamp that shows characteristics of DMG. gp45 forms a homotrimer with each subunit having two domains, i.e., N-terminal domain (NTD) and C-terminal domain (CTD) (51). gp45 unfolds after a three-state transition with unfolding of NTD preceding CTD (52). We have previously shown that gp45 CTD undergoes MG-like intermediate formation during unfolding and refolding; here, CTD alone adopts MG conformation, whereas the NTD remains unfolded (52). In this article, we show that there occurs a huge conformational rearrangement in the gp45 CTD when it forms MG. Our data suggest that the domain swells and forms DMG wherein the surface residues flip inside the domain’s hydrophobic core, causing burying of residues in a solvent-excluded environment. Furthermore, we were able to successfully isolate the gp45 DMG in the native condition (i.e., nondenaturing buffer, at physiological pH and temperature). The molten globule forms of proteins have so far been studied under nonnative conditions such as low pH, high salt concentrations, elevated temperatures, and in the presence of chemical denaturants, etc. We believe that our study happens to be one of the few reports where a protein’s folding intermediate has been studied in native condition. Obtaining a protein in its MG form in native condition will find tremendous use in understanding how protein folds.
Materials and Methods
Material
All the reagents used in the study are of highest quality and were bought from Sigma-Aldrich (St. Louis, MO), unless specified otherwise. Oligonucleotides were purchased from Macrogen (Seoul, South Korea). E. coli strain XL1-blue (Stratagene, San Diego, CA) was used for all cloning and mutagenesis experiments, whereas BL21(DE3) (Lucigen, Middleton, WI) was used for protein expression and purification as described elsewhere (53).
Site-directed mutagenesis, cloning, and protein purification
The cloning of various genes, protein expression and purification, and site-directed mutagenesis were carried out as described previously (52), and are detailed in Supporting Material. Proteins were dialyzed against gp45 buffer (50 mM sodium phosphate pH 7.4, 50 mM NaCl, 1 mM EDTA, and 5% glycerol). Protein samples were extensively centrifuged before performing any experiment.
Urea-induced chemical denaturation
Unfolding studies in the presence of urea were performed as described previously (52, 54); details are provided in Supporting Material. Eight micromoles of protein in specified urea concentrations were subjected to far-UV circular dichroism (CD), fluorescence emission, and anisotropy measurements and the recorded data were analyzed as detailed in Supporting Material. These samples were also run on blue native polyacrylamide gel electrophoresis (BN-PAGE) that was performed exactly as described previously (52, 54).
Förster resonance energy transfer
gp45 does not have any natural cysteine. Therefore, SDM was performed in the C-terminal domain of gp45W199 mutant (gp45 protein carrying W92F substitution) to replace various residues with cysteine. The procedure to label Cys and the method to estimate the labeled protein is detailed in Supporting Material. The Förster resonance energy transfer (FRET) experiments are detailed in Supporting Material. Briefly, 5-({2-[(iodoacetyl)amino]ethyl}amino)naphthalene-1-sulfonic acid (IAEDANS)-labeled proteins were mixed with freshly prepared and deionized urea while maintaining the final protein concentration at 0.2 mg/mL (∼8 μM). FRET analysis was carried out by exciting W199 at 295 nm and monitoring the emission from 310 to 550 nm. The intensity at 492 nm was used as emission maxima of IAEDANS.
HSQC nuclear magnetic resonance experiments
Preparation of samples for nuclear magnetic resonance (NMR) is detailed in the Supporting Material. 1H–15N TROSY-HSQC spectra were acquired on a 700 MHz FT-NMR instrument (AVANCE III, Bruker, Billerica, MA) using a cryoprobe. The data were processed using the software NMRPipe (https://spin.niddk.nih.gov/bax/software/NMRPipe/) and plotted using the software SPARKY (55).
8-Anilinonaphthalene-1-sulfonic acid binding
Samples for 8-anilinonaphthalene-1-sulfonic acid (ANS) binding were prepared exactly as for unfolding studies. Two-hundred microliters of protein sample (in different urea concentration) were mixed with 2 μL of 5 mM ANS dye making the final concentration of 50 μM. Samples were then incubated for 30 min before recording. The fluorescence was recorded on SpectraMax (Molecular Devices, Sunnyvale, CA) using an excitation wavelength of 380 nm. Emission spectra were recorded from 450 to 570 nm with a cutoff of 455 nm. The intensity at 470 nm was used for plotting.
Formaldehyde-mediated protein cross-linking
Formaldehyde-mediated cross-linking of the proteins was performed as described previously (54), and is detailed in Supporting Material. Densitometric analysis was performed using the software ImageJ (National Institutes of Health, Bethesda, MD) (56). The cross-linked fraction was calculated as the ratio of intensities of cross-linked species (sum of dimeric and trimeric species) with the sum of intensities of all species.
Trp fluorescence lifetime and rotational correlation time measurements
Protein samples were prepared with varying urea concentrations, similar to as prepared for unfolding studies. Lifetime (τ) data were recorded taking λex = 295 nm and λmax emission of each mutant using time-correlated single photon counting (Horiba Jobin-Yvon, Les Ulis, France). The measured amplitude of decay time was fit to two exponentials to obtain the average lifetime (τ) for each sample. The correlation time (τc) was derived using the equation
where the fundamental anisotropy, r0, is taken to be 0.3; and r represents the fluorescence anisotropy.
Acrylamide-mediated fluorescence quenching
Fluorescence quenching by acrylamide was carried out as described previously (52) and is detailed in the Supporting Material. The λmax emission at each urea concentration was used to prepare a Stern-Volmer plot, after correcting the samples for inner filter effect. The slope of the Stern-Volmer constant, KSV, was then used to calculate the bimolecular quenching constant as described in the Supporting Material.
Red-edge excitation shift
Protein preparation for red-edge excitation shift (REES) studies was carried out as described earlier for other studies. Samples with different urea concentrations were subjected to 3D scan on a FluoroMax 4C spectrofluorometer (Horiba Jobin-Yvon) wherein excitation and emission wavelengths ranged 280–307.5 nm (data pitch = 2.5 nm) and 325–380 nm (data pitch = 0.5 nm), respectively. Average wavelength was calculated for each sample as described above, and plotted.
On-column refolding
IAEDANS-labeled gp45 mutant (harboring W92F and T137C substitutions) in 8 M urea was directly desalted on a Sephadex G-25 column (Sigma-Aldrich) at 4°C using gp45 buffer with no denaturant present. The protein was quantified and further experiments were conducted as described above for other mutants.
Results and Discussion
gp45 sliding clamp (un)folding transits through molten globule intermediate
gp45 trimer unfolds following a three-state transition. We have previously shown that whereas the first transition is a result of trimer to monomer dissociation and NTD unfolding at ∼2.5 M urea, CTD adopts an MG-like conformation before finally unfolding during a second transition (52).
To establish that the intermediate state is indeed MG, we probed Trp fluorescence in the single Trp mutants of gp45-gp45W92 (where W199, located in the C-terminal domain and present at the surface, was replaced with Phe (52)) and gp45W199 (where W92, present in the N-terminal domain and remaining buried, was replaced with Phe (52)). Trp in gp45W92 shows a blue-shifted low-intensity fluorescence emission spectrum (Fig. S1 A) with lower fluorescence lifetime values (Fig. 1 A), suggesting that W92 is in close proximity of a polar residue that acts as a fluorescence quencher; however, because the W92 is buried at the subunit interface, its rotational correlation time (τc) is higher (Fig. 1 B). Both lifetime and rotational correlation times decrease when the NTD (bearing W92) unfolds in the presence of urea (Fig. 1, A and B). On the other hand, W199 in gp45W199, although exposed, shows a high-intensity emission spectrum (Fig. S1 A) along with a high-fluorescence lifetime and rotational correlation time values (Fig. 1, A and B), suggesting that Trp is conformationally restricted. Interestingly, upon addition of urea, although Trp fluorescence lifetime and rotational correlation time values decrease (Fig. 1, A and B), the fluorescence emission initially shows a distinct blue shift at intermediate urea concentrations (Fig. S1 B), suggesting that Trp shifts to a hydrophobic environment and remains conformationally flexible; further addition of urea results in a red-shifted emission (Fig. S1 B). We have previously shown that these concentrations of urea do not result in a significant change in the secondary structure of CTD (as judged by our CD and fluorescence anisotropy data (52)). It thus appears that the addition of ∼2.5 M urea to gp45W199 results in a change in W199 environment without affecting the secondary structure of the domain (CTD). gp45WT shows an average of two tryptophans with a three-state profile (Fig. S1, A and B).
Figure 1.

W199 indicates the presence of a molten globule intermediate. (A) Average lifetime (τavg) of W92 and W199 present in gp45W92 and gp45W199, respectively, in varying urea concentrations is plotted. Each data point represents an average of at least two independent experiments with error bars as SD. (B) Graph depicts the rotational correlation time (τc) calculated for gp45W92 and gp45W199 using the equation described in Materials and Methods. Both W92 and W199 show restricted conformation in 0 M urea. Upon unfolding in presence of urea, W92 experiences conformational flexibility as observed by a decrease in τc. W199, although exposed on CTD surface, remains rigid in 0 M urea, and shows flexibility upon MG formation (at 3.5 M urea). In 8 M urea, both tryptophans show very low τc. (C) REES is plotted at each urea concentration for W92 and W199 present in gp45W92 (circle) and gp45W199 (triangle), respectively. Shaded region marks the zone of urea concentration in which gp45WT forms MG. Beginning and end of the shaded region refers here to the first and the second transitions of gp45WT unfolding, respectively. REES increases on the onset of MG formation and decreases slightly after the protein has completely unfolded. Although CTD (represented by W199 in gp45W199) unfolds at ∼5.5 M urea, the increase in REES at first transition indicates the role of CTD in MG formation. The data represent an average of at least three independent experiments. For representative raw data, see Fig. S2. (D) The 1H-15N HSQC overlaid profiles of gp45WT are plotted at different urea concentrations to monitor the change in Trp indole resonances (enlarged in inset). The data were recorded at 0 M (black), 2 M (red), 2.5 M (blue), 3 M (green), 4 M (orange), 6 M (cyan), and 8 M (purple) and were compared with HSQC profiles of gp45W92 and gp45W199 at different urea concentrations (data not shown) to confirm the chemical shift in indole resonances. For gp45W92 and gp45W199 HSQC profiles, see Fig. S3. (E) Indole resonances are plotted against the urea concentrations to map the movement of each Trp. W199 loses its resonance in MG form. To see this figure in color, go online.
To investigate the environment that Trp experiences, we performed REES experiments. REES is characterized by a shift in emission wavelength (λem) of a fluorophore upon shifting of the excitation wavelength (λex) toward the red edge of the spectrum (57). It occurs when there is a difference in the environment of the fluorophore with respect to the solvent viscosity (33, 57). REES experiments are carried out to demarcate different conformations of a protein, i.e., the native (N), molten globule (MG), and unfolded (U) states. As expected, the W92 in gp45W92 shows an increase in REES upon urea addition, demonstrating clearly that W92 experiences a change in solvent environment during NTD unfolding (Figs. 1 C and S2 A); this occurs even at low urea concentrations. On the other hand, W199 in gp45W199 shows negligible REES at 0 M urea that does not change until ∼2 M (Fig. 1 C and S2 B). Further addition of urea to 3.5 M results in a significant change in REES values (Fig. 1 C). These urea concentrations have been shown to cause burying of W199 (52). REES data thus suggest that W199, upon urea addition, shifts to an environment having restricted solvent movement. It must be noted here that the CTD region of the protein remains folded at these urea concentrations and unfolds only in higher urea amounts (∼5.5 M). Taken together, we conclude that gp45 CTD forms MG during unfolding at intermediate urea concentrations (∼2.5–5.5 M). Furthermore, CTD remains as an MG until the urea concentration is increased beyond 5.5 M, at which the protein unfolds completely.
The local environment of each Trp in its respective domain was also monitored by following the indole chemical shifts in gp45 with increasing urea concentrations. Overlaying of 1H-15N HSQC spectra for gp45WT and its single Trp mutants (gp45W92 and gp45W199) confirmed that no significant conformational change occurred because of mutations (Fig. S3). gp45WT was subjected to varying urea concentrations, and the chemical shifts in indole resonances were monitored (Fig. 1 D). Downfield-shifted W92 (present in a polar environment) at 0 M urea shows reduced resonance intensity because of a rigid conformation. Upon addition of urea, W92 shows an upfield chemical shift (∼0.5 ppm) beyond 2.5 M, during NTD unfolding (Fig. 1 E). This shift occurs because of infrequent interactions of indole –NH proton with water and urea molecules, thereby making the indole surrounding relatively less polar. On the other hand, the upfield-shifted W199 resonance in 0 M urea shows high intensity because of relatively more conformational flexibility than W92 (Fig. 1 E). Interestingly, W199 resonance disappears in 2.5 M urea (Fig. 1 E), indicating that W199 in the MG state of gp45 is present in a nonnative environment inside the CTD core. The restricted movement of W199 results in broad resonance, which is difficult to capture on an NMR timescale. It thus suggests that the two tryptophans experience different environments when the protein is denatured, and corroborate well with the REES data.
Taken together, our data confirm that the (un)folding of gp45 involves an MG intermediate, which is primarily formed by the C-terminal domain of the protein.
The C-terminal domain of gp45 forms a dry molten globule during unfolding
Our Trp fluorescence, REES experiments, and NMR data together prove that the C-terminal domain of gp45 forms an MG during (un)folding. We next inquired if the CTD forms a wet or a dry MG. A fluorescent molecular probe such as ANS is frequently used to examine the MG state (58). The dye fluoresces upon binding to hydrophobic clusters that are exposed during unfolding of protein, and, therefore, it is routinely used to characterize MGs that appear as unfolding/folding intermediates. Specifically, the dye can be used to characterize the WMG state of the protein. WMG shows dye binding as the water molecule can deliver the dye to the exposed hydrophobic patches, whereas DMGs are generally swollen and have a water-deprived dry core that does not show binding of fluorescent dye.
The gp45WT trimer shows ANS binding, which increases until ∼3.0 M urea (Fig. 2); these urea concentrations corroborate well with the trimer opening and NTD unfolding (Fig. 2). Further addition of urea shows lowering of ANS fluorescence, which is found to be insignificant between 2.5 and 5.5 M urea (Fig. 2; section b, shaded region); at these concentrations, gp45 shows the formation of MGs. This is an immediate indication of the formation of a dry MG.
Figure 2.
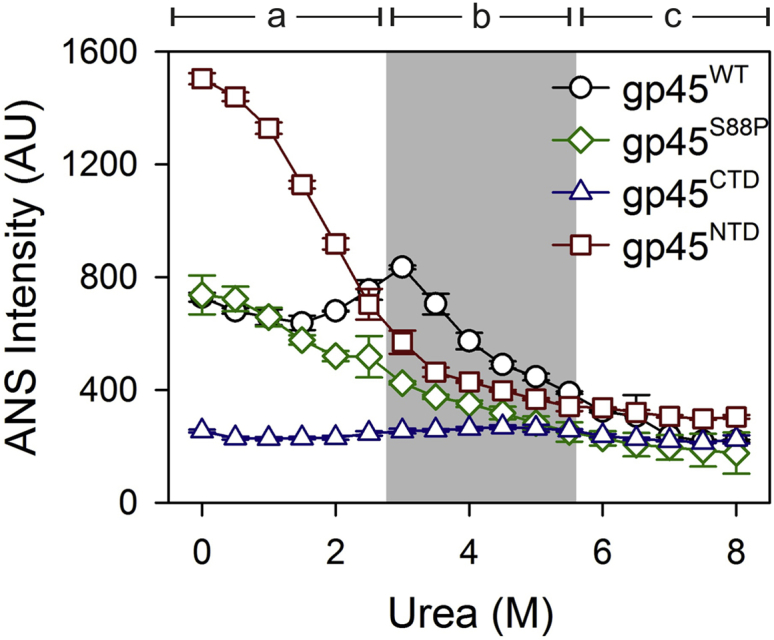
C-terminal domain of gp45 unfolds with a dry molten globule intermediate. ANS fluorescence profiles of gp45WT, gp45S88P, gp45CTD, and gp45NTD with increasing urea concentrations are plotted. The shaded region marks the zone of urea concentration in which gp45WT forms MG. The plots are divided in three sections—a, b, and c. Section a—the pre-MG state—shows high ANS fluorescence in the case of gp45NTD, no fluorescence in gp45CTD, and intermediate values for gp45WT and gp45S88P. Section b—the MG state—shows negligible ANS fluorescence from gp45CTD. The fluorescence in all other cases reduces with increasing urea concentrations, suggesting loss of ANS binding to protein. Here, the negligible ANS fluorescence at least in the case of gp45CTD suggests DMG formation that does not allow water molecules containing dye to penetrate the core. In all other proteins, ANS fluorescence, although insignificant, occurs primarily due to the NTD. Section c—post-MG—shows almost no fluorescence in all the cases, which is primarily due to complete denaturation. The data represent an average of three independent experiments with SD. To see this figure in color, go online.
We also examined ANS binding with three other proteins—gp45S88P, which is a monomeric mutant of gp45 and has altered NTD conformation (54); gp45NTD, which has only the N-terminal domain; and gp45CTD, which retains only the C-terminal domain of the clamp (52). We have previously demonstrated that both gp45S88P and gp45CTD show MG-like states during denaturation (52, 54). gp45NTD shows high ANS fluorescence at low urea concentrations, which reduces during domain unfolding by increasing urea concentration (Fig. 2). This suggests that NTD is a loosely packed domain that allows ANS penetration to the hydrophobic core. gp45S88P shows an initial ANS fluorescence profile similar to gp45NTD, suggesting that NTD in gp45S88P binds to ANS; the dye binding further reduces as the domain noncooperatively unfolds (this corroborates well with the unfolding of NTD in gp45S88P reported elsewhere (54)). However, gp45S88P shows no enhanced ANS fluorescence during MG state formation between 2.5 and 5.5 M urea, similar to gp45WT (Fig. 2). Because gp45WT and gp45S88P each contain both NTD and CTD regions, we next analyzed binding of ANS to gp45CTD to demarcate the contribution of C-terminal domain in the observed ANS fluorescence. Interestingly, gp45CTD urea-induced unfolding samples show negligible ANS fluorescence even in the MG state (between 2.5 and 5.5 M urea), suggesting that dye cannot penetrate the molecule in its MG state (Fig. 2). We therefore conclude from these experiments that the C-terminal domain of gp45 forms a DMG while undergoing denaturation.
Trp scanning mutagenesis of CTD demonstrates a global conformational rearrangement during MG formation
We have established that the Trp environment present in the CTD changes significantly when the protein is unfolded with intermediate urea concentrations. To address whether the change in the Trp environment occurs locally or is global, we performed Trp scanning mutagenesis in the CTD and selected 52 residues that were mutated to generate 52 mutants (Fig. 3, A and B). The selection comprised both surface and core residues, as indicated by their solvent-accessible surface area (SASA; Fig. 3 B), which was calculated from the crystal structure of trimeric gp45 (PDB: 1CZD) using the software Discovery Studio (v4.0; Accelrys, San Diego, CA). Out of the 52, only 25 proteins could be successfully expressed and purified in their native form (data not shown), and were found to be well folded (Fig. S4).
Figure 3.

Trp scanning mutagenesis of gp45 surface and core residues located in the C-terminal domain. (A) Crystal structure of gp45 (PDB: 1CZD) shows the two domains of a gp45 subunit. The single subunit is enlarged and the residues that were chosen for Trp scanning mutagenesis are marked. The residues that were stably purified and used for further studies are shown as sticks. (B) Given here is a schematic representation of the gp45 CTD sequence (residues from 110 to 228) and the secondary structure (shown as arrows and cylinders). The SASA values for all residues are presented on a scale of zero (least accessible) to one (most accessible). Residues selected for Trp scanning mutagenesis are shown in red. The 25 residues, which upon mutation to Trp were successfully purified and analyzed, are marked with a dot. To see this figure in color, go online.
Most of the mutants demonstrated lesser trimer formation than the wild-type, as judged by their formaldehyde-mediated cross-linking efficiency (Fig. S5). Nevertheless, these proteins were considered significant to study MG formation, because our previously reported gp45 monomeric mutant—gp45S88P—also does not trimerize and still shows characteristics of MG during denaturation by urea (52). All the proteins demonstrate a three-state unfolding CD profile similar to gp45WT (Fig. S6 A and S7). However, the urea concentrations at which the first and second transitions occur (Cm1 and Cm2, respectively) vary significantly among the mutants (Table S1). The BN-PAGE profile of all the mutants at different urea concentrations, i.e., 0, 3.5, and 8.0 M, is found to be similar to gp45WT; the expanded conformation of the protein generated in 3.5 M urea shows a retarded mobility (Fig. S6 B). Taken together, our experiments demonstrate that Trp mutants have properties similar to the gp45WT. In other words, these mutants also form MG at intermediate urea concentrations.
We have previously shown that W199 located on the surface of CTD buries during MG formation and becomes inaccessible to acrylamide-mediated fluorescence quenching (52). Therefore, to examine the global conformational change that occurs in the C-terminal domain during the formation of molten globule, we performed acrylamide-mediated quenching of Trp fluorescence and measured the bimolecular quenching constant (kq) for the Trp mutants at three different urea concentrations—0, 3.5, and 8 M—that represent native, MG, and denatured states, respectively (Fig. 4). We compared the SASA and the kq values at 0 M urea for these residues to differentiate between the surface and the buried residues and noticed that in most of the mutants, the SASA and the kq values agree with each other; in only a few cases, the two values are not in agreement, which is most likely due to the replacement of an amino acid with a bulky side chain harboring Trp. Nevertheless, our data show that Trp in most of the mutants is found to be solvent accessible in 0 M urea (high kq value), and buries (low kq value) when urea concentration is increased to 3.5 M. It is conceivable, therefore, that the amino acids at these positions in the protein undergo a remarkable conformational rearrangement, where the residues bury within the core of the molecule during MG formation. Finally, at 8 M urea, the kq value increases again, suggesting the exposure of Trp to solvent (Fig. 4).
Figure 4.

gp45 surface residues bury themselves in CTD core during DMG formation. Bimolecular quenching constants for the Trp fluorescence in gp45WT (W92 and W199; top) and Trp mutants (both top and bottom) in their fully folded (0 M urea), MG (3.5 M urea), and fully unfolded (8 M urea) states are depicted. Most of the surface residues show reduced kq values in 3.5 M urea because of burying of the side chain in the protein’s core in the MG state. The residues are finally exposed upon unfolding in 8 M urea. The data presented here are an average of three independent experiments with error bars representing the SD. To see this figure in color, go online.
It did not escape our notice that Trp in E144W stays buried even at 8 M urea, and we presently do not have any explanation to support this observation. We further wish to add that for some residues such as A114, L127, S166, and F178, where the SASA and the kq values do not agree fully with each other (SASA values suggest that these residues are buried, whereas kq indicates that the residues are exposed), the data need to be considered with some reservation. Nevertheless, we are able to conclude from these experiments that barring a few such as A114, L123, Q134, S166, Y216, and L220, all the residues show a prominent decrease in kq value when the protein is treated with 3.5 M urea, which strongly indicates burial of the residues at this urea concentration. Our data thus demonstrate that most of the residues probed here bury into the CTD core during MG formation and experience a similar environment with an average kq value of 1.33 ± 0.54 × 10⁹ M−1 s−1.
Acrylamide-mediated fluorescence quenching data is further supported by the shift in the Trp fluorescence emission wavelength. The fluorescence emission λmax of Trp is red shifted when it goes into a more aqueous environment, whereas it is blue-shifted in a hydrophobic environment. Noticeably, residues that bury during MG formation and hence show resistance to acrylamide-mediated fluorescence quenching also demonstrate a blue-shifted Trp fluorescence (Figs. S8 A and S9). Trp fluorescence anisotropy values also increase upon MG formation, most likely due to the restricted geometry of the fluorophore inside the core (Figs. S8 B and S10). Taken together, these experiments strongly support the flipping-in of the gp45 C-terminal domain surface residues into the MG core. Conceivably, due to the repulsion among the buried residues, an expanded molten globule is formed.
The distant residues come in close proximity inside the domain’s core during MG formation
Because many surface residues bury into the core of MG at intermediate urea concentrations, it is conceivable that the distantly located residues on the CTD surface may come in close proximity in MG. Similarly, closely located residues may move away from each other during domain swelling. To validate this, we carried out a FRET experiment. FRET experiments have routinely been performed to monitor structural changes occurring during folding/unfolding of protein (39, 59, 60, 61, 62). We mutated S19 in NTD, and R131, E144, G192, and A206 in CTD of gp45W199 (harboring W92F mutation) to Cys (Fig. 5 A). The Cys-containing proteins thus generated were labeled with IAEDANS (labeled proteins are denoted with an asterisk as a suffix) and FRET experiments were carried out with these proteins using W199 as a fluorescence donor and IAEDANS as an acceptor, with increasing urea concentrations. Proteins R131C∗, E144C∗, and G192C∗ demonstrate a significant increase in FRET in the MG state, i.e., between 2.5 and 5.5 M urea (Fig. 5 B). S19 is located in NTD and because NTD does not form MG, as expected, we notice no significant change in FRET, making this our negative control. In A206C∗, where residue A206 lies in close proximity to the W199, significantly reduced FRET is observed (Fig. 5 B), suggesting that C206 shifts farther from W199, which is possibly the consequence of domain expansion. Thus, our data confirm that the N → MG transition in CTD involves dramatic changes in the domain, wherein surface residues come relatively closer.
Figure 5.

The surface residues come in close proximity during DMG formation. (A) Crystal structure of gp45 subunit shows the arrangement of residues that were mutated to Cys and labeled with an acceptor IAEDANS to perform FRET analysis with the donor W199. All the residues are located in the CTD except S19, which lies in the NTD. (B) Normalized FRET data for the different residues that were mutated to Cys and were labeled with IAEDANS (marked with an asterisk) are plotted. In the left panels, data normalized with reference to the emission intensity of Trp at 0 M urea are plotted. Right panels show the FRET data that are plotted after normalizing the IAEDANS emission at 0 M urea equal to 1. The shaded region in the right panels marks the zone of urea concentration in which gp45WT forms MG. In the MG state, R131C∗, E144C∗, and G192C∗ come in close proximity to W199 and show increase in FRET. In contrast, C206∗ that lies in close proximity to W199 shows reduction in FRET because the two residues move apart. S19C∗ shows negligible change and was used as a negative control. The data shown are the average of at least two independent experiments with error bars representing the SD. To see this figure in color, go online.
Trapping of MG state of gp45 in native condition
The molten globule is the folding intermediate that is formed transiently during the protein folding process, and can be captured by carefully analyzing the denaturant-mediated unfolding paths of the protein (39, 40, 41). It has been suggested that changing the solvent pH can induce MG formation and much work has been done to characterize these MGs in nonnative environments (33, 46). However, isolation of the MG form of a protein in the native condition (i.e., nondenaturing buffer, at physiological pH and temperature) has rarely been achieved. Here we report the serendipitous isolation of the MG state of gp45 in native condition, and demonstrate that the properties of this isolated form of the protein are similar to what is observed for gp45 in the presence of 3.5 M urea.
The intermediate form of gp45 was isolated while rapidly refolding a denatured gp45 mutant containing the W92F/T137C mutation and the IAEDANS label at C137 on a size exclusion chromatograph. Further characterization of this isolated intermediate (hereafter referred to as “T137C∗MG”) provided interesting insights. Acrylamide-mediated fluorescence quenching of W199 in T137C∗MG mutant indicates that Trp is buried with having KSV values (Fig. 6 A) similar to those observed for gp45WT in its MG form (52). To compare its properties with that of the native molecule, we purified the gp45W92F/T137C (hereafter referred to as “T137C”) mutant under a nondenaturing condition; it was also labeled with IAEDANS (hereafter referred to as “T137C∗”) for comparison with other proteins. REES data obtained for T137C∗MG in 0 M urea match very well with that of T137C∗ in 3.5 M urea (Fig. 6 B). It immediately indicates that the conformation and the environment of Trp in T137C∗MG in 0 M urea is similar to T137C∗ in 3.5 M urea (Fig. 6 B); this also further agrees well with gp45W199 in 3.5 M urea (Fig. S2 B). We have previously shown that the MG form of gp45 can be observed on BN-PAGE (52, 54), and thus performed similar analysis with T137C∗MG. T137C∗MG shows retarded mobility on BN-PAGE even in 0 M urea, which is similar to that obtained for gp45WT (Fig. 6 C) and the T137C∗ mutant in 3.5 M urea (data not shown). T137C∗MG does not form a trimer in solution, as judged by the absence of a trimeric species in a formaldehyde cross-linking experiment (Fig. 6 D), whereas the native form of the mutant (T137C∗) forms a trimer in solution and is comparable to gp45WT. Furthermore, Trp fluorescence in T137C∗MG also shows a blue shift in 0 M urea, which is in agreement with T137C∗ at 3.5 M urea (Fig. 6 E). Because the T137C∗MG mutant molecule is IAEDANS-labeled, we performed FRET analysis using W199 as a donor and C137-IAEDANS as an acceptor. Here, FRET could be readily observed in 0 M urea that decreased upon increasing urea concentration to ∼6 M (Fig. 6 F). This is in sharp contrast with other mutants where FRET is observed only at intermediate urea concentrations.
Figure 6.

Trapping the MG form of gp45 in native condition. (A) Acrylamide-mediated fluorescence quenching of T137C∗MG shows W199 to be significantly buried when compared to W199 in gp45W199 (KSV ∼10 (52)). (B) REES data obtained by probing W199 in T137C∗ (open symbols) and T137C∗MG (filled symbols) are plotted. REES profile of T137C∗MG in 0 M urea overlaps well with that of T137C∗ in 3.5 M urea. An average of two independent experiments is plotted with the SD. Note that REES data for both the proteins at the same concentration of urea do not overlap. (C) Given here is a BN-PAGE profile of gp45WT at three different urea concentrations and T137C∗MG at 0 M urea. T137C∗MG shows retarded mobility in 0 M urea that is similar to the retarded mobility of DMG state of gp45WT obtained in 3.5 M urea. Here, T represents trimer, M, monomer, and MG, the molten globule form. (D) Sodium dodecyl sulfate-PAGE profile of the formaldehyde-mediated, cross-linked protein samples. T137C and T137C∗ mutants show reduced cross-linking efficiency in comparison to gp45WT. The trapped MG mutant (T137C∗MG) does not stay as a trimer in solution and shows no cross-linked trimer (T) on gel. D represents the dimeric species, whereas M denotes monomeric form of the protein; CL stands for cross-linker. Molecular-weight ladder is shown on the right with two bands marked. (E) Trp fluorescence intensity of T137C∗ and T137C∗MG in four urea concentrations, i.e., 0, 3.5, 6, and 8 M. The 0 M urea spectrum for T137C∗MG shows a blue-shifted profile similar to the 3.5 M urea profile of T137C∗. (F) Given here is a FRET analysis of an IAEDANS-labeled T137C∗MG mutant with increasing urea concentration. The mutant because of being trapped in MG form shows no significant change until ∼6 M urea, when the domain unfolds. The spectra were normalized to Trp emission at varying urea concentrations (left panel). FRET data were also normalized considering emission intensity of IAEDANS at 0 M urea equal to 1 and plotted in the right panel against increasing urea concentrations. The shaded region in the right panel marks the zone of urea concentration in which T137C∗MG remains in MG form. The data shown are the average of at least two independent experiments with error bars representing the SD. (G) Given here are coplotted far-UV CD profiles of T137C∗MG in 0 M urea and gp45WT (WT) in 3.5 M urea. The WT protein spectrum was recorded only until 207 nm because of the presence of urea. Both WT and T137C∗MG proteins show the presence of secondary structure. (H) Shown here is a comparison of near-UV CD profiles of T137C∗MG with gp45WT (WT) and gp45CTD (CTD) in 0 M urea (left panel) and in 3.5 M urea (right panel); in both the panels, T137C∗MG is in 0 M urea. The CD profile of T137C∗MG in 0 M urea resembles the gp45CTD and gp45WT in 3.5 M urea (right panel). To see this figure in color, go online.
Finally, we compared secondary and tertiary structure profiles of T137C∗MG with gp45WT and gp45CTD. Interestingly, the far-UV CD profile of T137C∗MG in 0 M urea is found to be similar to gp45WT in 3.5 M urea. This not only confirms that T137C∗MG contains secondary structure, but also indicates that the profile is equivalent to the MG form of gp45WT. Furthermore, near UV-CD profiles of both T137C∗MG and gp45CTD in 0 M urea are comparable (Fig. 6 H, left panel). More interestingly, near-UV CD profiles of gp45WT and gp45CTD in 3.5 M are similar to T137C∗MG in 0 M urea (Fig. 6 H, right panel). Our CD data thus clearly demonstrate that T137C∗MG in native buffer attains a structural conformation that is equivalent to the MG form of gp45CTD and gp45WT present in 3.5 M urea. We, therefore, conclude that T137C∗MG indeed represents the MG form of gp45 in native condition, which is otherwise obtained by treating the wild-type protein with intermediate urea concentrations.
We believe that ours is one of the few reports where a molten globule form of the protein has been captured and studied in native condition.
Conclusions
Proteins are dynamic entities inside cells. Subtle structural changes are shown to be involved in bringing contrasting functional abilities into the same protein (63, 64, 65). Thus, protein conformations hold significance in deciphering the biological role. Proteins are shown to adopt varying different conformations during folding/unfolding. These conformations, generally called molten globules, not only assist the protein to take native fold, but can also impart a functional advantage to the molecule (18, 21). Thus, understanding molecular details of these conformations is both interesting and important.
Here we present molecular characterization of an equilibrium unfolding dry molten globule intermediate state of a T4 bacteriophage gp45 sliding clamp. Our earlier data suggested that the CTD of gp45, unlike NTD, is a highly rigid entity (52) that can resist urea-mediated denaturation up to a concentration as high as ∼5.5 M. This rigidity is the consequence of a major conformational rearrangement that occurs after trimer dissociation into monomer at ∼2.5 M urea. We now show that this conformational rearrangement involves native to DMG transition. By monitoring Trp fluorescence, we establish that the C-terminal domain of gp45 forms a molten globule at intermediate urea concentrations. ANS binding data finally confirms that the protein forms a dry molten globule during denaturation. To obtain a global picture of the conformational rearrangement occurring in CTD, we performed Trp scanning mutagenesis of the surface as well as the core residues and studied several mutants by CD and fluorescence. Very few reports are available that demonstrate such detailed structural arrangements in a protein molecule in its folding intermediate form (66, 67). We show that the surface residues’ side chains in gp45 undergo a major conformational change by flipping inside the domain’s core. During such structural rearrangements, the solvent-accessible residues experience larger conformational changes than the residues in the domain’s core. We also present the isolation and characterization of the molten globule form of gp45 in native condition (nondenaturing buffer, at physiological pH and temperature). Extensive CD analyses demonstrate that the isolated MG form in native condition has secondary and tertiary structures comparable to the 3.5 M urea-treated gp45WT.
To date, only a few proteins are known to form DMG and these examples made Baldwin et al. (40) suggest that DMGs hold a common place in both unfolding and refolding. CTD in gp45 forms a stable DMG and, therefore, can act as a good model system to study unfolding/folding intermediates. Because only this domain of gp45 forms DMG, we envisage that DMG of CTD plays a significant role during gp45 folding and trimer assembly inside the cell after translation.
Author Contributions
V.J. and M.I.S. conceived the idea. M.I.S. performed the experiments. M.I.S. and V.J. analyzed the data and wrote the article.
Acknowledgments
We are grateful to Dr. R. Mahalakshmi, IISER Bhopal for critical comments on the manuscript.
M.I.S. acknowledges senior research fellowship support from the Council of Scientific & Industrial Research (CSIR), Government of India. This work is supported by a grant (#BT/PR17459/BRB/10/1486/2016) from the Department of Biotechnology, Government of India, to V.J.
Editor: Elizabeth Komives.
Footnotes
Manika Indrajit Singh’s present address is Center for Chromosome Stability, Department of Cellular and Molecular Medicines (ICMM), Panum Institute, University of Copenhagen, Blegdamsvej 3B, Copenhagen N, Denmark.
Supporting Materials and Methods, ten figures, and one table are available at http://www.biophysj.org/biophysj/supplemental/S0006-3495(17)30966-9.
Supporting Citations
Reference (68) appears in the Supporting Material.
Supporting Material
References
- 1.Chen Y., Ding F., Dokholyan N.V. Protein folding: then and now. Arch. Biochem. Biophys. 2008;469:4–19. doi: 10.1016/j.abb.2007.05.014. [DOI] [PMC free article] [PubMed] [Google Scholar]
- 2.Barrick D. What have we learned from the studies of two-state folders, and what are the unanswered questions about two-state protein folding? Phys. Biol. 2009;6:015001. doi: 10.1088/1478-3975/6/1/015001. [DOI] [PMC free article] [PubMed] [Google Scholar]
- 3.Arai M., Kuwajima K. Role of the molten globule state in protein folding. Adv. Protein Chem. 2000;53:209–282. doi: 10.1016/s0065-3233(00)53005-8. [DOI] [PubMed] [Google Scholar]
- 4.Khurana R., Udgaonkar J.B. Equilibrium unfolding studies of barstar: evidence for an alternative conformation which resembles a molten globule. Biochemistry. 1994;33:106–115. doi: 10.1021/bi00167a014. [DOI] [PubMed] [Google Scholar]
- 5.Elms P.J., Chodera J.D., Marqusee S. The molten globule state is unusually deformable under mechanical force. Proc. Natl. Acad. Sci. USA. 2012;109:3796–3801. doi: 10.1073/pnas.1115519109. [DOI] [PMC free article] [PubMed] [Google Scholar]
- 6.Ohgushi M., Wada A. “Molten-globule state”: a compact form of globular proteins with mobile side-chains. FEBS Lett. 1983;164:21–24. doi: 10.1016/0014-5793(83)80010-6. [DOI] [PubMed] [Google Scholar]
- 7.Dolgikh D.A., Gilmanshin R.I., Ptitsyn O.B. α-Lactalbumin: compact state with fluctuating tertiary structure? FEBS Lett. 1981;136:311–315. doi: 10.1016/0014-5793(81)80642-4. [DOI] [PubMed] [Google Scholar]
- 8.Baldwin R.L., Rose G.D. Molten globules, entropy-driven conformational change and protein folding. Curr. Opin. Struct. Biol. 2013;23:4–10. doi: 10.1016/j.sbi.2012.11.004. [DOI] [PubMed] [Google Scholar]
- 9.Jha S.K., Udgaonkar J.B. Direct evidence for a dry molten globule intermediate during the unfolding of a small protein. Proc. Natl. Acad. Sci. USA. 2009;106:12289–12294. doi: 10.1073/pnas.0905744106. [DOI] [PMC free article] [PubMed] [Google Scholar]
- 10.Colón W., Roder H. Kinetic intermediates in the formation of the cytochrome c molten globule. Nat. Struct. Biol. 1996;3:1019–1025. doi: 10.1038/nsb1296-1019. [DOI] [PubMed] [Google Scholar]
- 11.Hughson F.M., Wright P.E., Baldwin R.L. Structural characterization of a partly folded apomyoglobin intermediate. Science. 1990;249:1544–1548. doi: 10.1126/science.2218495. [DOI] [PubMed] [Google Scholar]
- 12.Wu L.C., Peng Z.Y., Kim P.S. Bipartite structure of the α-lactalbumin molten globule. Nat. Struct. Biol. 1995;2:281–286. doi: 10.1038/nsb0495-281. [DOI] [PubMed] [Google Scholar]
- 13.Kuwajima K. The molten globule state as a clue for understanding the folding and cooperativity of globular-protein structure. Proteins. 1989;6:87–103. doi: 10.1002/prot.340060202. [DOI] [PubMed] [Google Scholar]
- 14.Jaremko M., Jaremko Ł., Zweckstetter M. Cold denaturation of a protein dimer monitored at atomic resolution. Nat. Chem. Biol. 2013;9:264–270. doi: 10.1038/nchembio.1181. [DOI] [PMC free article] [PubMed] [Google Scholar]
- 15.Pastore A., Martin S.R., Temussi P.A. Unbiased cold denaturation: low- and high-temperature unfolding of yeast frataxin under physiological conditions. J. Am. Chem. Soc. 2007;129:5374–5375. doi: 10.1021/ja0714538. [DOI] [PMC free article] [PubMed] [Google Scholar]
- 16.Kumar R., Kukreja R.V., Singh B.R. Botulinum neurotoxin: unique folding of enzyme domain of the most-poisonous poison. J. Biomol. Struct. Dyn. 2014;32:804–815. doi: 10.1080/07391102.2013.791878. [DOI] [PubMed] [Google Scholar]
- 17.Vamvaca K., Vögeli B., Hilvert D. An enzymatic molten globule: efficient coupling of folding and catalysis. Proc. Natl. Acad. Sci. USA. 2004;101:12860–12864. doi: 10.1073/pnas.0404109101. [DOI] [PMC free article] [PubMed] [Google Scholar]
- 18.Pervushin K., Vamvaca K., Hilvert D. Structure and dynamics of a molten globular enzyme. Nat. Struct. Mol. Biol. 2007;14:1202–1206. doi: 10.1038/nsmb1325. [DOI] [PubMed] [Google Scholar]
- 19.Kuwajima K. The molten globule state of α-lactalbumin. FASEB J. 1996;10:102–109. doi: 10.1096/fasebj.10.1.8566530. [DOI] [PubMed] [Google Scholar]
- 20.Kjaergaard M., Teilum K., Poulsen F.M. Conformational selection in the molten globule state of the nuclear coactivator binding domain of CBP. Proc. Natl. Acad. Sci. USA. 2010;107:12535–12540. doi: 10.1073/pnas.1001693107. [DOI] [PMC free article] [PubMed] [Google Scholar]
- 21.Dhaliwal H.P.K., Kumar R., Singh B.R. Protein Toxins in Modeling Biochemistry. Springer; Cham, Switzerland: 2016. Implication of molten globule on the function and toxicity of a protein; pp. 73–112. [Google Scholar]
- 22.Uversky V.N., Narizhneva N.V. Effect of natural ligands on the structural properties and conformational stability of proteins. Biochemistry (Mosc.) 1998;63:420–433. [PubMed] [Google Scholar]
- 23.van der Vies S.M., Viitanen P.V., Jaenicke R. Conformational states of ribulosebisphosphate carboxylase and their interaction with chaperonin 60. Biochemistry. 1992;31:3635–3644. doi: 10.1021/bi00129a012. [DOI] [PubMed] [Google Scholar]
- 24.Uversky V.N., Dunker A.K. Understanding protein non-folding. Biochim. Biophys. Acta. 2010;1804:1231–1264. doi: 10.1016/j.bbapap.2010.01.017. [DOI] [PMC free article] [PubMed] [Google Scholar]
- 25.Hoeltzli S.D., Frieden C. Stopped-flow NMR spectroscopy: real-time unfolding studies of 6-19F-tryptophan-labeled Escherichia coli dihydrofolate reductase. Proc. Natl. Acad. Sci. USA. 1995;92:9318–9322. doi: 10.1073/pnas.92.20.9318. [DOI] [PMC free article] [PubMed] [Google Scholar]
- 26.Bychkova V.E., Dujsekina A.E., Ptitsyn O.B. Molten globule-like state of cytochrome c under conditions simulating those near the membrane surface. Biochemistry. 1996;35:6058–6063. doi: 10.1021/bi9522460. [DOI] [PubMed] [Google Scholar]
- 27.Ptitsyn O.B., Bychkova V.E., Uversky V.N. Kinetic and equilibrium folding intermediates. Philos. Trans. R. Soc. Lond. B Biol. Sci. 1995;348:35–41. doi: 10.1098/rstb.1995.0043. [DOI] [PubMed] [Google Scholar]
- 28.Ptitsyn O.B. Molten globule and protein folding. Adv. Protein Chem. 1995;47:83–229. doi: 10.1016/s0065-3233(08)60546-x. [DOI] [PubMed] [Google Scholar]
- 29.Henkens R.W., Kitchell B.B., Williams T.J. Detection and characterization using circular dichroism and fluorescence spectroscopy of a stable intermediate conformation formed in the denaturation of bovine carbonic anhydrase with guanidinium chloride. Biochemistry. 1982;21:5918–5923. doi: 10.1021/bi00266a029. [DOI] [PubMed] [Google Scholar]
- 30.Denton J.B., Konishi Y., Scheraga H.A. Folding of ribonuclease A from a partially disordered conformation. Kinetic study under folding conditions. Biochemistry. 1982;21:5155–5163. doi: 10.1021/bi00264a008. [DOI] [PubMed] [Google Scholar]
- 31.Eliezer D., Jennings P.A., Wright P.E. Populating the equilibrium molten globule state of apomyoglobin under conditions suitable for structural characterization by NMR. FEBS Lett. 1997;417:92–96. doi: 10.1016/s0014-5793(97)01256-8. [DOI] [PubMed] [Google Scholar]
- 32.Kiefhaber T., Labhardt A.M., Baldwin R.L. Direct NMR evidence for an intermediate preceding the rate-limiting step in the unfolding of ribonuclease A. Nature. 1995;375:513–515. doi: 10.1038/375513a0. [DOI] [PubMed] [Google Scholar]
- 33.Acharya N., Mishra P., Jha S.K. Evidence for dry molten globule-like domains in the pH-induced equilibrium folding intermediate of a multidomain protein. J. Phys. Chem. Lett. 2016;7:173–179. doi: 10.1021/acs.jpclett.5b02545. [DOI] [PubMed] [Google Scholar]
- 34.Shakhnovich E.I., Finkelstein A.V. Theory of cooperative transitions in protein molecules. I. Why denaturation of globular protein is a first-order phase transition. Biopolymers. 1989;28:1667–1680. doi: 10.1002/bip.360281003. [DOI] [PubMed] [Google Scholar]
- 35.Finkelstein A.V., Shakhnovich E.I. Theory of cooperative transitions in protein molecules. II. Phase diagram for a protein molecule in solution. Biopolymers. 1989;28:1681–1694. doi: 10.1002/bip.360281004. [DOI] [PubMed] [Google Scholar]
- 36.Raschke T.M., Marqusee S. The kinetic folding intermediate of ribonuclease H resembles the acid molten globule and partially unfolded molecules detected under native conditions. Nat. Struct. Biol. 1997;4:298–304. doi: 10.1038/nsb0497-298. [DOI] [PubMed] [Google Scholar]
- 37.Rami B.R., Udgaonkar J.B. Mechanism of formation of a productive molten globule form of barstar. Biochemistry. 2002;41:1710–1716. doi: 10.1021/bi0120300. [DOI] [PubMed] [Google Scholar]
- 38.Ramírez-Sarmiento C.A., Baez M., Guixé V. The folding unit of phosphofructokinase-2 as defined by the biophysical properties of a monomeric mutant. Biophys. J. 2015;108:2350–2361. doi: 10.1016/j.bpj.2015.04.001. [DOI] [PMC free article] [PubMed] [Google Scholar]
- 39.Jha S.K., Marqusee S. Kinetic evidence for a two-stage mechanism of protein denaturation by guanidinium chloride. Proc. Natl. Acad. Sci. USA. 2014;111:4856–4861. doi: 10.1073/pnas.1315453111. [DOI] [PMC free article] [PubMed] [Google Scholar]
- 40.Baldwin R.L., Frieden C., Rose G.D. Dry molten globule intermediates and the mechanism of protein unfolding. Proteins. 2010;78:2725–2737. doi: 10.1002/prot.22803. [DOI] [PMC free article] [PubMed] [Google Scholar]
- 41.Dasgupta A., Udgaonkar J.B., Das P. Multistage unfolding of an SH3 domain: an initial urea-filled dry molten globule precedes a wet molten globule with non-native structure. J. Phys. Chem. B. 2014;118:6380–6392. doi: 10.1021/jp410019f. [DOI] [PubMed] [Google Scholar]
- 42.Sarkar S.S., Udgaonkar J.B., Krishnamoorthy G. Unfolding of a small protein proceeds via dry and wet globules and a solvated transition state. Biophys. J. 2013;105:2392–2402. doi: 10.1016/j.bpj.2013.09.048. [DOI] [PMC free article] [PubMed] [Google Scholar]
- 43.Reiner A., Henklein P., Kiefhaber T. An unlocking/relocking barrier in conformational fluctuations of villin headpiece subdomain. Proc. Natl. Acad. Sci. USA. 2010;107:4955–4960. doi: 10.1073/pnas.0910001107. [DOI] [PMC free article] [PubMed] [Google Scholar]
- 44.Fu Y., Kasinath V., Wand A.J. Coupled motion in proteins revealed by pressure perturbation. J. Am. Chem. Soc. 2012;134:8543–8550. doi: 10.1021/ja3004655. [DOI] [PMC free article] [PubMed] [Google Scholar]
- 45.Chang J.Y., Li L. The structure of denatured α-lactalbumin elucidated by the technique of disulfide scrambling: fractionation of conformational isomers of α-lactalbumin. J. Biol. Chem. 2001;276:9705–9712. doi: 10.1074/jbc.M010700200. [DOI] [PubMed] [Google Scholar]
- 46.Golaki B.P., Aminzadeh S., Nadimifar M. The effect of pH on globular state of lipase-3646; an appropriate model for molten globule investigations. Protein J. 2015;34:267–274. doi: 10.1007/s10930-015-9622-1. [DOI] [PubMed] [Google Scholar]
- 47.Gao M., She Z.S., Zhou R. Key residues that play a critical role in urea-induced lysozyme unfolding. J. Phys. Chem. B. 2010;114:15687–15693. doi: 10.1021/jp1052453. [DOI] [PubMed] [Google Scholar]
- 48.Hua L., Zhou R., Berne B.J. Urea denaturation by stronger dispersion interactions with proteins than water implies a 2-stage unfolding. Proc. Natl. Acad. Sci. USA. 2008;105:16928–16933. doi: 10.1073/pnas.0808427105. [DOI] [PMC free article] [PubMed] [Google Scholar]
- 49.Almarza J., Rincon L., Brito F. Molecular mechanism for the denaturation of proteins by urea. Biochemistry. 2009;48:7608–7613. doi: 10.1021/bi9007116. [DOI] [PubMed] [Google Scholar]
- 50.Sridevi K., Udgaonkar J.B. Unfolding rates of barstar determined in native and low denaturant conditions indicate the presence of intermediates. Biochemistry. 2002;41:1568–1578. doi: 10.1021/bi011494v. [DOI] [PubMed] [Google Scholar]
- 51.Moarefi I., Jeruzalmi D., Kuriyan J. Crystal structure of the DNA polymerase processivity factor of T4 bacteriophage. J. Mol. Biol. 2000;296:1215–1223. doi: 10.1006/jmbi.1999.3511. [DOI] [PubMed] [Google Scholar]
- 52.Singh M.I., Jain V. Molecular dissection of the homotrimeric sliding clamp of T4 phage: two domains of a subunit display asymmetric characteristics. Biochemistry. 2016;55:588–596. doi: 10.1021/acs.biochem.5b01204. [DOI] [PubMed] [Google Scholar]
- 53.Singh M.I., Jain V. Tagging the expressed protein with 6 histidines: rapid cloning of an amplicon with three options. PLoS One. 2013;8:e63922. doi: 10.1371/journal.pone.0063922. [DOI] [PMC free article] [PubMed] [Google Scholar]
- 54.Singh M.I., Ganesh B., Jain V. On the domains of T4 phage sliding clamp gp45: an intermolecular crosstalk governs structural stability and biological activity. Biochim. Biophys. Acta. 2017;1861(1 Pt A):3300–3310. doi: 10.1016/j.bbagen.2016.08.012. [DOI] [PubMed] [Google Scholar]
- 55.Goddard, T. D., and D. G. Kneller. SPARKY 3. University of California, San Francisco, CA.
- 56.Schneider C.A., Rasband W.S., Eliceiri K.W. NIH Image to ImageJ: 25 years of image analysis. Nat. Methods. 2012;9:671–675. doi: 10.1038/nmeth.2089. [DOI] [PMC free article] [PubMed] [Google Scholar]
- 57.Chattopadhyay A., Haldar S. Dynamic insight into protein structure utilizing red edge excitation shift. Acc. Chem. Res. 2014;47:12–19. doi: 10.1021/ar400006z. [DOI] [PubMed] [Google Scholar]
- 58.Kim K.H., Yun S., Lee E.K. Thermodynamic analysis of ANS binding to partially unfolded α-lactalbumin: correlation of endothermic to exothermic changeover with formation of authentic molten globules. J. Mol. Recognit. 2016;29:446–451. doi: 10.1002/jmr.2543. [DOI] [PubMed] [Google Scholar]
- 59.Sinha K.K., Udgaonkar J.B. Dissecting the non-specific and specific components of the initial folding reaction of barstar by multi-site FRET measurements. J. Mol. Biol. 2007;370:385–405. doi: 10.1016/j.jmb.2007.04.061. [DOI] [PubMed] [Google Scholar]
- 60.Huang F., Settanni G., Fersht A.R. Fluorescence resonance energy transfer analysis of the folding pathway of Engrailed Homeodomain. Protein Eng. Des. Sel. 2008;21:131–146. doi: 10.1093/protein/gzm069. [DOI] [PubMed] [Google Scholar]
- 61.Jain V., Saleem-Batcha R., Chatterji D. Synthesis and hydrolysis of pppGpp in mycobacteria: a ligand mediated conformational switch in Rel. Biophys. Chem. 2007;127:41–50. doi: 10.1016/j.bpc.2006.12.003. [DOI] [PubMed] [Google Scholar]
- 62.Lella M., Kamilla S., Mahalakshmi R. Molecular mechanism of holin transmembrane domain I in pore formation and bacterial cell death. ACS Chem. Biol. 2016;11:910–920. doi: 10.1021/acschembio.5b00875. [DOI] [PubMed] [Google Scholar]
- 63.Woycechowsky K.J., Choutko A., Hilvert D. Relative tolerance of an enzymatic molten globule and its thermostable counterpart to point mutation. Biochemistry. 2008;47:13489–13496. doi: 10.1021/bi801108a. [DOI] [PubMed] [Google Scholar]
- 64.Tischer A., Madde P., Auton M. A molten globule intermediate of the von Willebrand factor A1 domain firmly tethers platelets under shear flow. Proteins. 2014;82:867–878. doi: 10.1002/prot.24464. [DOI] [PMC free article] [PubMed] [Google Scholar]
- 65.Guo J., Wu T., Levin J.G. Subtle alterations of the native zinc finger structures have dramatic effects on the nucleic acid chaperone activity of human immunodeficiency virus type 1 nucleocapsid protein. J. Virol. 2002;76:4370–4378. doi: 10.1128/JVI.76.9.4370-4378.2002. [DOI] [PMC free article] [PubMed] [Google Scholar]
- 66.Religa T.L., Markson J.S., Fersht A.R. Solution structure of a protein denatured state and folding intermediate. Nature. 2005;437:1053–1056. doi: 10.1038/nature04054. [DOI] [PubMed] [Google Scholar]
- 67.Neudecker P., Robustelli P., Kay L.E. Structure of an intermediate state in protein folding and aggregation. Science. 2012;336:362–366. doi: 10.1126/science.1214203. [DOI] [PubMed] [Google Scholar]
- 68.Erijman A., Dantes A., Peleg Y. Transfer-PCR (TPCR): a highway for DNA cloning and protein engineering. J. Struct. Biol. 2011;175:171–177. doi: 10.1016/j.jsb.2011.04.005. [DOI] [PubMed] [Google Scholar]
Associated Data
This section collects any data citations, data availability statements, or supplementary materials included in this article.