

Abstract
Exploring the molecular mechanisms that drive the maturation of oligodendrocyte progenitor cells (OPCs) during the remyelination process is essential to developing new therapeutic tools to intervene in demyelinating diseases such as multiple sclerosis. To determine whether L-type voltage-gated calcium channels (L-VGCCs) are required for OPC development during remyelination, we generated an inducible conditional knock-out mouse in which the L-VGCC isoform Cav1.2 was deleted in NG2-positive OPCs (Cav1.2KO). Using the cuprizone (CPZ) model of demyelination and mice of either sex, we establish that Cav1.2 deletion in OPCs leads to less efficient remyelination of the adult brain. Specifically, Cav1.2KO OPCs mature slower and produce less myelin than control oligodendrocytes during the recovery period after CPZ intoxication. This reduced remyelination was accompanied by an important decline in the number of myelinating oligodendrocytes and in the rate of OPC proliferation. Furthermore, during the remyelination phase of the CPZ model, the corpus callosum of Cav1.2KO animals presented a significant decrease in the percentage of myelinated axons and a substantial increase in the mean g-ratio of myelinated axons compared with controls. In addition, in a mouse line in which the Cav1.2KO OPCs were identified by a Cre reporter, we establish that Cav1.2KO OPCs display a reduced maturational rate through the entire remyelination process. These results suggest that Ca2+ influx mediated by L-VGCCs in oligodendroglial cells is necessary for normal remyelination and is an essential Ca2+ channel for OPC maturation during the remyelination of the adult brain.
SIGNIFICANCE STATEMENT Ion channels implicated in oligodendrocyte differentiation and maturation may induce positive signals for myelin recovery. Voltage-gated Ca2+ channels (VGCCs) are important for normal myelination by acting at several critical steps during oligodendrocyte progenitor cell (OPC) development. To determine whether voltage Ca2+ entry is involved in oligodendrocyte differentiation and remyelination, we used a conditional knockout mouse for VGCCs in OPCs. Our results indicate that VGCCs can modulate oligodendrocyte maturation in the demyelinated brain and suggest that voltage-gated Ca2+ influx in OPCs is critical for remyelination. These findings could lead to novel approaches for obtaining a better understanding of the factors that control OPC maturation in order to stimulate this pool of progenitors to replace myelin in demyelinating diseases.
Keywords: Cav1.2, cuprizone, oligodendrocyte, remyelination, voltage-operated Ca2+ channels
Introduction
The influx of Ca2+ through membrane channels is a crucial step in signal transduction pathways involved in regulating growth, maturation, and functional plasticity. Whole-cell recordings from oligodendrocyte progenitor cells (OPCs) in conditions appropriate for isolating Ca2+ currents have revealed the presence of Ca2+ currents sensitive to inhibition by L- and T-type Ca2+ channel antagonists (Haberlandt et al., 2011). Further evidence for expression of different voltage-gated Ca2+ channel (VGCC) isoforms has been obtained through PCR of mRNA extracted from single cells in tissue slices, indicating that transcripts for L-type (Cav 1.2, 1.3) and T-type (Cav 3.1, 3.2) channels are the most abundant (Haberlandt et al., 2011). We have shown that both the Cav1.2 and Cav1.3 L-type α1 subunits are expressed in primary cultures of cortical OPCs (Cheli et al., 2015). Cav1.2 has been of major interest because >90% of the Ca2+ influx after plasma membrane depolarization in OPCs is mediated by this particular L-type α1 subunit (Cheli et al., 2015).
Voltage-dependent Ca2+ entry is essential for multiple aspects of OPC development. L-type Ca2+ channels regulate process extension and migration in OPCs (Paez et al., 2007, 2009a, 2009b, 2010). Specifically, in vitro studies of isolated OPCs indicate that they undergo spontaneous Ca2+ transients while migrating, events that are inhibited by the L-type Ca2+ antagonist nifedipine (Paez et al., 2009a). Elevation of Ca2+ in these cells through L-VGCCs triggers process retraction, suggesting that these channels are involved in regulating the directed movement of OPCs during early development (Paez et al., 2007, 2009a). Furthermore, we have provided direct evidence that selective deletion of Cav1.2 Ca2+ channels in OPCs affects oligodendrocyte development in vitro (Cheli et al., 2015) and we have recently established that L-type Ca2+ channels are crucial for the adequate migration and proliferation of OPCs throughout the myelination of the postnatal mouse brain (Cheli et al., 2016).
Remyelination is the process in which entire myelin sheaths are replaced on demyelinated axons. In demyelinating diseases such as multiple sclerosis, this process becomes increasingly less effective over time and eventually fails (Franklin, 2002). Therefore, efforts to understand the causes for this failure of regeneration have stimulated research into the cellular and molecular aspects regulating the remyelination process. It is likely that factors involved in normal myelination participate in remyelination of the injured CNS. Calcium channels implicated in OPC differentiation and maturation may induce positive signals for recovery. Using the Cre-lox system to silence L-type Ca2+ channel expression in OPCs, we tested the role of voltage-dependent Ca2+ entry on OPC survival and maturation in the remyelinating brain. We used the cuprizone (CPZ) model of demyelination, which has proven to be a useful tool for the analysis of myelin loss and recovery in the CNS. Our data indicate that L-VGCC activity can modulate OPC maturation in the remyelinated brain and suggest that Ca2+ influx mediated by L-type channels is critical for normal remyelination. These findings could lead to novel approaches to intervene in neurodegenerative diseases in which myelin is loss or damaged.
Materials and Methods
Transgenic mice.
All animals used in the present study were housed in the University of Buffalo (UB) Division of Laboratory Animal Medicine vivarium. Procedures were approved by UB's Animal Care and Use Committee and conducted in accordance with the Guide for the Care and Use of Laboratory Animals from the National Institutes of Health. Generation of the conditional knock-out mouse (Cav1.2f/f, NG2-CreERCre/Ø) and floxed control mouse (Cav1.2f/f, NG2-CreERØ/Ø) has been described previously (White et al., 2008; Cheli et al., 2016). For ease of reading, the Cav1.2f/f, NG2-CreERCre/Ø mouse will be referred to as Cav1.2KO throughout the remainder of the text. Using a similar breeding protocol, the heterozygous floxed Cav1.2 mouse and the hemizygous NG2-CreER transgenic line were intercrossed with the Cre reporter line B6.Cg-Tg(CAG-Bgeo/GFP)21Lbe/J (Jax mice, RRID:IMSR_JAX:004178) to achieve the following experimental genotypes: conditional knock-out with the Cre reporter transgene (Cav1.2f/f, NG2-CreERCre/Ø, GFPGFP/Ø) and Cre reporter control (Cav1.2+/+, NG2-CreERCre/Ø, GFPGFP/Ø). For ease of reading, the Cav1.2KO mouse carrying the Cre reporter transgene (Cav1.2f/f, NG2-CreERCre/Ø, GFPGFP/Ø) will be referred to as Cav1.2KO/GFP.
Mice treatments.
Postnatal day 60 (P60) mice were fed pellet chow containing 0.2% CPZ (Teklad-Envigo) for 7 weeks to induce demyelination, followed by a diet of normal pellet chow to analyze remyelination. In addition, a group of P60 animals were not treated and were maintained on a diet of normal pellet chow. Cre activity in mice was induced by intraperitoneal injection of tamoxifen (Sigma-Aldrich). Stock solutions (20 mg/ml) were prepared by dissolving and sonicating tamoxifen in autoclaved corn oil (Sigma-Aldrich). Control (Cav1.2f/f, NG2-CreERØ/Ø) and Cav1.2KO (Cav1.2f/f, NG2-CreERCre/Ø) mice were injected with tamoxifen (100 mg/kg) every other day for 2 weeks for a total of 7 injections starting at different time points during and after the CPZ treatment. Because no differences between sexes were found, for all of the experiments presented in this study, mice of either sex were used.
Western blot.
Total proteins were collected from mouse whole brain and corpus callosum. Tissues were homogenized in lysis buffer containing 50 mm Tris-HCl, 0.5% (w/v) sodium deoxycholate, 150 mm NaCl, 1 mm EDTA, 2% Nonidet P40, 0.2% (w/v) SDS, 1 mm sodium fluoride, 1 mm AEBSF, 10 μg/ml aprotinin, 10 μg/ml leupeptin, and 10 μg/ml pepstatin. After a brief sonication, samples were centrifuged at 15,000 × g for 5 min and the supernatant recovered. The total protein concentration was estimated using the Pierce BCA Protein Assay Kit. Twenty-five micrograms of total proteins were loaded onto a 4–12% Bis-Tris gel (NuPAGE; Life Technologies). Protein bands were detected by chemiluminescence using the GE Healthcare ECL kit with horseradish peroxidase-conjugated secondary antibodies (GE Healthcare, RRID:AB_772206, RRID:AB_772210) and scanned with a C-Digit Blot Scanner (LI-COR). Image Studio Software (LI-COR, RRID:SCR_014211) was used for the quantification of the relative intensities of the protein bands. Data represent pooled results from at least four independent samples per experimental group. The primary antibodies used were as follows: 2′, 3′-cyclic nucleotide 3′-phosphodiesterase (CNP) (1:1000; Neo-Markes, RRID:AB_61312), GAPDH (1:10,000; Genetex, RRID:AB_11174761), myelin binding protein (MBP) (1:1000; Covance, RRID:AB_510039), myelin oligodendrocyte glycoprotein (MOG) (1:1000; Millipore, RRID:AB_1587278), and p84 (1:6000; Genetex, RRID:AB_372637).
Immunohistochemistry.
All animals were anesthetized with isoflurane and then perfused with 4% of paraformaldehyde in PBS via the left ventricle. The brains were next postfixed overnight in the same fixative solution at 4°C. Coronal brain slices 50 μm thick were obtained using a vibratome (Leica, VT1000-S). Free-floating vibratome sections were incubated in a blocking solution (2% goat serum and 1% Triton X-100 in PBS) for 2 h at room temperature and then incubated with the primary antibody overnight at 4°C. Sections were next rinsed in PBS and incubated with Cy3- or Cy5-conjugated secondary antibodies (1:400; Jackson ImmunoResearch) for 2 h at room temperature followed by a counterstain with the nuclear dye DAPI (Life Technologies). After washing, the sections were mounted on to Superfrost Plus slides (Fisher Scientific) using coverslips and mounting medium (Aquamount; Thermo Scientific). The total number of positive cells was quantified stereologically in the central (0.3 mm2) and lateral area of the corpus callosum (0.5 mm2), cingulate cortex (0.6 mm2, including all the cortical layers), and striatum (0.6 mm2). Same brain areas were used to measure the integrated fluorescence intensity, calculated as the product of the area and mean pixel intensity. The staining intensity for myelin proteins as well as the number of positive cells was assessed by MetaMorph software (Molecular Devices, RRID:SCR_002368). For all experiments involving quantification of positive cells and fluorescent intensity in tissue sections, data represent pooled results from at least six brains per experimental group. Seven slices per brain (50 μm each) were used and quantification was performed blinded to the genotype of the sample using an unbiased stereological sampling method. The primary antibodies used in the present study were against: caspase-3 (1:1000; Cell Signaling Technology, RRID:AB_2341188), CC1 (1:300; Calbiochem, RRID:AB_2057371), green fluorescent protein (GFP) (1:500; Millipore, RRID:AB_1121640), GFP (1:500; Aves Laboratories, RRID:AB_10000240), Ki67 (1:250; Abcam, RRID:AB_443209), MBP (1:1000; Millipore, RRID:AB_2140351), MOG (1:200; Millipore, RRID:AB_1587278), Olig2 (1:200; Millipore, RRID:AB_570666, RRID:AB_10807410), proteolipid protein (PLP) (1:50; hybridoma AA3, RRID:AB_2341144), and Sox2 (1:200; Millipore, RRID:AB_2286686).
Black Gold II myelin staining.
The Black Gold II staining kit (Millipore) was used following the manufacturer instructions. Briefly, 50 μm paraformaldehyde-fixed brain sections were mounted onto Superfrost Plus slide (Fisher Scientific). Coronal brain slices were initially air dried and then rehydrated and transferred to a lukewarm 0.3% Black Gold II solution (Millipore). After color development (∼10 min), the slides were rinsed with a 1% sodium thiosulfate solution at 60°C, dehydrated, and mounted with Permount (Cheli et al., 2016). The integrated staining intensity in several brain areas was assessed by MetaMorph software (Molecular Devices, RRID:SCR_002368). Data represent pooled results from at least four brains per experimental group. Ten slices per brain were used and quantification was performed blinded to the genotype of the sample.
Electron microscopy.
Brains from mice perfused transcardially with 3% paraformaldehyde and 1% glutaraldehyde were used. The body of the corpus callosum at the anterior–dorsal level of the hippocampus was dissected and resin embedded. Thin sections were stained with uranyl acetate and lead citrate and photographed with an FEI Tecnai F20 transmission electron microscope. Extent of myelination was compared quantitatively by determining g-ratios, which were calculated by dividing the diameter of the axon by the diameter of the entire myelinated fiber as described previously (Cheli et al., 2016). In addition, the percentage of myelinated axons from the total number of axons was calculated. At least five animals per experimental group and 300 fibers per animal were analyzed using the MetaMorph software (Molecular Devices, RRID:SCR_002368).
Statistical analysis.
All datasets were tested for normal distribution using Kolmogorov–Smirnov tests. Single between-group comparisons were made by the unpaired t test (Student's t test) using a confidence interval of 95%. Multiple comparisons were investigated by one-way ANOVA followed by Bonferroni's multiple-comparisons tests to detect pairwise between-group differences. All statistical tests were performed in Prism software (GraphPad, RRID:SCR_002798). A fixed value of p < 0.05 for one-tailed tests was the criterion for reliable differences between groups. Data are presented as mean ± SEM.
Results
Deletion of the L-type calcium channel Cav1.2 in OPCs delay remyelination of several brain structures
P60 Cav1.2KO mice (Cav1.2f/f, NG2-CreERCre/Ø) and control littermates (Cav1.2f/f, NG2-CreERØ/Ø) were fed with 0.2% CPZ in normal diet for 7 weeks to trigger myelin loss, followed by withdrawal of CPZ from the diet for several weeks to allow myelin regeneration. To induce Cre activity in NG2-positive OPCs, three different protocols of tamoxifen administration were tested. In Protocol (a), control and Cav1.2KO animals were injected with tamoxifen every other day during the last week of the CPZ treatment and the first week of recovery. In Protocol (b), mice were injected throughout the first and second week of recovery. In Protocol (c), animals were treated with tamoxifen during the second and third week of the recovery phase (Fig. 1A). In all protocols, animals received a total of seven tamoxifen injections. In addition, P60 control mice were not injected and were just treated with CPZ for 7 weeks (CPZ) or were maintained on a diet of normal pellet chow (untreated). Initially, the expression of the myelin proteins MBP and MOG was evaluated in the corpus callosum and cortex by immunohistochemistry and Western blot (Figs. 1, 2). Similar to previous studies (Armstrong et al., 2006; Islam et al., 2009), histological examination of the corpus callosum after 7 weeks of CPZ treatment revealed an overall decrease in MBP and MOG immunostaining relative to untreated animals (Fig. 1B,C). No differences between genotypes were found at the conclusion of the CPZ treatment; compared with untreated animals, control and Cav1.2KO mice injected with the Protocol (a) and examined at the end of the CPZ treatment (CPZ withdrawal) displayed an equal decline in MBP and MOG immunostaining (Fig. 1C). However, the specific deletion of Cav1.2 Ca2+ channels in NG2 positive OPCs caused a significant delay in remyelination. After 4 weeks of recovery (4W Rec), the expression of MBP and MOG in the corpus callosum as well as in the cortex of Cav1.2KO animals was below control levels (Fig. 1B,C). This effect was more pronounced in Protocol (a) > Protocol (b) > Protocol (c) (Fig. 1B,C). These changes were also found in Western blot experiments for myelin proteins isolated from the entire brain and corpus callosum (Fig. 2A,B). Because we found no significant differences between control animals injected with Protocol (a), (b), or (c) during the recovery phase of the CPZ model, the results were combined in a single column. Because Protocol (a) was the most effective, this tamoxifen injection schedule was used for the rest of the experiments presented in this work.
Figure 1.

Reduced myelin protein levels in the remyelination of the Cav1.2KO brain. A, Control and Cav1.2KO mice were injected with tamoxifen following Protocols (a), (b), and (c). Brain tissue was collected at the end of the CPZ treatment (CPZ withdrawal) for animals injected with Protocol (a) and after 4 weeks of recovery (4W Rec) for all protocols. In addition, brain tissue was collected from untreated mice and mice treated with CPZ for 7 weeks. B, Representative coronal sections of the central area of the corpus callosum immunostained for MBP and MOG. Scale bar, 180 μm. C, Myelin was quantified by analyzing the integrated fluorescence intensity of MBP and MOG in the central area of the corpus callosum (CC) and the cingulate cortex (CX). Multiple comparisons were done by one-way ANOVA followed by Bonferroni's multiple-comparisons test. Data represent pooled results from at least six brains per experimental group and values are expressed as mean ± SEM. ###p < 0.001 versus untreated; *p < 0.05, **p < 0.01, ***p < 0.001 versus control.
Figure 2.

Western blot analysis of myelin protein expression. Total proteins were collected from the whole brain (A) and from the corpus callosum (B) of untreated mice, mice treated with CPZ for 7 weeks (CPZ), and control and Cav1.2KO mice at 4 weeks of recovery (4W Rec). Control and Cav1.2KO mice were injected following Protocols (a), (b), and (c). Representative Western blots for CNP, MOG, and MBP are shown. P84 was used as the internal standard and data from four independent experiments are summarized based on the relative spot intensities and plotted as percentage of the control. Multiple comparisons were done by one-way ANOVA followed by Bonferroni's multiple-comparisons test. Values are expressed as mean ± SEM of at least four independent experiments. ###p < 0.001 versus untreated; *p < 0.05, **p < 0.01, ***p < 0.001 versus control.
The remyelination of the Cav1.2KO mouse brain was further examined using the Black Gold II staining technique to localize myelin within the CNS. Myelin staining was evaluated in the corpus callosum, cortex, and striatum of Cav1.2KO mice injected following Protocol (a). At the initiation of the remyelination process (1W Rec), Cav1.2KO mice display a substantial reduction in myelin staining in the lateral corpus callosum and a clear reduction in the density of myelinated fibers in the cingulate cortex relative to control animals (Fig. 3A,B). In the same experimental group, decreased myelin staining was also evident in the striatum (Fig. 3A,B). Similar results were found 4 weeks after the suspension of CPZ intoxication (Fig. 3A,B). Importantly, this reduced remyelination relative to control animals was also found in Western blot experiments for myelin proteins (Fig. 3C). Immunohistochemical analysis for MBP, MOG, and PLP exhibits a similar outcome, with the Cav1.2KO line showing a reduced recovery of myelin protein immunolabeling throughout the recuperation phase of the CPZ intoxication (Figs. 4, 5). For example, at 1 and 2 weeks of recovery, control mice had significantly improved levels of myelin protein expression in all brain regions, but, compared with the CPZ group, the Cav1.2KO mice showed marginal recovery at these time points (Figs. 4, 5). This reduced remyelination in Cav1.2KO mice was more evident in the cortex and in the striatum (Figs. 4, 5). Similar results were found after 4 and 6 weeks of recovery, suggesting that the remyelination deficit in the Cav1.2KO line is resistant (Fig. 5A,B).
Figure 3.
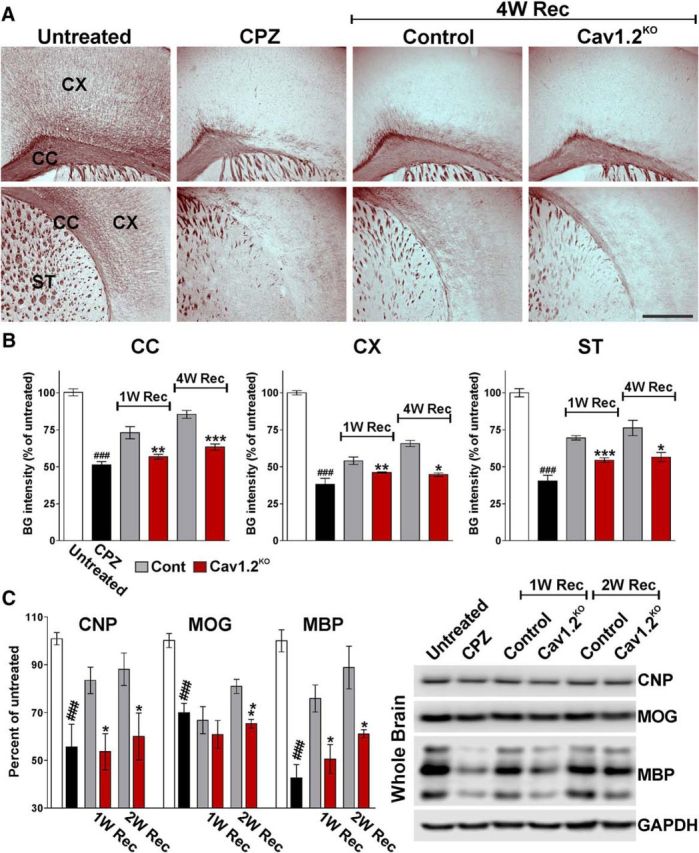
Black Gold II staining for myelin in the Cav1.2KO brain. A, Black Gold II staining in representative coronal sections of brain tissue collected from untreated animals (untreated), mice treated with CPZ for 7 weeks (CPZ), and control and Cav1.2KO mice at 4 weeks of recovery (4W Rec). Scale bar, 360 μm. Control and Cav1.2KO mice were injected following Protocol (a). B, Black Gold II integrated staining intensity was quantified in the lateral area of the corpus callosum (CC), cingulate cortex (CX), and striatum (ST) at 1 and 4 weeks of recovery (1, 4W Rec). C, Total proteins were collected from the whole brain to assess the expression of CNP, MOG, and MBP by Western blot. GAPDH was used as the internal standard and data from four independent experiments are summarized based on the relative spot intensities and plotted as percentage of the control. Comparisons between experimental groups were made by the unpaired t test. Data represent pooled results from at least four brains per experimental group and values are expressed as mean ± SEM. ##p < 0.01, ###p < 0.001 versus untreated; *p < 0.05, **p < 0.01, ***p < 0.001 versus control.
Figure 4.
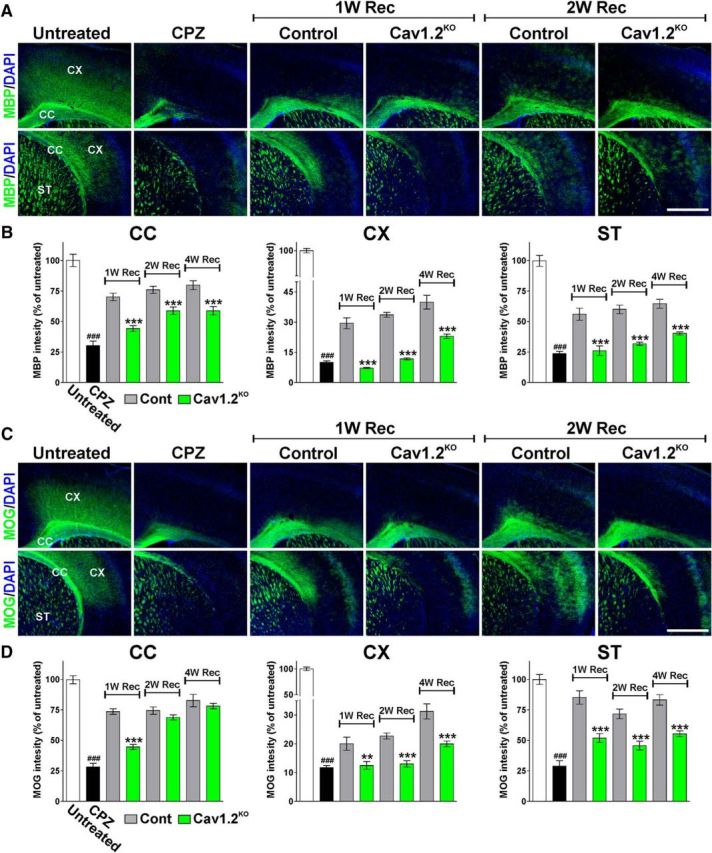
Reduced myelin proteins synthesis through the remyelination of the Cav1.2KO brain. A, C, Representative coronal sections of brain tissue immunostained for MBP and MOG collected from untreated animals (untreated), mice treated with CPZ for 7 weeks (CPZ), and control and Cav1.2KO mice at 1, 2, and 4 weeks of recovery (1, 2, 4W Rec). Scale bar, 180 μm. B, D, Integrated fluorescence intensity for MBP and MOG was quantified in the lateral corpus callosum (CC), cingulate cortex (CX), and striatum (ST). Comparisons between experimental groups were made by the unpaired t test. Data represent pooled results from at least six brains per experimental group and values are expressed as mean ± SEM. ###p < 0.001 versus untreated; *p < 0.05, ***p < 0.001 versus control.
Figure 5.

Reduced PLP expression in the remyelination of the Cav1.2KO brain. A, Representative coronal sections of brain tissue immunostained for PLP collected from untreated animals (untreated), mice treated with CPZ for 7 weeks (CPZ), and control and Cav1.2KO mice at 6 weeks of recovery (6W Rec). Scale bar, 180 μm. B, Integrated fluorescence intensity for PLP was quantified in the lateral corpus callosum (CC), cingulate cortex (CX), and striatum (ST). Comparisons between experimental groups were made by the unpaired t test. Data represent pooled results from at least six brains per experimental group and values are expressed as mean ± SEM. ###p < 0.001 versus untreated; *p < 0.05, **p < 0.01, ***p < 0.001 versus control.
We also used electron microscopy to evaluate the ultrastructure of axon and myelin integrity in the Cav1.2KO brains during the remyelination process. The degree of remyelination was analyzed in control and Cav1.2KO mice by calculating the axon diameter, myelin thickness, and mean g-ratio of myelinated axons, as described previously (Cheli et al., 2016) (Fig. 6). Seven weeks of CPZ treatment induced a significant decrease in the proportion of myelinated axons located in the body of the corpus callosum (Fig. 6A,F). Some recovery was found in Cav1.2KO animals during the remyelination process, but consistent with the previous results, the percentage of myelinated axons in the corpus callosum of Cav1.2KO animals was found to be below control levels in all time points tested (Fig. 6A,C,F). Furthermore, g-ratios, a measure of myelin sheath thickness calculated as the ratio of axon diameter to myelinated fiber diameter, were determined for Cav1.2KO mice and control littermates (Fig. 6B,D,E). At 2 weeks of recovery, the mean g-ratio of myelinated axons from Cav1.2KO mice was significantly higher compared with controls, indicating that the myelin sheaths were thinner in Cav1.2KO mice (Fig. 6D,E). Plotting g-ratios against axonal diameters demonstrated that the myelin thickness was lower in axons of all size (Fig. 6D). Importantly, no axonal loss and/or degeneration and no changes in the mean diameter of remyelinated axons were found in the corpus callosum of Cav1.2KO mice (Fig. 6G). These data indicate that remyelination is decreased in the brains of Cav1.2KO mice and suggest that less myelin has been made by Cav1.2KO oligodendrocytes during the recovery phase of our demyelinating model.
Figure 6.

Electron microscopy of the Cav1.2KO corpus callosum during remyelination. A, C, Electron micrographs of axons in the corpus callosum of untreated animals (untreated), mice treated with CPZ for 7 weeks (CPZ), and control and Cav1.2KO mice at 2 weeks of recovery (2W Rec). Scale bars: top, 8 μm; bottom, 2 μm. B, D, Scatter plot of g-ratio values in the same experimental conditions. E, Mean g-ratio in the corpus callosum of untreated animals, mice treated with CPZ for 7 weeks, and control and Cav1.2KO mice at 1, 2, and 4 weeks of recovery. F, Percentage of myelinated axons in the same experimental conditions. G, Mean axonal diameter of myelinated axons in untreated animals, mice treated with CPZ for 7 weeks, and control and Cav1.2KO mice at 2 weeks of recovery. Comparisons between experimental groups were made by the unpaired t test. Values are expressed as mean ± SEM. Five animals per experimental group and 300 fibers per animal were analyzed. ###p < 0.001 versus untreated; **p < 0.01, ***p < 0.001 versus control.
Decreased number of mature oligodendrocytes through the remyelination of the Cav1.2KO brain
To further examine the effect of Cav1.2 deletion in the remyelination of the mouse brain, specific oligodendrocyte markers such as Olig2 and CC1 were used to measure the number of oligodendrocytes in vivo. In previous studies (Paez et al., 2012), we found that CPZ induced a progressive decrease in mature myelinating oligodendrocytes with an increase in OPCs, which returned to near normal levels when the animals were returned to the standard diet for 4 weeks. Compared with controls, decreased numbers of total oligodendrocytes (Olig2-positive cells) were found in the Cav1.2KO corpus callosum, cortex, and striatum at 1, 2, and 4 weeks of recovery (Fig. 7A,B). Likewise, at the same time points, Cav1.2KO animals displayed a significant reduction in the density of CC1-positive cells in the corpus callosum, cortex, and striatum (Fig. 7A,C). To evaluate the proportion of mature oligodendrocytes in relationship to the total population, we measured the percentage of Olig2-positive cells that were CC1-positive oligodendrocytes. Relative to controls, Cav1.2KO mice displayed a decreased ratio of Olig2/CC1 double-positive cells in the corpus callosum, cortex, and striatum during the recovery phase of the CPZ model, suggesting a diminished maturational rate (Fig. 7A,D). Furthermore, OPC proliferation was evaluated using the mitotic marker Ki67 in combination with the oligodendrocyte marker Olig2 and the proportion of newly generated OPCs was assessed by evaluating colocalization of Olig2 with the transcription factor Sox2 (Fig. 8). Suggesting a decline in the rate of OPC proliferation during the recovery phase of the CPZ model, Cav1.2KO mice displayed a significant decrease in the percentage of Olig2/Ki67 as well as Olig2/Sox2 double-positive cells in the lateral area of the corpus callosum, subventricular zone, and cortex and striatum (Fig. 8).
Figure 7.

Reduced number of mature oligodendrocytes in the Cav1.2KO mouse during the recovery phase of the CPZ model. A, Representative coronal sections of brain tissue immunostained for Olig2 and CC1 from untreated animals (untreated), mice treated with CPZ for 7 weeks (CPZ), and control and Cav1.2KO mice at 2 weeks of recovery (2W Rec). Scale bar, 180 μm. B–D, Number of Olig2- and CC1-positive cells and the percentage of Olig2/CC1 double-positive cells were stereologically quantified in the lateral area of the corpus callosum (CC), cingulate cortex (CX), and striatum (ST). Comparisons between experimental groups were made by the unpaired t test. Data represent pooled results from at least six brains per experimental group and values are expressed as mean ± SEM. ###p < 0.001 versus untreated; *p < 0.05, **p < 0.01, ***p < 0.001 versus control.
Figure 8.

Reduced OPC proliferation in the Cav1.2KO mouse after demyelination. A, C, Representative coronal sections of the subventricular zone immunostained for Olig2, Ki67, and Sox2 from untreated animals (untreated), mice treated with CPZ for 7 weeks (CPZ), and control and Cav1.2KO mice at 2 weeks of recovery (2W Rec). Scale bar, 90 μm. B, D, Number of Olig2/Ki67 and Olig2/Sox2 double-positive cells was stereologically quantified in the subventricular zone (SVZ), the lateral area of the corpus callosum (CC), cingulate cortex (CX), and striatum (ST). Comparisons between experimental groups were made by the unpaired t test. Data represent pooled results from at least six brains per experimental group and values are expressed as mean ± SEM. #p < 0.05, ##p < 0.01, ###p < 0.001 versus untreated; *p < 0.05, **p < 0.01, ***p < 0.001 versus control.
Cav1.2KO OPCs produce less mature oligodendrocytes than control progenitors in the remyelinating adult brain
To investigate the fate of Cav1.2KO OPCs throughout the remyelination process, we generated a triple-transgenic mouse by crossing the Cav1.2KO mice with a Cre reporter line. When the Cre reporter mice B6.Cg-Tg(CAG-Bgeo/GFP)21Lbe/J is crossed with a Cre-expressing strain, lacZ expression is replaced with enhanced GFP expression in cells expressing Cre, providing a convenient marker for Cav1.2KO OPCs in the remyelinating brain. Cav1.2KO/GFP mice (Cav1.2f/f, NG2-CreERCre/Ø, GFPGFP/Ø) and their corresponding controls (Cav1.2+/+, NG2CreERCre/Ø, GFPGFP/Ø) were injected with tamoxifen every other day during the last week of the CPZ treatment and the first week of recovery (Protocol (a); Fig. 1A). To compare the ability of Cav1.2KO/GFP cells to generate myelinating cells, the percentage of mature and immature GFP-positive oligodendrocytes was determined after 2 and 4 weeks of recovery. Initially, the proportion of GFP-positive cells that were Olig2-positive oligodendrocytes was analyzed. In every brain area examined, we found that all GFP-positive cells were Olig2-positive oligodendrocytes, suggesting a lineage-specific and restricted recombination (Fig. 9A). Next, to compare the ability of Cav1.2KO/GFP cells to generate myelinating oligodendrocytes after demyelination, the percentage of GFP-positive cells that were CC1-positive oligodendrocytes was measured. We found a significant decline in the percentage of GFP/CC1 double-positive cells between control and Cav1.2KO/GFP oligodendrocytes in all the brain structures assessed (Fig. 9A,B). For instance, 58% of the control GFP-positive cells were CC1-positive oligodendrocytes in the cortex at 4 weeks of recovery, but only ∼30% of the Cav1.2KO/GFP cells were found to be CC1-positive at the same time (Fig. 9A,B). Consistently, at 2 and 4 weeks of recovery, the percentage of Sox2-expressing cells was higher in the Cav1.2KO/GFP population than in control GFP cells, suggesting a slower maturational rate (Fig. 9A,B). In addition, the proportion of proliferating and apoptotic OPCs was estimated in the Cav1.2KO/GFP mice at 2 weeks of recovery by using the mitotic marker Ki67 and the apoptotic marker caspase-3. As shown in Figure 10B, the percentage of GFP/Ki67 double-positive cells in the subventricular zone and in the cortex was significantly reduced in L-VGCC-deficient OPCs. In contrast, the proportion of apoptotic GFP-positive cells (GFP/Caspase-3) was not different among the genotypes in the corpus callosum and in the cortex, but was mildly decreased in the subventricular zone (Fig. 10A,B), probably due to the restricted proliferation and maturation of this OPC population. The morphology of GFP-positive cells was also studied by dividing the cells in two groups according to the presence of radial processes (immature oligodendrocytes) or parallel processes (myelinating oligodendrocytes). In agreement with the results described above, the number of GFP-positive oligodendrocytes with mature myelinating morphology was much greater in the control than in the Cav1.2KO/GFP corpus callosum or cortex at 4 weeks of recovery (Fig. 10C,D). Together, these findings indicate that fewer mature oligodendrocytes are generated from Cav1.2KO/GFP OPCs than from control cells during the remyelination of the mouse brain.
Figure 9.

Decreased maturation of Cav1.2KO/GFP OPCs in the remyelinating brain. A, Representative coronal sections of the cingulate cortex from control and Cav1.2KO/GFP mice immunostained for Olig2, CC1, and Sox2 at 2 weeks of recovery. Scale bar, 90 μm. B, Percentage of GFP/Sox2 and GFP/CC1 double-positive cells was stereologically quantified in the center of the corpus callosum (CC), cingulate cortex (CX), and striatum (ST) at 2 and 4 weeks of recovery. Comparisons between experimental groups were made by the unpaired t test. Data represent pooled results from at least six brains per experimental group and values are expressed as mean ± SEM. **p < 0.01, ***p < 0.001 versus control.
Figure 10.

Proliferation, survival, and morphological development of Cav1.2KO/GFP OPCs during remyelination. A, Representative coronal sections of the cingulate cortex (CX) from control and Cav1.2KO/GFP mice immunostained for GFP and caspase-3 at 2 weeks of recovery. Scale bar, 90 μm. B, Ratio of GFP/Ki67 and GFP/Casp3 double-positive cells was stereologically quantified in the central area of the corpus callosum (CC), subventricular zone (SVZ), and CX at 2 weeks of recovery. C, Representative coronal sections of the CX and striatum (ST) from control and Cav1.2KO/GFP mice immunostained for GFP at 4 weeks of recovery. Scale bar, 90 μm. D, Morphological examination of GFP-positive cells in several brain areas at 4 weeks of recovery. Comparisons between experimental groups were made by the unpaired t test. Data represent pooled results from at least six brains per experimental group and values are expressed as mean ± SEM. *p < 0.05, **p < 0.01, ***p < 0.001 versus control.
Discussion
L-VGCCs are required for OPC development during remyelination
We tested the hypothesis that L-type voltage-gated Ca2+ entry is crucial for OPC maturation and thus for the remyelination of the mouse brain. We used the Cre-lox system to delete specifically the L-type channel isoform Cav1.2 in NG2-positive OPCs in combination with the CPZ model of myelin injury and repair. CPZ intoxication has been a useful model with which to study demyelination and remyelination in vivo (Ludwin, 1978; Matsushima and Morell, 2001). One advantage of the model has been the relative selective damage to oligodendrocytes with minimal damage to other cell types in the CNS (Komoly et al., 1987; Cammer and Zhang, 1993). CPZ causes demyelination of the corpus callosum, cerebral cortices, and striatum (Koutsoudaki et al., 2009; Norkute et al., 2009; see Groebe et al., 2009). When administration of CPZ is terminated, almost complete remyelination takes place in a matter of weeks (Ludwin, 1994; Armstrong et al., 2002). To induce Cre activity in NG2-positive OPCs, different protocols of tamoxifen administration were assessed. These protocols were designed to target OPCs at the end of the CPZ treatment and during the remyelination process. The clearest results were found when the L-type Ca2+ channel was deleted in OPCs during the last week of the CPZ treatment and the first week of recovery. This is likely explained by the large number of NG2-positive OPCs present in the brain at the end of the demyelination phase of the CPZ model. In a previous work, we have shown that the number of NG2-positive OPCs in the corpus callosum peaks after 5 weeks of CPZ intoxication (Paez et al., 2012), so injecting tamoxifen at the end of the CPZ treatment is probably the most efficient way to target remyelinating OPCs.
We found that myelin regeneration was delayed significantly when the Cav1.2 Ca2+ channel was ablated in NG2-positive cells. This inefficient remyelination was seen throughout the entire recovery process and was very evident even after 6 weeks of recovery, suggesting that the delayed remyelination of the Cav1.2KO mouse is persistent in time. These results were confirmed by immunohistochemistry and Western blot experiments for myelin proteins isolated from different brain areas and by electron microscopy of the corpus callosum, in which we found a significant reduction in the percentage of myelinated axons and a decrease in the myelin thickness of the Cav1.2KO mice compared with controls. The remyelination deficit of the Cav1.2KO mouse was more evident in the cortex and striatum than in the corpus callosum and the most affected myelin proteins were MBP and PLP.
Furthermore, the population of mature myelination oligodendrocytes was reduced in several areas of the Cav1.2 conditional KO brain. The proportion of Olig2/CC1 double-positive cells and the total number of CC1-positive oligodendrocytes was reduced in the Cav1.2KO mice during the complete remyelination process. These data were confirmed in a triple-transgenic mouse in which we found a reduction in the percentage of GFP-positive cells that were also positive for the mature marker CC1. This decreased number of mature oligodendrocytes and the reduction in the density of Olig2-positive cells is likely explained by a substantial decline in the proliferation of Cav1.2KO OPCs. We found a clear reduction in the total number of proliferating OPCs (Olig2/Ki67) and in the density of early OPCs (Olig2/Sox2). Therefore, we believe that the absence of L-VGCC in OPCs affects the expansion of this pool of progenitors significantly, which is an essential prerequisite for effective remyelination of the brain. However, data from the triple-transgenic mouse in which the recombinant cells were tracked with a Cre reporter indicated that the maturation of Cav1.2KO OPCs was also significantly disturbed. We have found that less mature oligodendrocytes are generated from Cav1.2KO/GFP OPCs than from control cells during the remyelination of the brain. Suggesting a slower maturational rate, the percentage of GFP/CC1 double-positive cells was reduced and the fraction of GFP/Sox2-expressing cells was increased in Cav1.2KO mice. It is important to point out that the diminished numbers of Olig2/Sox2 OPCs and the enlarged fraction of GFP/Sox2-positive cells in the Cav1.2KO brain are not contradictory results because the latter is reflecting the lower maturational speed of a reduced OPC population. Altogether, our results indicate that L-VGCCs are essential for OPC division and maturation after acute demyelination. Removing these channels from NG2-positive progenitors affects the efficiency of the remyelination process significantly and, as a consequence, the restoration of normal levels of myelin in the CNS.
NG2-positive OPCs require functional L-VGCCs to remyelinate the adult brain
NG2-positive cells comprise a widely distributed and dynamic population of precursor cells that remain abundant in the adult brain. These cells represent ∼8% of all cells in the CNS (Dawson et al., 2003), have the ability to mature into oligodendrocytes, and are critical in providing new oligodendrocytes to allow remyelination of axons after injury and in diseases such as multiple sclerosis. It has been proposed that neural network activity and neurotransmission may promote the proliferation and differentiation of NG2-positive OPCs along the oligodendrocyte lineage. For instance, GABAB receptor activation has been shown specifically to increase the proliferation of cultured OPCs (Luyt et al., 2007). Moreover, the vesicular release of glutamate by neurons has been shown to favor the terminal differentiation of cultured OPCs into myelinating oligodendrocytes (Wake et al., 2011). Likewise, OPCs derived from the subventricular zone and recruited to the corpus callosum after a demyelinating injury receive transient glutamatergic inputs from neurons and these inputs have been hypothesized to promote their differentiation into myelinating oligodendrocytes (Etxeberria et al., 2010). Conversely, loss of GABAergic synaptic input in response to hypoxia has been shown to decrease the differentiation of OPCs in vivo (Zonouzi et al., 2015). Independent of neurotransmission, electrical activity in neurons appears to promote OPC proliferation, differentiation of OPCs, and myelin production in both cell cultures and in vivo (Barres and Raff, 1993; Demerens et al., 1996; Li et al., 2010; Gibson et al., 2014; Hines et al., 2015).
Calcium signaling is involved in many cellular processes, including the production of transcription factors responsible for cellular differentiation (Kirischuk et al., 1995; Bakiri et al., 2009; Vélez-Fort et al., 2012). It has been shown that glutamate and GABAA receptor activation increase the concentration of intracellular Ca2+ by opening voltage-gated Ca2+ channels in NG2-positive OPCs (Kirchhoff and Kettenmann, 1992; Kirischuk et al., 1995; Bernstein et al., 1996; Káradóttir and Attwell, 2007; Tanaka et al., 2009). Furthermore, NG2-positive OPCs perform linear integration of glutamatergic synaptic inputs and respond with increasing dendritic Ca2+ elevations (Sun et al., 2016). Synaptic activity induces rapid Ca2+ signals mediated by voltage-gated Ca2+ channels under inhibitory control of voltage-gated A-type K+ channels (Sun et al., 2016). Calcium signals can be global and originate throughout the cell. However, VGCCs were also found in dendrites of NG2-positive OPCs, where they act as compartmentalized processing units and generate local Ca2+ transients (Sun et al., 2016). Therefore, these data indicate that neurotransmitter activation of L-VGCCs in NG2-positive OPCs would favor the proliferation and the differentiation of OPCs into myelinating oligodendrocytes after demyelination.
Consistent with the results presented in this work, a significant upregulation of Cav1.2 Ca2+ channels in OPCs was found in the demyelinated corpus callosum (Paez et al., 2012). Specifically, after several weeks of demyelination induced by CPZ, there was a rise in cells double-positive for the Cav1.2 L-type channel and OPC markers such as NG2 and Sox9 (Paez et al., 2012). In addition, proliferating OPCs, which are most visible in the severely demyelinated areas, were found to express high levels of L-VGCCs. Furthermore, in situ Ca2+-imaging experiments in living slices from CPZ-treated animals demonstrated a significant increase in the activity of L-type channels in corpus callosum OPCs during a demyelination event, suggesting that L-type Ca2+ entry play a fundamental role in the induction and/or survival of newly generated OPCs after demyelination (Paez et al., 2012).
The release of neurotransmitter onto NG2 cells may be the key signal mediating activity-dependent myelination and instructing the cells about the need to generate more oligodendrocytes and myelin after demyelination (Wake et al., 2011; Hines et al., 2015; Mensch et al., 2015; Koudelka et al., 2016). Decoding how NG2 cells can integrate and process synaptic input is of fundamental importance for understanding brain development and for improving remyelination of damaged white matter. The activity-dependent control of Ca2+ signals and the global versus local signaling domains make L-type Ca2+ influx in OPCs a key signal to transform neurotransmitter release into activity-dependent myelination. Therefore, synaptic transmission from unmyelinated axons to OPCs mediated by L-VGCCs may play a central role in triggering NG2 responses to acute demyelination. In conclusion, our study shows for the first time that the activity of L-VGCCs in NG2-positive OPCs is essential for the normal remyelination of the mouse brain.
Note Added in Proof: The Significance Statement was accidentally not included in the Early Release version published September 12, 2017. The article text has now been corrected to include the Significance Statement.
Footnotes
This work was supported by the National Institute of Neurological Disorders and Stroke–National Institutes of Health (Grant 5R01NS078041) and the National Multiple Sclerosis Society (Grant RG4554-A-2). We thank Laura M. Feltri and Edward Hurley (Hunter James Kelly Research Institute at UB) and Ted Szczesny (Director of the electron microscopy laboratory, Department of Pathology and Anatomical Sciences, Jacobs School of Medicine and Biomedical Sciences at UB) for assistance with the electron microscopy experiments.
The authors declare no competing financial interests.
References
- Armstrong RC, Le TQ, Frost EE, Borke RC, Vana AC (2002) Absence of fibroblast growth factor 2 promotes oligodendroglial repopulation of demyelinated white matter. J Neurosci 22:8574–8585. [DOI] [PMC free article] [PubMed] [Google Scholar]
- Armstrong RC, Le TQ, Flint NC, Vana AC, Zhou YX (2006) Endogenous cell repair of chronic demyelination. J Neuropathol Exp Neurol 65:245–256. 10.1097/01.jnen.0000205142.08716.7e [DOI] [PMC free article] [PubMed] [Google Scholar]
- Bakiri Y, Attwell D, Káradóttir R (2009) Electrical signalling properties of oligodendrocyte precursor cells. Neuron Glia Biol 5:3–11. 10.1017/S1740925X09990202 [DOI] [PubMed] [Google Scholar]
- Barres BA, Raff MC (1993) Proliferation of oligodendrocyte precursor cells depends on electrical activity in axons. Nature 361:258–260. 10.1038/361258a0 [DOI] [PubMed] [Google Scholar]
- Bernstein M, Lyons SA, Möller T, Kettenmann H (1996) Receptor-mediated calcium signaling in glial cells from mouse corpus collosum slices. J Neurosci Res 46:152–163. 10.1002/(SICI)1097-4547(19961015)46:2%3C152::AID-JNR3%3E3.0.CO%3B2-G [DOI] [PubMed] [Google Scholar]
- Cammer W, Zhang H (1993) Atypical localization of the oligodendrocyticisoform (PI) of glutathion-S-transferase in astrocytes during cuprizone intoxication. J Neurosci Res 36:183–190. 10.1002/jnr.490360208 [DOI] [PubMed] [Google Scholar]
- Cheli VT, Santiago González DA, Spreuer V, Paez PM (2015) Voltage-gated Ca++ entry promotes oligodendrocyte progenitor cells maturation and myelination in vitro. Exp Neurol 265:69–83. 10.1016/j.expneurol.2014.12.012 [DOI] [PMC free article] [PubMed] [Google Scholar]
- Cheli VT, Santiago González DA, Namgyal Lama T, Spreuer V, Handley V, Murphy GG, Paez PM (2016) Conditional deletion of the L-type calcium channel Cav1.2 in oligodendrocyte progenitor cells affects postnatal myelination in mice. J Neurosci 36:10853–10869. 10.1523/JNEUROSCI.1770-16.2016 [DOI] [PMC free article] [PubMed] [Google Scholar]
- Dawson MR, Polito A, Levine JM, Reynolds R (2003) NG2-expressing glial progenitor cells: an abundant and widespread population of cycling cells in the adult rat CNS. Mol Cell Neurosci 24:476–488. 10.1016/S1044-7431(03)00210-0 [DOI] [PubMed] [Google Scholar]
- Demerens C, Stankoff B, Logak M, Anglade P, Allinquant B, Couraud F (1996) Induction of myelination in the central nervous system by electrical activity Proc Natl Acad Sci U S A 93:9887–9892. 10.1073/pnas.93.18.9887 [DOI] [PMC free article] [PubMed] [Google Scholar]
- Etxeberria A, Mangin JM, Aguirre A, Gallo V (2010) Adult-born SVZ progenitors receive transient synapses during remyelination in corpus callosum. Nat Neurosci 13:287–289. 10.1038/nn.2500 [DOI] [PMC free article] [PubMed] [Google Scholar]
- Franklin RJ. (2002) Why does remyelination fail in multiple sclerosis? Nat Rev Neurosci 3:705–714. 10.1038/nrn917 [DOI] [PubMed] [Google Scholar]
- Gibson EM, Purger D, Mount CW, Goldstein AK, Lin GL, Wood LS, Inema I, Miller SE, Bieri G, Zuchero JB, Barres BA, Woo PJ, Vogel H, Monje M (2014) Neuronal activity promotes oligodendrogenesis and adaptive myelination in the mammalian brain. Science 344:1252304. 10.1126/science.1252304 [DOI] [PMC free article] [PubMed] [Google Scholar]
- Groebe A, Clarner T, Baumgartner W, Dang J, Beyer C, Kipp M (2009) Cuprizone treatment induces distinct demyelination, astrocytosis, and microglia cell invasion or proliferation in the mouse cerebellum. Cerebellum 8:163–174. 10.1007/s12311-009-0099-3 [DOI] [PubMed] [Google Scholar]
- Haberlandt C, Derouiche A, Wyczynski A, Haseleu J, Pohle J, Karram K, Trotter J, Seifert G, Frotscher M, Steinhäuser C, Jabs R (2011) Gray matter NG2 cells display multiple Ca++-signaling pathways and highly motile processes. PLoS One 6:e17575. 10.1371/journal.pone.0017575 [DOI] [PMC free article] [PubMed] [Google Scholar]
- Hines JH, Ravanelli AM, Schwindt R, Scott EK, Appel B (2015) Neuronal activity biases axon selection for myelination in vivo. Nat Neurosci 18:683–689. 10.1038/nn.3992 [DOI] [PMC free article] [PubMed] [Google Scholar]
- Islam O, Gong X, Rose-John S, Heese K (2009) Interleukin-6 and neural stem cells: more than gliogenesis. Mol Biol Cell 20:188–199. 10.1091/mbc.E08-05-0463 [DOI] [PMC free article] [PubMed] [Google Scholar]
- Káradóttir R, Attwell D (2007) Neurotransmitter receptors in the life and death of oligodendrocytes. Neuroscience 145:1426–1438. 10.1016/j.neuroscience.2006.08.070 [DOI] [PMC free article] [PubMed] [Google Scholar]
- Kirchhoff F, Kettenmann H (1992) GABA triggers a [Ca++]i increase in murine precursor cells of the oligodendrocyte lineage. Eur J Neurosci 4:1049–1058. 10.1111/j.1460-9568.1992.tb00131.x [DOI] [PubMed] [Google Scholar]
- Kirischuk S, Scherer J, Möller T, Verkhratsky A, Kettenmann H (1995) Subcellular heterogeneity of voltage-gated Ca2+ channels in cells of the oligodendrocyte lineage. Glia 13:1–12. 10.1002/glia.440130102 [DOI] [PubMed] [Google Scholar]
- Komoly S, Jeyasingham MD, Pratt OE, Lantos PL (1987) Decrease inoligodendrocyte carbonic anhydrase activity preceding myelin degenerationin cuprizone induced demyelination. J Neurol Sci 79:141–148. 10.1016/0022-510X(87)90268-1 [DOI] [PubMed] [Google Scholar]
- Koudelka S, Voas MG, Almeida RG, Baraban M, Soetaert J, Meyer MP, Talbot WS, Lyons DA (2016) Individual neuronal subtypes exhibit diversity in CNS myelination mediated by synaptic vesicle release. Curr Biol 26:1447–1455. 10.1016/j.cub.2016.03.070 [DOI] [PMC free article] [PubMed] [Google Scholar]
- Koutsoudaki PN, Skripuletz T, Gudi V, Moharregh-Khiabani D, Hildebrandt H, Trebst C, Stangel M (2009) Demyelination of the hippocampus is prominent in the cuprizone model. Neurosci Lett 451:83–88. 10.1016/j.neulet.2008.11.058 [DOI] [PubMed] [Google Scholar]
- Li Q, Brus-Ramer M, Martin JH, McDonald JW (2010) Electrical stimulation of the medullary pyramid promotes proliferation and differentiation of oligodendrocyte progenitor cells in the corticospinal tract of the adult rat. Neurosci Lett 479:128–133. 10.1016/j.neulet.2010.05.043 [DOI] [PMC free article] [PubMed] [Google Scholar]
- Ludwin SK. (1978) Central nervous system demyelination and remyelination in the mouse: an ultrastructural study of cuprizone toxicity. Lab Invest 39:597–612. [PubMed] [Google Scholar]
- Ludwin SK. (1994) Central nervous system remyelination: studies in chronically damaged tissue. Ann Neurol 36:S143–S145. 10.1002/ana.410360735 [DOI] [PubMed] [Google Scholar]
- Luyt K, Slade TP, Dorward JJ, Durant CF, Wu Y, Shigemoto R, Mundell SJ, Váradi A, Molnár E (2007) Developing oligodendrocytes express functional GABA(B) receptors that stimulate cell proliferation and migration. J Neurochem 100:822–840. 10.1111/j.1471-4159.2006.04255.x [DOI] [PubMed] [Google Scholar]
- Matsushima GK, Morell P (2001) The neurotoxicant, cuprizone, as a model to study demyelination and remyelination in the central nervous system. Brain Pathol 11:107–116. [DOI] [PMC free article] [PubMed] [Google Scholar]
- Mensch S, Baraban M, Almeida R, Czopka T, Ausborn J, El Manira A, Lyons DA (2015) Synaptic vesicle release regulates myelin sheath number of individual oligodendrocytes in vivo. Nat Neurosci 18:628–630. 10.1038/nn.3991 [DOI] [PMC free article] [PubMed] [Google Scholar]
- Norkute A, Hieble A, Braun A, Johann S, Clarner T, Baumgartner W, Beyer C, Kipp M (2009) Cuprizone treatment induces demyelination and astrocytosis in the mouse hippocampus. J Neurosci Res 87:1343–1355. 10.1002/jnr.21946 [DOI] [PubMed] [Google Scholar]
- Paez PM, Spreuer V, Handley V, Feng JM, Campagnoni C, Campagnoni AT (2007) Increased expression of golli myelin basic proteins enhances calcium influx into oligodendroglial cells. J Neurosci 27:12690–12699. 10.1523/JNEUROSCI.2381-07.2007 [DOI] [PMC free article] [PubMed] [Google Scholar]
- Paez PM, Fulton DJ, Spreuer V, Handley V, Campagnoni CW, Macklin WB, Colwell C, Campagnoni AT (2009a) Golli myelin basic proteins regulate oligodendroglial progenitor cell migration through voltage-gated Ca++ influx. J Neurosci 29:6663–6676. 10.1523/JNEUROSCI.5806-08.2009 [DOI] [PMC free article] [PubMed] [Google Scholar]
- Paez PM, Fulton DJ, Spreur V, Handley V, Campagnoni CW, Campagnoni AT (2009b) Regulation of store-operated and voltage-operated Ca++ channels in the proliferation and death of oligodendrocyte precursor cells by Golli proteins. ASN Neuro 1: pii: e00003. 10.1042/AN20090003 [DOI] [PMC free article] [PubMed] [Google Scholar]
- Paez PM, Fulton DJ, Spreur V, Handley V, Campagnoni AT (2010) Multiple kinase pathways regulate voltage-dependent Ca++ influx and migration in oligodendrocyte precursor cells. J Neurosci 30:6422–6433. 10.1523/JNEUROSCI.5086-09.2010 [DOI] [PMC free article] [PubMed] [Google Scholar]
- Paez PM, Cheli VT, Ghiani CA, Spreuer V, Handley VW, Campagnoni AT (2012) Golli myelin basic proteins stimulate oligodendrocyte progenitor cell proliferation and differentiation in remyelinating adult mouse brain. Glia 60:1078–1093. 10.1002/glia.22336 [DOI] [PubMed] [Google Scholar]
- Sun W, Matthews EA, Nicolas V, Schoch S, Dietrich D (2016) NG2 glial cells integrate synaptic input in global and dendritic calcium signals. Elife 5: pii: e16262. 10.7554/eLife.16262 [DOI] [PMC free article] [PubMed] [Google Scholar]
- Tanaka Y, Tozuka Y, Takata T, Shimazu N, Matsumura N, Ohta A, Hisatsune T (2009) Excitatory GABAergic activation of cortical dividing glial cells. Cereb Cortex 19:2181–2195. 10.1093/cercor/bhn238 [DOI] [PubMed] [Google Scholar]
- Vélez-Fort M, Maldonado PP, Butt AM, Audinat E, Angulo MC (2010) Postnatal switch from synaptic to extrasynaptic transmission between interneurons and NG2 cells. J Neurosci 30:6921–6929. 10.1523/JNEUROSCI.0238-10.2010 [DOI] [PMC free article] [PubMed] [Google Scholar]
- Wake H, Lee PR, Fields RD (2011) Control of local protein synthesis and initial events in myelination by action potentials. Science 333:1647–1651. 10.1126/science.1206998 [DOI] [PMC free article] [PubMed] [Google Scholar]
- White JA, McKinney BC, John MC, Powers PA, Kamp TJ, Murphy GG (2008) Conditional forebrain deletion of the L-type calcium channel CaV1.2 disrupts remote spatial memories in mice. Learn Mem 15:1–5. 10.1101/lm.773208 [DOI] [PubMed] [Google Scholar]
- Zonouzi M, Scafidi J, Li P, McEllin B, Edwards J, Dupree JL, Harvey L, Sun D, Hübner CA, Cull-Candy SG, Farrant M, Gallo V (2015) GABAergic regulation of cerebellar NG2 cell development is altered in perinatal white matter injury. Nat Neurosci 18:674–682. 10.1038/nn.3990 [DOI] [PMC free article] [PubMed] [Google Scholar]