Abstract
Stable, relative localization of source and detection fibers is necessary for clinical implementation of quantitative optical perfusion monitoring methods such as diffuse correlation spectroscopy (DCS) and diffuse reflectance spectroscopy (DRS). A flexible and compact device design is presented as a platform for simultaneous monitoring of perfusion at a range of depths, enabled by precise location of optical fibers in a robust and secure adhesive patch. We will discuss preliminary data collected on human subjects in a lower body negative pressure model for hypovolemic shock. These data indicate that this method facilitates simple and stable simultaneous monitoring of perfusion at multiple depths and within multiple physiological compartments.
Keywords: Optical perfusion monitoring, noninvasive, diffuse correlation spectroscopy, DCS, diffuse reflectance spectroscopy, DRS, hemorrhagic shock
1. INTRODUCTION
A state of hemorrhagic shock is a severe physiological condition associated with significant intravascular fluid loss and decreased blood pressure. Hypovolemia, a lack of blood volume in the body, is a major factor causing hemorrhagic shock and can be initiated by motor vehicle accidents, trauma, battle injuries, internal bleeding, etc.1 80% of all trauma related deaths are caused by hemorrhage, and internal hemorrhage poses a significant challenge for clinicians and doctors to detect in medical environments.2 The body’s inability to perfuse blood can result in a variety of consequences, including but not limited to organ damage, cellular ischemia, hemodynamic instability and death. When a patient begins to hemorrhage, compensatory mechanisms, such as the shunting of blood from capillaries in the extremities, stabilize central venous pressure and cardiac output. Therefore, it is difficult to definitively assess the condition of hemorrhaging patients due to the relatively normal symptoms that appear during the body’s compensatory phase despite the impending rapid physiological decline.2,3 Once compensation is unfeasible, patients experience significant drops in both blood pressure and cardiac output, resulting in unconsciousness and possibly death. Accordingly, despite advanced central cardiac monitors, there is a dire unmet clinical need for a device to quantitatively predict early onset of hemorrhagic shock in an effort to mitigate the life-threatening damage associated with hypovolemia and hemorrhagic shock.4
RMD’s optical perfusion monitoring device relies on the use of diffuse correlation spectroscopy (DCS) to noninvasively measure peripheral blood flow, allowing for early predictions on a patients physiological state in a hemorrhaging situation. If a doctor or clinician is able to recognize the lack of peripheral blood flow in a patient, necessary actions can be taken in a prompt manner to inhibit or prevent hemorrhagic shock related damage. DCS is a proven research method for continuous perfusion monitoring over other types of shock monitors based on myocardial function, arterial catheters5 and gastric pH levels6,7 because of its sustainability and earlier detection time phase. Existing noninvasive perfusion monitoring devices are unable to monitor multiple physiologic compartments over many orders of magnitude of blood flow velocity. In order to facilitate a clinically viable multi-compartment monitoring system, we fabricated a flexible, disposable, robust skin probe to replace existing bulky and unstable devices. Our design provides an economic and noninvasive approach to monitor blood perfusion in a clinical environment and possesses the ability to improve patient outcomes.
2. MATERIALS AND METHODS
2.1 Skin Probe Fabrication
2.1.1 Preparation of epoxy base
Optical fibers were premeasured to be 1.5 meters long. Each probe requires one 105 μm core multimode fiber, two 200 μm core multimode fibers, and four 4 μm core single mode fibers (7 total). A schematic of fiber placement is reflected in Figure 1.
Figure 1.
Fiber spacing arrangement. (1) 0 mm 200 μm core multimode (2) 1 mm 5 μm core single mode (3) 2mm 5 μm core single mode (4) 5mm 5 μm core single mode (5) 10 mm 5 μm core single mode (6) 1 mm below (1) 105 μm core multimode (7) 1 mm from (6) 200 μm core multimode
Delivery fibers (LFG200LEA, Thorlabs, NJ) were stripped at 1cm, as were single mode DCS collection fibers (780HP, Thorlabs, NJ) and 105 μm multimode DCS spectrometer collection fibers (FG105UCA, Thorlabs, NJ). In order to realize repeatable placement of the fiber ends, a placement guide was constructed with perforations for delivery and collection fibers. A 3 mm thick black-tinted 7.5% Sylgard 186 polydimethylsiloxane (PDMS, Amazon, WA) layer was placed on top of a slightly larger acrylate slab. This PDMS buffer layer allowed the stripped fibers to pierce through the PDMS by using the fiber placement guide and therefore held in place firmly enough while also allowing easy removal once necessary. A Teflon mold was placed atop the PDMS with a rectangular opening of 5mm x 15mm x 7mm to accommodate the fibers. The fibers were then pre-bent at their maximum bend radius (determined by an 80% cutoff in throughput) of roughly 6 mm. Preheated Loctite 9460 Hysol Epoxy (McMaster-Carr, NJ) was poured into the mold at depths of 3–10 mm and allowed to cure overnight.
Once cured, the hardened epoxy blocks were removed from the Teflon mold as the fibers were removed from the PDMS buffer with care to not break the exposed fibers protruding into the PDMS slab. The fibers were cleaved within 500 μm of the block using a sapphire scribe. The assembly was then polished on a series of fiber optic abrasive polishing sheets to a final polish grit of 1 μm. For quality control measures, the fibers were checked for cracks or possible damage at this point by cleaving the free ends and passing light through to the bottom of the epoxy block. Visible light at the bottom reflected an intact fiber.
2.1.2 Polydimethylsiloxane casting
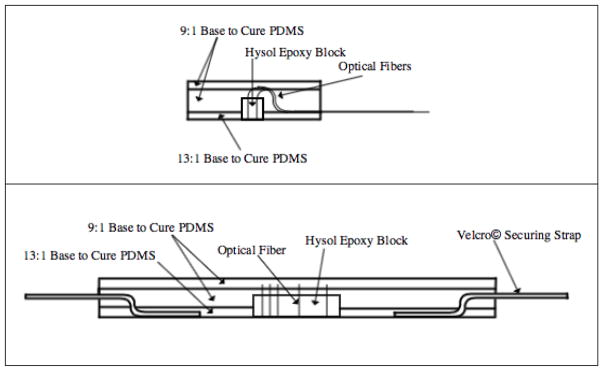
The probe was developed by casting a series of layers of PDMS at various concentrations around the epoxy-encased fiber assembly. The PDMS was prepared by mixing the base and curing agent in the desired concentration and adding both Smooth-on silicone thinner (Reynolds Advanced Materials, MA) for decreased viscosity and Silc Pig black silicone pigment (Reynolds Advanced Materials, MA) for decreased light leakage. Once all components were added, the PDMS mixture was degassed in a vacuum chamber for approximately 30 minutes. A two-piece Velcro strap was weighted to the bottom of the casting dish, one positive side one negative side both face up, and the polished epoxy block was also weighted in the center of the two Velcro pieces. The first PDMS layer was 7.5% hardener (13:1 base to cure ratio), which created a reusable adhesive bottom surface to directly contact and adhere to the skin. Once cured, the fibers were threaded through black furcation tubing (FT030-BK, Thorlabs, NJ) and tacked down in a bend not to exceed 5mm bend radius, which acted to prevent light leakage. While held in the bend, 10% PDMS was poured over the area to encase the bent fibers within. Finally, a third layer of 10% PDMS was poured after the second layer fully cured to create a smooth, aesthetically pleasing surface. Once the final layer completely cured, the patch was cut out of the petri dish using a heated, sharp X-Acto knife to ensure smooth edges and corners and the fiber ends were terminated with connectors (10125A, 10127A, and 30126C3, Thorlabs, NJ) to enable functional fiber alignment in the correlation box. Side views of the layered probe are shown in Figure 2.
Figure 2.
(Top) Side view of fabricated probe showing bent fibers not exceeding 6mm bend radius exiting the silicone. (Bottom) Side view of fabricated probe showing layering of PDMS around Hysol epoxy block and Velcro© securing straps.
2.3 Lower body negative pressure (LBNP) as model for hemorrhage
Hypovolemic shock can be modeled with a lower body negative pressure (LBNP) experimentation method, which provides orthostatic stress on the cardiovascular system in a controlled and measurable process.8 In such procedures, an individual is placed inside an LBNP chamber while lying in a recumbent position and the chamber forms a vacuum seal around the lower abdomen to encompass the lower thoracic cavity and the limbs. The chamber seals around the iliac crest of the individual, and provides pressure lower than atmospheric in an effort to draw blood flow to the lower extremities and away from the thoracic cavity. The protocol used in this experiment is shown in Figure 3.
Figure 3.
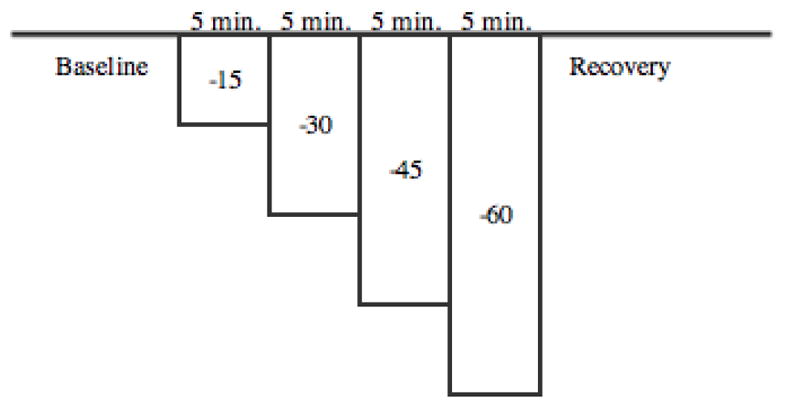
LBNP protocol for patients sealed in chamber. All negative pressures are in mmHg.
When such negative pressure causes blood to move in this direction, the body compensates for the disturbance by decreasing peripheral blood perfusion to continue blood flow throughout the body in a physiological compensation also known as vasoconstriction, identical to mechanisms of compensation for hypovolemia8. When optical perfusion monitoring devices are attached to patients in a LBNP chamber, measurements can be made on peripheral blood perfusion in the modeled hemorrhagic shock environment. This study attached the fabricated monitoring probes on the forearm, ear lobe and forehead, and data was collected at each of these locations using diffuse correlation spectroscopy (DCS).3 Data collection using LBNP warrants a wide variety of results, due to the variability of patients. Factors that affect data collection include body size, physical condition, exercise habits, leg size, gender and age.9 We utilized LBNP experiments to measure microcirculation as an indicator of shock, however it is well known that microcirculation and macrocirculation should both be monitored because they may decouple during the progression towards shock.10
2.3 Diffuse Correlation Spectroscopy
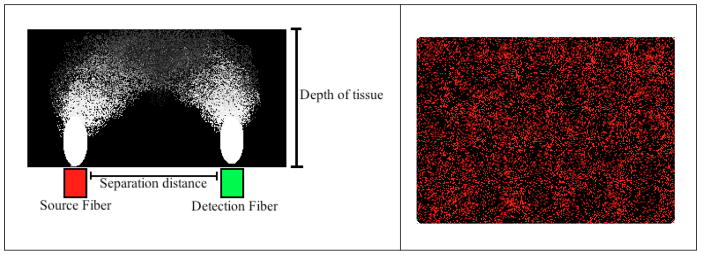
The development of a disposable, flexible skin probe holds potential to be utilized clinically in partnership with diffuse correlation spectroscopy (DCS) technology to enable a quantitative, noninvasive blood perfusion monitoring technique. DCS technology is dependent on the speckle pattern created by photon scattering as light penetrates tissue or other media types. The speckle pattern of light scatter is constant in the absence of blood flow due to coherent laser light being reflected off the skin surface and no red blood cell movement.11,12 When blood flow is present, red blood cells affect the speckle pattern due to their contribution to light scatter in a time dependent manner. Red blood cell movement creates time oscillations that are detected and measured using DCS.11,13 A time-dependent signal correlation can be calculated from such measurements and the resulting autocorrelation function is representative of the average correlation between two speckle patterns separated by a constant time interval.12 The random light scattering as a depth resolving probability density function can be visualized as a “banana” pattern, caused by the distribution of the source fiber and the detection fiber at certain distances, as shown in Figure 4. As a result, light can distribute and reach the detection point from multiple depths, with a high probability of the fiber spacing being predictive of interrogation depth.14
Figure 4.
(Left) Light scatter distribution forms a “banana” shape that varies with the separation distance between source and detector as well as tissue depth. (Right) Visual representation of laser speckle and light scatter.
According to the DCS work pioneered by Boas and Yodh in 1997, the normalized sequential intensity field correlation function of light that has scattered a path length and trajectory through a highly scattering system is given by:
| (1) |
which can then be related to the power spectrum of the detected intensity S(ω) through the function:
| (2) |
where <I> is the average light intensity.12
The average of the correlation can be performed by fitting the data to an exponential decay function, allowing the time constant, tau, to be determined analytically from the exponential fit with a weighted average of the fit. A triple exponential fit as used in our experiments and data analysis is given by: 15,16
| (3) |
where g(τ) is the correlation, g0(τ) is the offset of the constant, An is determined by the amount of decay due to each time constant t, and τ is the time constant lag time.13
A DCS monitor developed at RMD was used to collect data using the developed flexible skin probe. The RMD Perfusion Monitor is a two-channel DCS system with diffuse reflectance spectroscopy capabilities integrated into the device. A single box contains the hardware for the monitor which includes FC and SMA fiber connection ports to accommodate both source and detection fibers. Eight-channel DCS/DRS systems are also available on a larger scale.17
3 RESULTS AND DISCUSSION
The development of a new optical perfusion monitoring device provides a flexible and robust improvement to the prior “pen” shaped device. The silicone casting method allows flexibility in the probe and enables conformity on each patient is it used on. The Velcro securing strap also provides a stable and secure attachment to the body for precise data collection. The strap is adjustable to account for varying patient size, and also can be used on the forehead, forearm and leg due to its adjustment capabilities. Doctors and clinicians using such devices will not be required to hold the device in place, as necessary in existing models, and this will allow more precise data collection and improved diagnosis capabilities of patients at risk of entering a state of hemorrhagic shock.
Four male volunteers were measured according the LBNP protocol at the Mayo Clinic (Rochester, MN) on November 9 and 10, 2015. DCS data was collected in 10 second intervals on each patient and Origin 2015 software was used to calculate the decay constant of each interval using an exponential fit model. Origin’s data batch processing was used for automatic data analysis, and the collected data were fit with a three exponential model to account for blood flow factors. The source and detection distance was adjusted on each patient until the rate of data collection was larger than 20kHz, which provided a visible signal-noise ratio. Each patient was fitted in the LBNP chamber, and submitted to 5 minutes at 0 negative pressure, followed by −15, −30, −45 and −60 mmHg for 5 minutes at each pressure change. The patients were permitted to halt the procedure at any time if uncomfortable with the LBNP. All measurements were made by using the developed flexible silicon optical perfusion monitoring device.
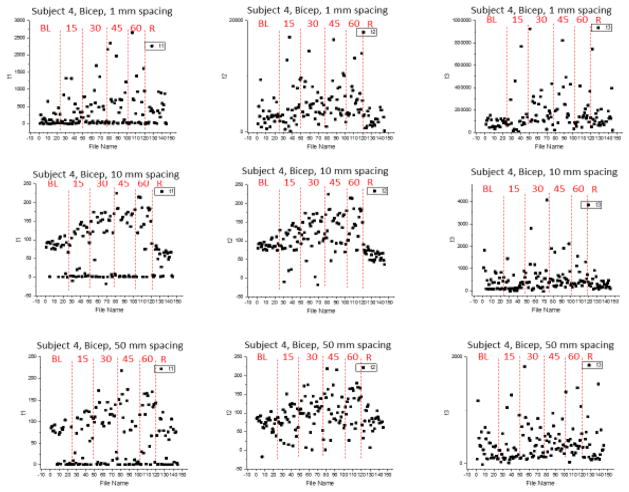
The data collected from Subject 4 reveal the inverse relationship between blood flow and LBNP with a decay constant plotted against time (see Figure 6). The largest decrease in capillary blood flow occurs around −60 mmHg, and then levels out once recovery mode is enabled by returning the patient to 0 mmHg. This data was collected at 1mm tissue depth with the flexible silicone probe, which is able to simultaneously monitor at multiple depths within the same monitoring period. Further demonstration of the probes ability to monitor at multipe depths is shown in Figure 7 below.
Figure 6.
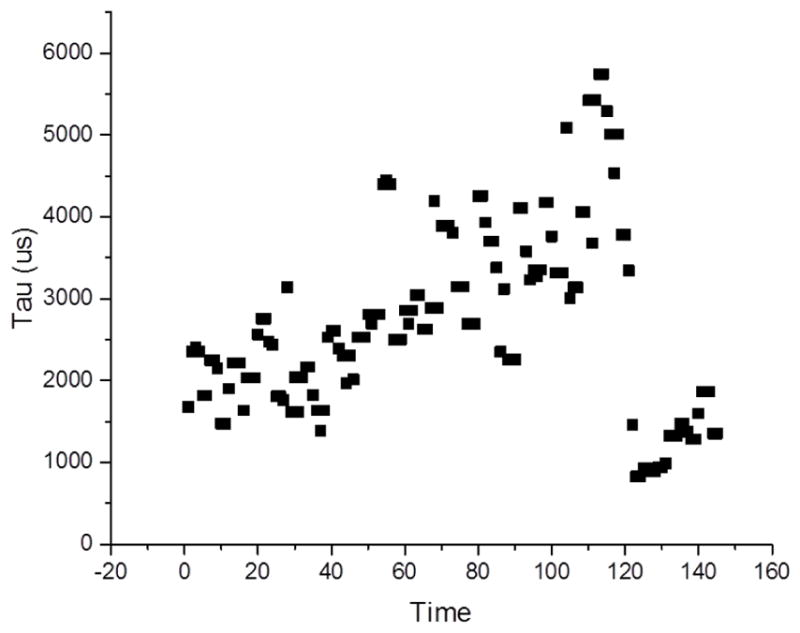
Second tau component of a three exponential fit to the correlation data from LBNP studies taken at 1mm depth on bicep of Subject 4.
Figure 7.
Three-exponential fit components fit to the correlation data from LBNP studies taken at 1, 10, and 50 mm depth on bicep of Subject 4. Each plot is divided into regions of baseline (BL), 15, 30, 45, and 600 mm Hg LBNP pressure, as well as a recovery phoase. There is remarkable general agreement on the trend in tau lengthening as the absolute value of LBNP pressure increases.
The measurements taken on Subject 4 reveal the consistency in data collection using the flexible silicone monitoring probe. As displayed in the plots, as LBNP pressure increases, peripheral blood flow is seen to decrease and therefore increases the time constant tau when fit with a three-exponential fit correlation. The probe is confirmed to have stability through these measurements due to their agreement and conformity after multiple data collection periods. These data also confirm the ability of the probe to simultaneously monitor at multiple depths, ranging from 1 mm to 50 mm in tissue depth, which is crucial for a complete diagnosis of a patients state in an at-risk of hemorrhaging situation.
4. CONCLUSIONS
Non-invasive monitoring of micro vascular perfusion is enabled by design of robust optical probes. The fabrication of flexible silicone devices allows for stability during measurement and a wide range of usability due to the adjustable nature of the strap and conformity of the probe itself. The developed device has shown to effectively monitor patients at multiple depths, which supports its wide range capabilities in a clinical environment. The flexible device is critical to doctors and clinicians in a medical setting because it allows a reliable and precise monitoring method for patients at risk of hemorrhaging in a timely manner. This is a crucial development to be used in the medical field, because of the importance of detecting hemorrhaging symptoms on patients in an earlier time phase to prevent the rapid decline that occurs once the body is unable to compensate for hypovolemia any further. Thus we find that flexible silicone adhesive sensing probes are well suited to clinical monitoring of blood flow at multiple depths.
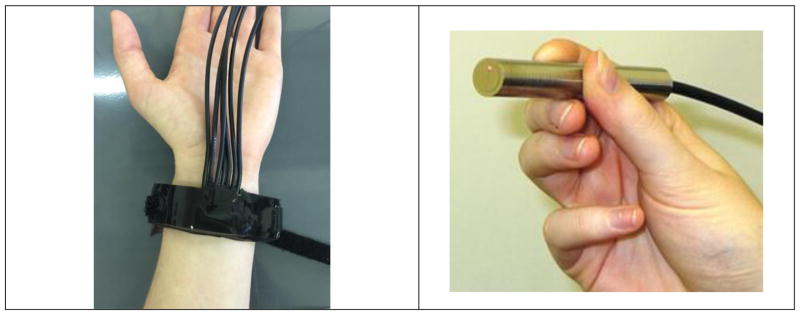
Figure 5.
Visual representation of probe types. (Left) New developed flexible, robust silicone optical perfusion monitoring probe with securing strap. (Right) Existing optical perfusion monitoring “pen” shaped probe with limited stability. Image taken from “Non-invasive monitoring of vascularization of grafted engineered human oral musoca” 10
Acknowledgments
We would like to thank and acknowledge National Institute of Health for providing financial support for this work through SBIR contract 2R44HL106851, and the Oral Maxillofacial Surgery Foundation and Mayo Clinic.
References
- 1.Gutierrez G, Reines DH, Wulf-Gutierrez ME. Clinical Review: Hemorrhagic Shock. BioMed Central: Critical Care. 2004;8:373–381. doi: 10.1186/cc2851. [DOI] [PMC free article] [PubMed] [Google Scholar]
- 2.Kauvar DS, Lefering R, Wade CE. Impact of hemorrhage on trauma outcome: overview of epidemiology, clinical presentations, and therapeutic considerations. J Trauma. 2006;60:S3–11. doi: 10.1097/01.ta.0000199961.02677.19. [DOI] [PubMed] [Google Scholar]
- 3.Joyner MJ. Orthostatic stress, hemorrhage and a bankrupt cardiovascular system. J Physiol. 2009;21:5015–5016. doi: 10.1113/jphysiol.2009.181495. [DOI] [PMC free article] [PubMed] [Google Scholar]
- 4.Gurjar R, Riccarsi SL, Johnson BD, Johnson CP, Paradis NA, Joyner MJ, Wolf DE. Point-of-care Optical Tool to Detect Early Stage of Hemorrhage and Shock. Proc SPIE. 2014:8951. [Google Scholar]
- 5.McDonough KH, Giaimo M, Quinn M, Miller H. Intrinsic myocardial function in hemorrhagic shock. J Physiol. 1999;11(3):205–10. doi: 10.1097/00024382-199903000-00009. [DOI] [PubMed] [Google Scholar]
- 6.Convertino VA, Moulton SL, Grudic GZ, Rickards CA, Hinojosa-Laborde C, Ryan KL. Use of advanced machine learning techniques for non-invasive monitoring of hemorrhage. J Trauma. 2011;71(1):S25–32. doi: 10.1097/TA.0b013e3182211601. [DOI] [PubMed] [Google Scholar]
- 7.Ednan K, Bajwa A, Malhotra B, Taylor T. Methods of monitoring shock. Semin Respir Crit Care Med. 2004;25(6):629–644. doi: 10.1055/s-2004-860986. [DOI] [PMC free article] [PubMed] [Google Scholar]
- 8.Cooke WH, Ryan KL, Convertino VA. Lower body negative pressure as a model to study progression to acute hemorrhagic shock in humans. J Appl Physiol. 2004;96:1249–1261. doi: 10.1152/japplphysiol.01155.2003. [DOI] [PubMed] [Google Scholar]
- 9.Janak JC, Howard JT, Goei KA, Weber R, Muniz GW, Hinojosa-Laborde C, Convertino VA. Predictors of the onset of hemodynamic decompensation during progressive central hypovolemia: Comparison of the peripheral perfusion index, pulse pressure variability, and compensatory reserve index. General and Internal Medicine. 2015;44(6):54–553. doi: 10.1097/SHK.0000000000000480. [DOI] [PubMed] [Google Scholar]
- 10.Lima A, Bommel JV, Sikorska K, Genderen MV, Klijn E, Lesaffre E, Ince C, Bakker J. The relation of near-infrared spectroscopy with changes in peripheral circulation in critically ill patients. Crit Care Med. 2011;39(7):1649–1654. doi: 10.1097/CCM.0b013e3182186675. [DOI] [PubMed] [Google Scholar]
- 11.Wolf DE, Seetamraju M, Gurjar RS, Kuo S. Non-invasive monitoring of vascularization of grafted engineered human oral mucosa. Proc SPIE. 2012:822. [Google Scholar]
- 12.Durduran T, Choe R, Baker WB, Yodh AG. Diffuse optics for tissue monitoring and tomography. Rep Prog Phys. 2010;73:076701, 43. doi: 10.1088/0034-4885/73/7/076701. [DOI] [PMC free article] [PubMed] [Google Scholar]
- 13.Wang Lihong, Hsin-i . Biomedical Optics: Principles and Imaging. Wiley Interscience; 2007. [Google Scholar]
- 14.Boas DA, Yodh AG. Spatially varying dynamical properties of turbid media probed with diffusing temporal light correlation. J Opt Soc Amer. 1997;14(1):192–215. [Google Scholar]
- 15.McAdams D, Kolodziejski NJ, Stapels CJ, Fernandez DE, Podolsky MJ, Farkas D, Christian JF, Joyner MJ, Johnson CP, Paradis NA. Instrument to detect syncope and the onset of shock. Optical Diagnostics and Sensing XVI: Toward Point-of-Care Diagnostics; San Francisco. 2016. [DOI] [PMC free article] [PubMed] [Google Scholar]
- 16.Yu G, Durduran T, Zhou C, Cheng R, Yodh AG. Near-Infrared Diffuse Correlation Spectroscopy for Assessment of Tissue Blood Flow. In: Boas DA, Pitris C, Ramanujam N, editors. Handbook of Biomedical Optics. CRC Press; 2011. pp. 195–216. [Google Scholar]
- 17.Kolodziejski NJ, Stapels CJ, McAdams DR, Fernandez DE, Podolsky ME, Farkas D, Christian JF, Ward BB, Vartarian M, Feinberg SE, Lee SY, Parikh U, Mycek MA. A compact instrument to measure perfusion of vasculature in transplanted maxillofacial free flaps. Optical Diagnostics and Sensing XVI: Toward Point-of-Care Diagnostics; San Francisco. 2016. [DOI] [PMC free article] [PubMed] [Google Scholar]


