

Abstract
Humans routinely use past experience with complexity to deal with novel, challenging circumstances. This fundamental aspect of real-world behavior has received surprisingly little attention in animal studies, and the underlying brain mechanisms are unknown. The present experiments tested for transfer from past experience in rats and then used quantitative imaging to localize synaptic modifications in hippocampus. Six daily exposures to an enriched environment (EE) caused a marked enhancement of short- and long-term memory encoded during a 30-min session in a different and complex environment relative to rats given extensive handling or access to running wheels. Relatedly, the EE animals investigated the novel environment in a different manner than the other groups, suggesting transfer of exploration strategies acquired in earlier interactions with complexity. This effect was not associated with changes in the number or size of excitatory synapses in hippocampus. Maps of synapses expressing a marker for long-term potentiation indicated that encoding in the EE group, relative to control animals, was concentrated in hippocampal field CA1. Importantly, <1% of the total population of synapses was involved in production of the regional map. These results constitute the first evidence that the transfer of experience profoundly affects the manner in which hippocampus encodes complex information.
Transfer of learning is the capacity to effectively use abilities or information acquired in previous contexts in a new situation (Baldwin and Ford 1988; Perkins and Salomon 1992; Pan and Yang 2010). Importantly, learning and behavior in both the original and the new context may be self-directed, or may involve external guidance to varying degrees. Learning of the former type—without external instruction, supervision, or reinforcement—is of particular interest and has been investigated in cognitive psychology (Fisher et al. 1991), education (Kolb 2015), perception and inference (Barlow 1989, 1990), and machine learning (Hastie et al. 2009). It is widely recognized that the transfer of knowledge or strategies gained during learning to new situations is essential for the efficacy and flexibility of human behavior, particularly in unsupervised contexts. Despite this, there has been little work on whether and to what degree the effect occurs in laboratory animals. The present work used a combination of unsupervised experience with a complex environment followed by exposure to novel conditions to address this question. The results enabled a first investigation into how transfer affects the manner in which the hippocampus, a structure critical to unsupervised learning, encodes new information.
We began with a straightforward extension of a well-known phenomenon: the reduction of spontaneous locomotor activity over time by rats in a novel open field. While open-field testing was originally introduced (Hall and Ballachey 1932) to measure emotionality, it became widely used as a simple test for memory involving the speed at which well-handled rodents become familiar with a new environment (Walsh and Cummins 1976). Traditionally termed “habituation,” this behavior serves as a simple example of unsupervised experiential learning. Here we extend this simple paradigm to a complex novel environment including internal barriers, passageways, local objects, and distant visual cues. Prior work (Eilam and Golani 1989) demonstrated that rats in open fields spontaneously choose a “home base” location from which they make exploratory forays and to which they tend to return at a higher rate of speed; based on this and to ameliorate the aversive component of open-field testing (Archer 1973; Stanford 2007) we provided a small, dark, enclosed “refuge” to serve as an ethologically relevant home base candidate attached to the complex environment. Exploration in the complex arena was thus voluntary (Genaro and Schmidek 2000; Whishaw et al. 2006). Three groups of rats were used to test if past experience with complexity improves learning and transfers search strategies. These included rats receiving: (1) six daily 5-h exposures to an enriched environment (EE group); (2) an equivalent period of free access to exercise in the form of wheel running (WR group); (3) twice daily episodes of standard handling (SH group) (Fig. 1). Rats were then given two 30-min sessions of free exploration in the novel complex environment, separated by 24 h.
Figure 1.

Pretreatments and behavioral testing. (A) Illustration of standard handling procedure at rat home cage. (B) Wheel-running bins. (C) The enriched environment, ∼40× the volume of a standard rat home cage, included internal complexity with different levels and objects. (D) Schedule of pretreatments and behavioral tests by days (d). (E) Diagram of complex unsupervised learning arena (USL), showing four rooms, passageways, four distinct objects, and attached refuge. Each room may be accessed by at least three different routes. (F) Overhead camera view, with rat entering the arena; the rat is visible within the refuge only to the infrared-equipped camera. (G) Representative 30-m trajectory, with the rat's first foray made into the complex arena shown in red.
The neurobiological substrates for transfer from past experience to current conditions have largely been a matter of conjecture. One widely discussed proposal holds that earlier experience leads to the construction of hippocampal–cortical networks that promote subsequent encoding (Squire and Alvarez 1995; Frankland and Bontempi 2005; Wang and Morris 2010; Tse et al. 2011). Such networks could in principle be modified by either or both the strengthening of existing synapses, or the growth of dendrites and synaptogenesis (Maviel et al. 2004; Restivo et al. 2009; Lesburgueres et al. 2011). Indeed, prolonged exposure to an enriched environment leads to the growth of dendritic branches and spines in hippocampus and cortex in rodents (Globus et al. 1973; Greenough et al. 1973; Lauterborn et al. 2015) along with improved performance in a variety of rewarded learning tasks (Renner and Rosenzweig 1987; Kolb and Whishaw 1998; van Praag et al. 2000; Kolb et al. 2003; Leggio et al. 2005). However, the immense capacity of memory presents difficulties for the latter hypothesis: experiential learning in complex circumstances is a routine event in humans and animals outside the laboratory and it seems likely that growth would quickly encounter limits. We investigated this question by conducting a high resolution analysis involving reconstructions of hundreds of thousands of synapses from multiple hippocampal dendritic fields in rats that were or were not given enrichment.
An alternative to the growth hypothesis is that activity-dependent modifications to existing synapses such as long-term potentiation (LTP) are used to encode effective acquisition strategies and relevant domain information during the enrichment period, and that these modifications are sufficiently flexible to be applied in novel circumstances. In support of this possibility, modeling of hippocampal networks using empirically derived LTP induction rules, which involve no new growth, demonstrated memory capacity scales linearly with neuron number (Granger et al. 1994) and thus provides good evidence for sufficient capacity in mammalian brains. A related question is “how” previously acquired strategies facilitate subsequent encoding. In the present case, transferred search patterns or exploratory behaviors could allow enriched rats to more effectively (quickly and/or robustly) learn the many and diverse features of the new complex environment. This would be expected to produce greater evidence for LTP in hippocampal–cortical and intrahippocampal networks. The present studies constitute a first test of the prediction that past experience with complexity increases the number of hippocampal synapses expressing a synaptic marker of LTP after exploration in a different complex context. Results confirmed this prediction, but with a surprisingly limited regional distribution.
Results
Effects of enrichment on unsupervised learning
Short-term memory
The inclusion of the small, dark, enclosed, and empty chamber (“refuge”) to serve as an ethologically relevant home base attached to the complex environment led all three groups of rats (standard handling: SH; enriched environment: EE; wheel running: WR) to divide their behavior into distinct exploratory episodes, here called “forays,” into the complex arena, punctuated by stays of varying duration within the refuge. Exploration within the refuge as measured by distance traveled began at a high level, progressively and sharply decreased during the first 15 min of the session, and changed little afterwards for all groups (Fig. 2A). It thus appears that past experience had relatively little effect on rapid habituation in this simple portion of the apparatus.
Figure 2.

Enriched environment exposure accelerated habituation in the complex arena: short- and long-term memory. (A–D) Measures for the first session; (E–H) changes in the second session 24 h later. (A) Distance traveled in the refuge during the first session is shown in six 5-min time intervals: all groups showed robust habituation in this simple environment. (B) Total distance traveled in the complex arena during the first session was greater for SH rats than for other groups. (C) Plots of distance traveled in 5-min time intervals in the arena on the first session show an effectively flat habituation curve for SH rats; WR rats display some habituation, and EE rats exhibit a much steeper habituation curve than the other groups. (D) Slopes of curves in C show the rate of habituation is greater for EE than SH or WR rats. (E) The change from days 1 to 2 in the total distance traveled in the arena was greatest for EE rats although the difference among groups was not significant. (F) SH rats showed a slightly steeper habituation curve on session 2. (G) The EE group curve for the second day showed a steep drop from the first to the second time bin, thus shifting the entire curve downwards relative to the first day. (H) WR group curves did not change between test days. (***) P < 0.001.
In the complex arena, SH rats conducted more exploration as measured by total distance traveled over the entire 30 min (110.0 ± 4.6 m) when compared with EE (77.4 ± 4.1 m) or WR (75.4 ± 3.9 m) rats (Fig. 2B) (F(2,86) = 21.3, P < 0.0001; SH versus EE or WR P < 0.0001 Tukey HSD). Yet SH animals exhibited no significant decrease in exploration of the arena over the course of the session (unlike their behavior in the refuge), showing a flat, nonsignificant habituation curve (r2= 0.11, P = 0.5); the WR group showed a moderate degree of habituation (r2= 0.8, P < 0.01) while the habituation curve for the EE group (r2= 0.97, P = 0.0001) was steeper and much more pronounced (Fig. 2C). Group differences in slopes of the habituation curves were highly significant (F(2,86) = 26, P < 0.0001; EE versus SH and EE versus WR P < 0.001 Tukey HSD), with the EE group's curve being much steeper than those of SH or WR rats (Fig. 2D). We conclude from these results that past experience with complexity enables rapid learning of a new, high choice environment.
Long-term memory
Despite extensive exploration of the arena on day one, total distance traveled by SH rats was only slightly reduced (<10%; t(30) = 1.8, P = 0.08) in a second session conducted 24 h later (Fig. 2E). In contrast, EE rats’ travel through the arena decreased by ∼30% across the 2 d (t(30) = 3.3, P = 0.002). Prior exercise did not reproduce the effects of enrichment on total exploration: There was no significant change from days 1 to 2 for WR rats (t(26) = 0.86, P = 0.4). Similarly, the habituation curve for SH rats after the first 5 min was only slightly steeper on day 2 relative to day 1 (Fig. 2F) (t(30) = 2.6, P = 0.02) and did not approach that for the EE group on day 1 or 2. In all, evidence for long-term memory in SH rats was modest. In marked contrast, the EE group exhibited a robust between day change in habituation: Exploration decreased dramatically between the first and second 5-min interval on day 2 (t(30) = 4.05, P = 0.0003), an effect not seen on day 1 (Fig. 2G). Habituation on day 2 by WR rats was not detectably different from that on day 1 (Fig. 2H) (t(26) = 0.3, P = 0.8).
Exploration of an unstructured open field by rodents produces clear evidence of long-term memory (reduced activity) in tests carried out on subsequent days (Eysenck and Broadhurst 1964; Walsh and Cummins 1976); the weakness or lack of such effects for SH and WR groups indicates that stable encoding is much more difficult for animals confronting a complex arena. It appears that prior learning by EE rats, although acquired in a very different complex environment, was transferable to the novel circumstances such that encoding on day 1 was both rapid and enduring.
Notably, EE and SH rats were not detectably different on multiple conventional measures of anxiety or arousal including movement speed, percent time active, preference for darkened spaces, and defecation (Supplemental Material; Supplemental Fig. S1).
Past experience influences search strategy
Foray counts, sessions one and two
The total number of exploratory forays made during the first session was compared between the groups; SH foray counts were not significantly higher than in the EE group but were greater than in WR rats, whereas EE foray counts were not significantly different than WR (Fig. 3A) (F(2,86) = 9.2, P = 0.0002; SH versus WR P = 0.0001, SH versus EE P = 0.07, EE versus WR P = 0.09 Tukey HSD). Like distance traveled, clear group differences emerged in how foray counts evolved over time during the session. This was assessed by dividing the session into 10-min intervals and assigning each foray to the interval in which it began. In SH rats foray counts changed little over the three intervals (slope: −0.10 ± 0.03); in contrast, EE rats’ foray counts began high, dropped by half during the second time interval, and halved again in the final 10 min (slope: −0.41 ± 0.03) (Fig. 3B). WR rats were similar to the SH group for the first two intervals but showed a decrease in foray initiations in the third, resulting in a slightly steeper habituation curve (−0.19 ± 0.03). The difference in slopes between the EE and other groups was highly significant (F(2,86) = 25.9, P < 0.0001; EE versus SH or WR P < 0.0001, SH versus WR n.s., Tukey HSD). These results suggest that rats with past experience with complexity implement a different exploratory strategy for investigating a new and challenging environment than rats without such experience.
Figure 3.

Number and timing of exploratory forays are influenced by prior enrichment. (A) SH rats made more forays during the first test session (day 1) than did WR rats; other comparisons were not significantly different. (B) EE rats began the session with a high foray count which halved in each successive 10-min interval; changes in foray counts for SH and WR rats were more modest. (C) Plot of day two foray counts show that EE rats markedly decreased total number of forays relative to 24 h earlier (P < 0.001, paired t-test) whereas SH and WR rats were unchanged (dotted line). (D) Foray starts in 10 min bins on day 2. (E) Change in foray counts during the first 10 min of session 1 versus first 10 min of session 2 dropped sharply for EE rats but not WR or SH rats. (***) P < 0.001.
Foray counts across days were nearly constant for SH (20.2 ± 0.9 to 20.0 ± 0.8) and WR (14.9 ± 0.7 to 15.2 ± 0.9) groups, a further indication that these animals did not form robust long-term memory on day 1 (Fig. 3C). EE rats showed a marked decrease in the total number of forays between the two test sessions (17.5 ± 0.9 to 12.3 ± 1.2; t(56) = 3.6, P < 0.001). Most of the between-days decrease in forays in the EE group (∼60%) occurred during the first 10 min of session two (Fig. 3D); the other two groups did not reduce their forays during this period (Fig. 3E) (F(2,86) = 15.8, P < 0.0001; EE versus SH P < 0.0001, EE versus WR P = 0.0001, SH versus WR P = 0.7 Tukey HSD). It thus appears that EE, but not SH or WR, rats learned enough about the complex test environment on day 1 such that they quickly recognized it and so were less inclined to initiate exploratory forays 24 h later.
Patterns of exploratory episodes during session one
Next, we examined foray characteristics during the first session in an attempt to identify features that could account for enhanced learning by EE rats. The space was divided into a 7 × 7 grid (49 cells) and the percentage of cells entered was measured for each foray. All rats made forays using a range of different arena coverage values, with foray counts peaking for forays between 40% and 60% coverage for rats in all groups (Fig. 4A). However, EE rats shifted their distribution away from high-coverage (>60% coverage) forays (Fig. 4B, P = 0.01, Kruskal–Wallis rank sum test, χ2 = 8.6, df = 2; P < 0.001 and P < 0.04 for EE versus SH and WR, respectively, SH versus WR n.s., Bonferroni comparisons), while making approximately the same number of low and moderate coverage forays as SH rats (counts of forays with coverage <60%, t(59) = 0.15, P = 0.9, unpaired); WR rats made fewer forays overall (as above, Fig. 3A) but their distribution of forays of different coverage values was similar to that of SH animals, shifting the entire curve downwards (Fig. 4A).
Figure 4.
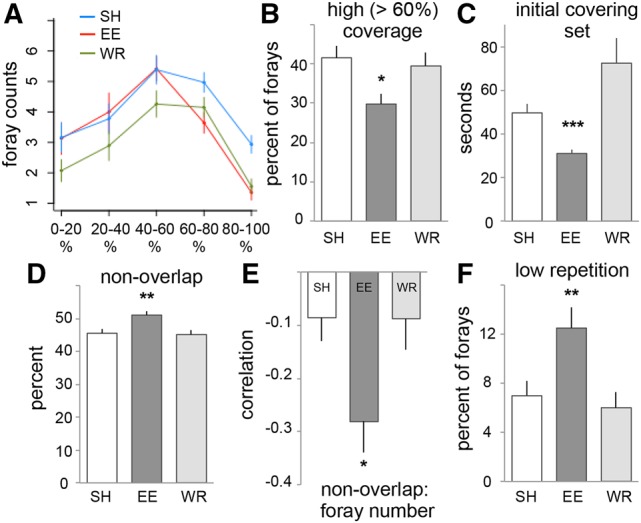
Patterns of exploration in the novel complex arena are affected by prior enrichment. (A) Percent of the arena covered by each foray is plotted in bins of 20% arena coverage. The curve for EE rats is left shifted, away from high-coverage forays, compared with SH rats; WR rats made fewer forays overall but with a similar distribution to SH rats. (B) The percent of high-coverage forays (>60% of the arena) was lower for EE rats than for other groups. (C) The average duration of the “initial covering set” of forays first used to attain full arena coverage (at least 90% of arena visited) was significantly shorter for EE group rats. (D) Plot shows the percent of each foray not visited in the immediately prior foray: EE rats had a small but significant increase in nonoverlap of successive forays compared with the other groups. (E) The nonoverlap measure was negatively correlated with foray number for EE rats (Pearson correlation coefficient). (F) Percent of forays with low repetition (>75% of line crossings were unique) was greater for EE rats than for other groups. (*) P < 0.05, (**) P ≤ 0.01, (***) P ≤ 0.001.
We next considered the pattern of forays used to first attain full coverage of the arena during initial exploration. Accordingly, the subset of initial forays that first attained a cumulative 90% coverage of the arena was examined for each animal. One SH and one EE rat had values that were more than 10 SDs from the mean of the remaining 30 and so were excluded. Full coverage occurred relatively quickly. EE rats required 5.5 ± 0.3 forays with the last of these starting at 3.5 ± 0.4 min; SH animals used a similar number of forays (5.2 ± 0.3) but with the last at 5.0 ± 0.4 min (t(58) = 2.6, P = 0.01, SH versus EE, unpaired). The WR rats were extremely variable on these measures: 41% (11 of 27 rats) covered the arena quickly (1.35 ± 0.16 min) using a small number of forays (2.2 ± 0.2) while the remainder had much higher values (5.6 ± 0.5 forays, 8.7 ± 1.2 min).
As expected from the above, the mean duration of the forays used for initial coverage of the arena was markedly lower in the EE group than in the others: 31.0 ± 1.8 seconds (sec), versus SH rats 49.6 ± 4.2 sec and WR 72.4 ± 11.7 sec (Fig. 4C; χ2(2) = 29.4, P < 0.0001 Kruskal–Wallis; EE versus SH P = 0.0003, EE versus WR P < 0.0001, SH versus WR P = 0.16, with Bonferroni correction). The EE rats thus adopted a strategy of shorter, more frequent forays which, when combined, cover the same cumulative percentage of the arena, compared with the other groups.
Do the forays made by EE rats also tend to overlap less, thus dividing the arena into smaller, more distinct exploratory portions per foray? To investigate this, we measured the extent to which successive forays did not overlap, expressed as the percent of grid cells visited in the current foray that were not visited in the immediately previous one. For the initial set of forays first leading to full coverage of the arena described above, EE rats’ foray nonoverlap was, on average, slightly but significantly higher (EE: 63.5 ± 1.9%; SH: 54.1 ± 2.9%; WR: 51.0 ± 3.2%; F(2,81) = 5.9, P < 0.004; EE versus SH P < 0.03, EE versus WR P = 0.005, SH versus WR P = 0.7 Tukey HSD; three WR rats covered the arena in the first foray and were excluded as nonoverlap with the previous foray is undefined for the first foray). Indeed this result held for the entire session (Fig. 4D) (F(2,84) = 5.6, P = 0.005; EE versus SH P < 0.02, EE versus WR P = 0.01, SH versus WR P = 0.96 in post hoc tests). Of interest, this measure showed a negative correlation with foray number (i.e. overlap tended to increase slightly for later forays) that was stronger for EE rats than for the other groups (Fig. 4E) (F(2,84) = 5.6, P < 0.02; EE versus SH P < 0.03, EE versus WR P < 0.04, SH versus WR P = 0.99 in post hoc tests).
Finally, we tested for group differences in movement choices within individual forays using a line-crossings measure. A 10 × 10 grid superimposed over the video image of the arena allowed measurements of the number of times each rat repeated crossings of the same grid segment during individual forays. The EE rats showed a substantially larger proportion of forays in which most (≥75%) line crossings were unique relative to WR or SH rats; WR and SH groups were not different on this measure (Fig. 4F) (F(2,86) = 6.4, P < 0.003; EE versus SH P = 0.01, EE versus WR P = 0.005, SH versus WR P = 0.87 Tukey HSD). It thus appears that a primary effect of prior environmental enrichment, but not exercise, is to increase the likelihood of forays in which rats do not repeat material sampled in the immediate past.
The above findings indicate that the rapid learning by EE rats during the first session was not due to more exploration of the test arena. Instead, relative to SH and WR rats, the EE group began with a higher frequency of briefer, less repetitive forays to explore the arena. This suggests that the material transferred from earlier complexity included a flexible strategy for dealing with high dimensional circumstances.
Prior experience and evidence for LTP
Neuronal substrates of the effects of enrichment on learning as described above were then investigated, comparing EE versus SH rats (WR rats did not show robust day 2 memory and were not used).
Past experience with an enriched environment could increase connectivity in hippocampus so as to promote future learning. We explored this idea by counting the number of synapses, immunoreactive for the excitatory synapse postsynaptic density protein PSD-95, in three-dimensional reconstructions of nine discrete hippocampal sampling zones. PSD-95 is reportedly uniformly distributed across glutamatergic synapses (Kennedy 1997; Petersen et al. 2003; Sassoé-Pognetto et al. 2003). There were no differences between EE versus SH rats in the number or size of PSD-95 immunopositive contacts (Supplemental Results; Supplemental Fig. S2).
Next, we tested for differential effects of past experience on levels of a synaptic marker for long-term potentiation (LTP) during the first session in the novel complex arena. Studies of hippocampal slices showed that LTP consolidation relies upon multiple signaling cascades leading to the formation and subsequent stabilization of actin networks in dendritic spines (Rex et al. 2009; Lynch et al. 2013). Phosphorylation (inactivation) of the actin severing protein cofilin is a critical step in the actin polymerization phase of this process (Chen et al. 2007); therefore we used phosphorylated (p) Cofilin as a marker for synapses having recently undergone potentiation.
Group differences in synaptic pCofilin
Rats were sacrificed at the conclusion of a first 30-min session in the complex test arena, during which the above-described learning differences between EE and SH rats were replicated (see Supplemental Fig. S3). Comparisons were thus made between rats that rapidly learned during the session (EE group) versus those that did not (SH group), although both groups explored the space to about the same degree. Four to five spaced tissue sections through rostral hippocampus were processed for dual immunolabeling for PSD-95 and pCofilin Ser3 as in previous work (Fig. 5A; Chen et al. 2007). For this analysis, entire hippocampal cross sections were captured in several hundred digital images each, and the numbers and pCofilin immunolabeling densities of double-labeled synapses were determined for 66 contiguous sampling zones, composing 11 primary anatomical divisions covering apical and basal dendritic fields (Fig. 5B).
Figure 5.

Synaptic pCofilin levels show consistent regional measures with enriched rats displaying an increase in high density pCofilin labeling after learning in a novel complex environment. (A) Representative deconvolved image shows dual immunolabeling for PSD-95 (green) and pCofilin (red); arrow indicates double labeling (yellow). Scale bar = 2 µm. (B) Diagram illustrating the 11 dendritic zones measured, including CA1 stratum oriens (so), stratum radiatum (sr), and lacunosum moleculare (lm); field CA3ab (so, sr); field CA3c (so, sr), CA3 lm, the dentate gyrus (DG) molecular layer internal leaf (IL) and external leaf (EL), and the polymorphic zone (pz) of the dentate gyrus hilus. (C) Total counts of double-labeled puncta across all zones were comparable for SH (0.73 ± 0.05 × 10⁶) and EE (0.75 ± 0.04 × 10⁶) rats. (D) Counts of double-labeled synapses in each of the 11 zones were similar and well correlated (r = 0.995) between EE and SH groups. (E) Immunolabeling frequency distributions for all zones combined (plots show the percent of double-labeled contacts in different pCofilin immunolabeling density bins) for the animals in each group, shown for each of the two cohorts. A shift between cohorts was apparent in both groups; frequency distributions were, therefore, compared separately for each cohort (two-way RM-ANOVAs: cohort 1: F(20,378) = 7.05, P < 0.0001; cohort 2: F(26,498) = 2.99, P < 0.0001). (Insets) Comparison of the right tail (higher densities) for each cohort reveals a small but consistent increase in synapses with higher levels of pCofilin for EE compared with SH rats. (F) Mean difference from within-cohort SH curve (mean SH curve for a cohort subtracted from the curve for each rat from either group in that cohort). EE group rats’ deviation from SH mean increases with higher density bins (two-way RM-ANOVA: F(23,432) = 2.234, P = 0.001), in accordance with the rightward skew of the frequency distributions.
The total number of pCofilin-positive synapses across all divisions combined was the same for the two groups (SH: 0.73 ± 0.05 × 10⁶ per rat; EE: 0.75 ± 0.04 × 10⁶ per rat) (Fig. 5C). Moreover, the mean number of double-labeled synapses was comparable for the two groups for each of the 11 divisions (Fig. 5D). Note that absolute values differed between the divisions and were well correlated between SH and EE groups (r = 0.995). The relatively low variance and high degree of correlation indicates that the same regions were reliably outlined between sections, animals, and groups.
We then tested whether the percentage of synapses that were associated with particularly high concentrations of pCofilin was detectably different between the two groups. Frequency distributions (percent of double-labeled contacts vs. density of pCofilin immunolabeling) over the entire hippocampal section were constructed by averaging the distributions for the animals from each of the 11 dendritic fields. The resultant curves for the two cohorts of SH rats did not perfectly align and a comparable shift between cohorts was seen in the EE group (Fig. 5E). We therefore compared SH versus EE frequency distributions separately for each cohort. The curves for EE rats were slightly skewed to the right (higher densities) relative to those for the SH group in each cohort (two-way RM-ANOVAs: cohort 1: F(20,378) = 7.05, P < 0.0001; cohort 2: F(26,498) = 2.99, P < 0.0001), indicating that the EE group had a small but reliable increase in excitatory synapses with high levels of pCofilin. The slight differences in the shape of the frequency curves for the two cohorts argued against combining them into a composite curve for either SH or EE groups. We therefore subtracted the mean SH curve in a cohort from each animal (SH and EE) in that cohort, thereby creating a difference-from-control curve for individual rats. The difference curves were then combined for the two cohorts. The results indicate that EE rats progressively deviated from the SH group across higher density bins (two-way RM-ANOVA: F(23,432) = 2.234, P = 0.001) (Fig. 5F), in agreement with the rightward skew in the frequency distributions for each cohort. These results establish that effective learning of a complex arena by rats having prior experience with complexity is accompanied by a small overall increase in synapses associated with higher densities of an LTP marker (pCofilin), compared with rats without such experience that did not display behavioral evidence of learning.
Regional differences
Next, we asked whether group effects described above reflect a uniform increase in pCofilin immunolabeling at synapses across hippocampus as opposed to regionally differentiated effects. Difference curves of the type described above (Fig. 5F) were accordingly calculated for each of the 11 hippocampal subfields (Fig. 6A). Striking regional effects were found: stratum oriens (so) and stratum radiatum (sr) of field CA1 both had steeply rising curves reaching values that were double the baseline (SH) scores (Fig. 6A). Labeling in CA1 lacunosum moleculare (lm) was also increased. There were no significant effects in remaining subdivisions. Increases in densely pCofilin immunolabeled synapses (≥ fluorescence density bin 135) for CA1 in EE relative to SH rats involved only a small percentage of the entire population; CA1-so: SH = 1.00 ± 0.12% of the population; EE = 1.65 ± 0.24%, (t(21) = 2.43, P = 0.02). Thus, the largest regional effect associated with rapid learning involved a <1% increase in densely pCofilin immunolabeled contacts. Changes across the entire cross section, including regions in which group differences were barely detectable, would necessarily be much smaller than this value. In all, it appears that the stable encoding of a large amount of information by EE rats during a 30-min session in a novel, complex environment is associated with a very economical use of storage elements.
Figure 6.

Synapses with dense concentrations of synaptic pCofilin are concentrated in field CA1 after learning in animals with past experience with complexity. (A) Percent difference (y-axis) from the positive tail of the mean frequency distribution curve for SH rats (x-axis: successively higher pCofilin density bins); results are summarized for 10 of the 11 hippocampal subfields (polymorph zone of hilus (pz) not shown). Average values for a group of 12 SH rats (blue line), included here to show between animal variability. Average values for 11 EE rats (orange line). Curves for CA1 stratum oriens (str. oriens, so) and stratum radiatum (str. radiatum, sr) progressively increased in the EE group across 16 density bins shown, indicating that the frequency distribution curves for these two areas were strongly right shifted from the corresponding zones in the SH group (two-way RM-ANOVAs: CA1-so: F(19,399) = 7.34 P < 0.0001; CA1-sr: F(19,399) = 6.30, P < 0.0001). A weaker effect of this type was also found in CA1 lacunosum moleculare (str. moleculare, lm) (RM-ANOVA: F(19,399) = 1.98, P < 0.01); there were no other significant effects. (B) The slopes of the difference curve from the mean of the SH group were calculated for each region in the EE rats to provide a single value for comparisons between regions within the EE group; there was a clear regional effect (RM one-way ANOVA: F(3.52,35.2) = 4.28, P = 0.008) with CA1-so (P = 0.005,Tukey HSD) and CA1-sr (P < 0.03) increased above other areas. (C) Normalization of regional values for each EE animal to its mean (all regions) difference from SH rats confirms that CA1-so and -sr have a higher percentage of high-concentration pCofilin synapses than the other zones (one-way ANOVA: F(10,110) = 4.70, P < 0.0001; CA1-so: P = 0.002; CA1-sr: P = 0.002; Tukey HSD). DG, dentate gyrus; IL, internal leaf; EL, external leaf.
To facilitate comparisons between regions, we calculated the slopes for the difference curves for immunolabeling density bins 140–180 for each EE rat. This analysis confirmed that field CA1 basal and proximal apical dendrites contained higher percentages of synapses with dense concentrations of pCofilin than did the remainder of the hippocampus (Fig. 6B). As seen in Figure 6A,B, there was considerable variability between individual rats in the EE group. We therefore normalized the regional values for each animal to its mean for all zones, a step that eliminates between-animal differences in slopes. The results confirmed that the two CA1 fields had a much higher percentage of synapses associated with high concentrations of pCofilin relative to SH rats than the nine remaining zones (Fig. 6C).
Fine-grained analyses of regional effects
The results for the 11 dendritic fields measured establish that LTP-related synaptic effects in hippocampus of EE rats are largely restricted to two subdivisions: field CA1 so and sr. The question then arises as to whether further differentiation can be detected with finer grained analyses. We used the 66 contiguous sampling zones and the slopes for differences between the positive tails of the frequency distributions to test the point. As expected, within group variability was high for this analysis but there was a clear regional effect in the EE group (two-way RM-ANOVA, P = 0.0005) (Fig. 7A). In eight of the 66 zones, the mean slope in the EE group was ≥1.5 but only two of these (CA1-sr, zones 3 and 4) were statistically different in post hoc tests from the corresponding SH areas (Fig. 7A). One EE rat had a mean slope value for all fields that was 3.2 SDs lower than the mean value for the remaining rats. Excluding this case increased the statistical difference between the distributions for EE versus SH groups (two-way RM-ANOVA F(65,1300) = 1.76, P = 0.0002) and added post hoc differences for CA1-so zones 3 and 4 (P < 0.01, Sidak MCT).
Figure 7.

Division of the 11 original sampling regions above into 66 contiguous subsampling zones reveals hot spots and clustering effects in EE group. (A) Slopes of EE versus SH differences across increasing pCofilin density bins (see text) were calculated for 66 fields. Regional distribution of differences from SH frequency distribution curves were significant (two-way RM-ANOVA, F(65,1365) = 1.703, P = 0.0005). Two subzones, CA1-sr 4 and 5, differed from other areas in post hoc Bonferroni's tests (P < 0.03, 0.05). (B) Regional values for each animal in the EE group were normalized to the mean score for that animal for all 66 sampling areas; there was a strong regional effect (one-way ANOVA: F(65,660) = 2.23, P < 0.0001) with CA1-sr 4,5 again different from other areas (P < 0.05 for each, Tukey HSD). (C) Locations of eight subfields where mean EE slopes were ≥1.5. Notably, CA1 “hotspots” were located in adjacent basal and apical dendrites (brown dots). (D) The mean values for the eight areas were calculated and compared with the means for the remaining 58 areas for each EE rat to provide a measure of relative clustering. The group difference for the two collections of sampling fields was significant (P = 0.00001, t(20) = 5.82, two-tailed).
Normalizing the regional values for each of the 11 animals to its mean for all 66 zones, to reduce within group differences, confirmed that marked regional distributions of slope values were present in the EE group (one-way RM-ANOVA: P < 0.0001, with CA1-sr 4 and 5 being statistically different than other areas in post hoc tests) (Fig. 7B). Excluding the one case noted above again extended the difference from other regions in the EE group to CA1-so 3 and 4 in post hoc tests (one-way ANOVA: F(65,594) = 2.15, P < 0.0001; Tukey HSD, P < 0.01).
It is noteworthy that five of the eight areas with the greatest differences from controls were located in the same medio-lateral region of field CA1 (lateral CA1a and medial CA1b) (Fig. 7C). A clustering score was calculated for each rat by comparing the mean values for the eight zones versus the remaining 58 zones. There was considerable variability within the EE group but clear differences were present for each animal: the mean slope (normalized; Panel B) for the target fields was 1.17 ± 0.23 and −0.16 ± 0.03 for the remainder (Fig. 7D). Having a single value for each rat made it possible to test for a predicted correlation between learning (initial habituation rate) and pCofilin cluster score. This did not reach statistical significance for the entire group (Spearman r = 0.43, one tail P = 0.096) in large part due to one animal that was much less active during the session than the other members of the group, which varied only slightly (49.7 m versus 100.1 ± 4.9 m). Excluding this case resulted in a robust correlation (r = 0.72, P = 0.01).
Discussion
Experiential learning involves both the acquisition of specific information and the development of generalizable strategies through largely unsupervised interactions with a complex environment. Strategy development implies the ability to use previous learning to enhance performance in related but clearly different circumstances. The present results constitute evidence that such application of past experience-based learning occurs in rodents and has a potent, and surprisingly selective, influence on behavior. In doing so, they provide a quantitative description for a component of animal behavior that has received little attention and suggest a route for analyzing brain substrates for an essential aspect of human psychology.
The EE animals used search patterns that were clearly different than those used by the other groups: (1) more frequent and shorter duration excursions, particularly during initial exploration of the arena; (2) relatively more “partial” forays, covering less of the arena during an episode, and fewer extensive forays covering greater portions of the arena; (3) an increased tendency to visit locales not visited over those already seen during the immediately prior episode; and (4) a reduced tendency to repeat transitions from one location to another within a given exploratory episode. Importantly, these effects were found during the initial minutes of testing in the novel arena, from which it follows that EE rats were using previously developed approaches to complex situations. A reasonable interpretation of these observations is that the rats had learned, during prior encounters with a complex environment, to break a large, complex problem into smaller, more digestible pieces; and to avoid repeating moves already made during a given episode or shortly prior to it. This is a well-recognized strategy for increasing the efficacy of learning when confronted with a great deal of information and so could account for the striking group differences in memory encoding.
Past work on enriched environments and learning addressed questions of a very different type than those studied here. Such experiments were largely concerned with the consequences of dendritic growth in developing or adult rodents on memory encoding in relatively simple operant (rewarded) paradigms; the goal was not to assess the application of experience to current situations but rather to test if structural changes in brain are associated with improved performance (Kolb and Gibb 1991; Falkenberg et al. 1992; Rosenzweig and Bennett 1996; Nilsson et al. 1999; van Praag et al. 2000; Leggio et al. 2005). Our studies used much briefer, repeated exposures to enrichment that did not produce detectable changes in synapse numbers, and behavioral tests in very complex circumstances in which explicit rewards were absent.
The present studies are more clearly related to past work on the possibility that animals extract generalizable rules while solving multiple related problems. Harlow's investigations of “learning how to learn efficiently” (Harlow 1949) in primates provides the classic example of such effects. However, the “learning set” results (wherein an animal extensively trained on rewarded stimulus pair discriminations gains the ability to learn a new discrimination in a single trial, subsequently demonstrated in rats (Kay and Oldfield-Box 1965; Jennings and Keefer 1969)) are, in rats at least, considered to involve a specific procedure, that is, a set of contingency-action sequences (win:stay, lose:shift). We do not think that the modified search strategies used by EE rats in the present studies can be characterized as specific action sequences of this sort.
More recent work indicates that rodents develop abstract “schema” while solving multiple related problems, and transfer these to new learning. In these studies, enhanced performance on novel problems was clearly not due to prior learning of specific procedures of the type described for learning sets (Tse et al. 2007). The studies describe coactivation of frontal cortical and hippocampal circuitries (Tse et al. 2011) during rapid reinforcement learning of new odor–location associations within a previously learned spatial arrangement of several different odor–location pairs, suggesting that the earlier slow learning led gradually to the formation of networks in frontal cortex which then enabled more rapid learning of new information given in the same spatial context. Note that the “schema” in these studies concerned the specific set of odor–location cues in that context: the researchers found that when animals were trained on a similar problem in a different room they did not show faster learning; these schema thus appear to concern quite specific “information” and may differ in this respect from the generalized strategies we suggest underlie the behavioral effects in the present studies.
Nonetheless an extension of the schema hypothesis to unsupervised learning in complex circumstances provides a reasonable explanatory framework for the observed effects of enriched environments on subsequent behavior in a challenging situation. This aligns with the widely discussed hypothesis (McClelland et al. 1995; Binder and Desai 2011) that certain types of learning enhance the reciprocal connectivity between association cortex and hippocampus resulting in the exchange of regionally specialized information between them. Coordination of activity between hippocampus and frontal cortex has been described for a large array of behavioral paradigms across species; this is generally assumed to reflect frontal guidance of hippocampal processing of now present cues (Preston and Eichenbaum 2013). The “schema” studies cited above (Tse et al. 2007, 2011) found evidence for activation in prelimbic, medial prefrontal cortex, part of a so-called “PL circuit” subserving cognitive functions and goal-directed behavior (Vertes 2006). Connections in hippocampus, frontal cortex, and the closely allied ventral striatum have been shown to play roles in cognitive flexibility including reversal, attention-shifting, and other paradigms involving reward contingencies (Kehagia et al. 2010; Morris et al. 2016); comparing the present paradigm without reinforcement with studies that do use rewarding cues may be of particular interest here.
As described, foray characteristics were clearly affected by past enrichment and this was associated with pronounced effects on learning. Rats use visual, olfactory, and self-movement signals in exploratory forays from a defined home base (Maaswinkel and Whishaw 1999; Whishaw et al. 2001; Loewen et al. 2005); integration of these signals will involve a sequence of items, spatial relationships, and temporal intervals generated as the animal navigates the arena. The formation of functional networks between hippocampus and frontal areas would be expected to enable the latter to regulate input to hippocampus and in turn receive signals relating to ongoing processing. Collectively, these observations suggest a hypothesis in which EE experience resulted in frontal encoding of broadly applicable schema that shaped exploratory patterns so as to promote efficient storage of sequential information within hippocampus. These studies suggest testable predictions regarding where and how the learning acquired during prior enrichment is stored, and how it is invoked in new circumstances. In the present studies we examined the encoding differences resulting during the new context in one station of this circuitry, the hippocampus. An analysis of activity-dependent gene expression could potentially test the prediction that prior experience alters the spatial pattern of neuronal firing in cortico-hippocampal networks during exploration.
The above arguments posit that the exploratory session caused learning-related synaptic changes within hippocampus to a clearly greater degree in EE rats than in their standard handled controls. We tested this by counting synapses associated with a high concentration of pCofilin. This constitutively active protein severs developing actin filaments unless inactivated by phosphorylation, a step that is critical to the production of the cytoskeletal changes required for LTP consolidation (Chen et al. 2007; Rex et al. 2009). Previous studies showed that unsupervised learning in a simple open field by rats with no prior experience increases the percentage of hippocampal synapses containing relatively high levels of pCofilin within hippocampal field CA1; an NMDA receptor antagonist blocked both the synaptic changes and memory encoding (Fedulov et al. 2007). Studies using other synaptic markers of LTP confirmed that simple unsupervised learning elicits the potentiation effect in the hippocampus of naive rats (Chen et al. 2010a,b). A map describing the distribution of modified synapses has previously been reported for an experiment of this type; in the earlier study, the changes occurred in a few sites scattered across a cross section of hippocampal subfields (Cox et al. 2014). The design of the present experiments generated maps of synaptic changes in two groups, only one of which showed strong evidence for learning after the same 30-min period during which the two sets of rats did approximately the same amount of exploration. Learning was accompanied by a reliable increase in pCofilin immunolabeled synapses clustered in the basal and proximal apical dendrites of hippocampal field CA1.
As expected, increasing the resolution of the map, by using a larger number of smaller sized sampling fields, increased within-group variability but two adjacent sites in the CA1 apical dendrites of EE rats had large, reliable increases in synapses with dense pCofilin immunolabeling. A number of factors could contribute to the observed variance: (i) estimates for a site are drawn from a much smaller number of synapses than in the broader-scale maps; (ii) it is not feasible with current technology to perform 3-D reconstructions of all synapses across the 66 sample zones; (iii) reproducibility of sampling boundaries across animals is less certain than with broader maps; and (iv) it is possible that the location of synaptic modifications varied between individuals in a group. Further analysis focused on the extent to which individual rats exhibited their largest increases in pCofilin at the same sites. Eight of the 66 sample fields that had the highest mean values were used as targets; notably, five of these were centered on the apical and basal dendrites of field CA1b. The resultant cluster scores were close to random for the SH rats and much higher in EE animals. Having a single value for each rat's map made it possible to compare the neurobiological effects with behavior; evidence for a correlation between learning and localization was then obtained. A plausible explanation for these results is that the EE foray pattern selectively and intensely activates subpopulations of CA3 pyramidal neurons that project to select CA1 subzones. Based on known intrahippocampal anatomy, it can be assumed that these populations are located in fields CA3a,b (Ishizuka et al. 1990). Confirmation of this prediction would be an important step toward an analysis of how prior experiential learning and associated search patterns alter the processing and storage of complex information by hippocampus.
This map of synapses likely undergoing LTP was unexpected in light of recent work stressing the importance of hippocampus for the formation of episodic memory (Dede et al. 2016), which minimally involves the unsupervised learning of individual cues in a series (“what”), their spatial relationships (“where”), and the order in which they occur (“when”). Exploration of a new, many cue location is commonly cited as a case in which such memory is constructed (Eacott and Easton 2010) and it is accordingly reasonable to consider individual forays as episodes. A growing body of work indicates that the three components of an episode involve different hippocampal pathways (Pastalkova et al. 2008; Farovik et al. 2010; Barrett et al. 2011; Mankin et al. 2012) and we had accordingly expected to find a higher incidence of altered synapses in each of these connections in the EE versus SH groups. Instead, changes were concentrated in CA1. Our results raise the possibility that the pertinent codes constructed by hippocampus include a composite representation, localized in the final stage of processing (field CA1), for the different elements noted above.
Materials and Methods
Animals and pretest treatments
Studies used male Long Evans rats (Harlan, Indianapolis, IN), 2 mo old at testing. Protocols were approved by the Institutional Animal Care and Use Committee and in accordance with the NIH Guide for the Care and Use of Laboratory Animals. Rats were housed four per cage on a reverse 12 h light–dark cycle in standard polycarbonate rat home cages with food and water ad libitum. All treatments were carried out during the animals’ dark cycle. Rats were initially handled twice daily for 3 d, including placement in transport bins (black home cages with black filter tops) from day 3, and randomly assigned to one of three treatment groups. SH rats continued to receive handling and were transported to and from behavioral testing rooms for 6 d. EE rats were transported to the testing rooms and placed together in a large, multilevel enclosure (132 × 62 × 102 cm) with numerous chewable and moveable rat toys, running wheels, ladders, bedding boxes, and food and water, for 5 h/day, for 6 d (Fig. 1C). Enrichment thus included a social component. WR rats were transported to and from behavioral testing rooms, then placed as home cage pairs into a modified bin (36 × 56 × 37 cm; larger than the home cage) containing two running wheels (Fig. 1B), bedding, food and water, for 5 h/d for 6 d. Behavioral testing began after the sixth day of pretreatments. Five experiments were run with 16 rats each. After excluding five rats due to equipment failure (bottle leakage, poor video tracking) and two rats that did not engage in foray behavior (<1 min in arena or <1 min in refuge, from EE and SH groups, respectively) there were 31 EE, 31 SH and 27 WR rats evaluated.
Behavioral testing
The complex open field was a 1 m2 arena separated by barriers into four rooms, with passages allowing movement between rooms; each room contained one of four different objects (Fig. 1E,F). Arena and barrier walls were 46-cm-high acrylic panels. Objects had weighted, steel bases and distinct chrome, porcelain, or acrylic upper tiers. One arena wall was clear, with distant object cues visible; other walls were opaque. Opposite the clear wall a 10 cm × 10 cm opening led to a small, dark, enclosed refuge with hinged lid constructed of infrared-transparent but visually opaque plastic (18 × 45 × 46 h cm), into which the rat was placed at start of testing. Rats do not see in the infrared spectrum (Muntz 1967; Thomson et al. 2013). Flooring was white waterproof sheeting. The test room was weakly lit with string lights visible as distal cues. Infrared floodlights allowed video recordings of movements in both the visible and infrared light spectrums.
At testing, rats were individually placed in the refuge and allowed to explore for 30 min with overhead CCD cameras (Sony Corp) recording movements. The apparatus and objects were cleaned with Scoe-10x solution (BioFog) between animals. A second 30-min test session was given 24 h later. Exploratory behavior was analyzed using ANY-maze software (Stoelting Corp) and custom code written in Matlab (The MathWorks) and R (r-project.org), and statistics calculated using R, Matlab, and Prism (GraphPad). Plots show group means ± SE. Comparisons across the three groups used one-way ANOVA with post hoc Tukey HSD analyses. A Kruskal–Wallice rank sum test with Bonferroni correction for multiple comparisons was used in two cases where the variance of one group (WR) was greater than the others. Within-group comparisons of the same subjects across two different conditions used paired two-way t-tests; t-tests across different subjects were unpaired and noted as such in text. Statistical tests were considered significant if P > 0.05.
Analyses of synapse immunolabeling (see Supplemental Methods)
For immunolabeling, additional animals were prepared. These included one cohort of SH and EE rats (n = 6 per group) for 3-D counts of PSD-95 immunolabeled synapses (see Supplemental Results; Supplemental Fig. S2; Supplemental Methods for details), and two cohorts of SH and EE rats for the PSD-95/pCofilin study (n = 8 and n = 16 per cohort, each evenly split by group for a final total of n = 12 ea for SH and EE groups; 1 EE rat later excluded due to tissue damage).
For the PSD-95 analysis, EE rats were given one 30-min session in the apparatus whereas SH rats remained in transport bins for 30 min. For the PSD-95/pCofilin analysis, EE and SH rats were given one 30-min session in the test apparatus. For both analyses, rats were then immediately euthanized by decapitation under isoflurane inhalation anesthesia. Brains were fast frozen and cryostat sectioned; slide mounted sections were fixed in methanol and processed for dual immunofluorescence as described (Chen et al. 2007) using mouse anti-PSD-95 (1:1000; ThermoFisher Scientific #MA1-045) and rabbit pCofilin Ser3 (1:1000 Abcam #12866) and secondary antisera including AlexaFluor488 anti-mouse IgG and AlexaFluor594 anti-rabbit IgG (both 1:1000, Invitrogen). Some sections were processed without one or the other primary antisera to verify an absence of secondary antisera cross-reactivity or channel bleed-through.
For quantification of PSD-95 immunopositive synapses, epifluorescence image z-stacks were collected at 63× from three major hippocampal dendritic subfields and used to create 3-D reconstructions from which immunolabeled synapses were quantified as described in Supplemental Methods. For analyses of synaptic PSD-95/pCofilin dual immunolabeling, a broad-scale mapping technique was used: contiguous epifluorescence images were collected at 63× on a single focal plane, covering the entirety of each hippocampal cross section; double-labeled PSD-95+ synapses were then counted using in-house software. To assign individual counted objects (meeting size and eccentricity constraints of synapses) to their respective hippocampal subzone, 11 anatomical regions of interest corresponding to the dendritic fields of the major hippocampal subfields were manually outlined for each section (strata oriens, radiatum, and lacunosum moleculare of fields CA1, CA3ab, and CA3c; the inner and outer leaves of the dentate gyrus molecular layer, and the polymorphic zone of the hilus) (see Fig. 5B). These fields were further divided into 66 similarly sized subzones using equispaced line segment overlays and custom Matlab code; the number and pCofilin immunolabeling densities of these objects were then determined using in house software (Cox et al. 2014). Statistics were calculated using Matlab, Prism, and the Python programming language (python.org). Group comparisons were performed using two-way repeated-measures ANOVA, with post hoc Tukey HSD analyses.
Supplementary Material
Acknowledgments
This work was supported by Office of Naval Research grant N00014-10-1-007 (G.L.), National Science Foundation grants #1146708 (G.L.) and DGE-0808392 (C.D.C.), and National Institutes of Health grant NS045260 (C.M.G. and G.L.). We are thankful for resources and support provided by the University of California, Irvine High-Performance Computing cluster.
Footnotes
[Supplemental material is available for this article.]
Article is online at http://www.learnmem.org/cgi/doi/10.1101/lm.045559.117.
References
- Archer J. 1973. Tests for emotionality in rats and mice: a review. Anim Behav 21: 205–235. [DOI] [PubMed] [Google Scholar]
- Baldwin TT, Ford JK. 1988. Transfer of training: a review and directions for future research. Pers Psychol 41: 63–105. [Google Scholar]
- Barlow HB. 1989. Unsupervised learning. Neural Comput 1: 295–311. [Google Scholar]
- Barlow H. 1990. Conditions for versatile learning, Helmholtz's unconscious inference, and the task of perception. Vision Res 30: 1561–1571. [DOI] [PubMed] [Google Scholar]
- Barrett RM, Malvaez M, Kramar E, Matheos DP, Arrizon A, Cabrera SM, Lynch G, Greene RW, Wood MA. 2011. Hippocampal focal knockout of CBP affects specific histone modifications, long-term potentiation, and long-term memory. Neuropsychopharmacology 36: 1545–1556. [DOI] [PMC free article] [PubMed] [Google Scholar]
- Binder JR, Desai RH. 2011. The neurobiology of semantic memory. Trends Cogn Sci 15: 527–536. [DOI] [PMC free article] [PubMed] [Google Scholar]
- Chen LY, Rex CS, Casale MS, Gall CM, Lynch G. 2007. Changes in synaptic morphology accompany actin signaling during LTP. J Neurosci 27: 5363–5372. [DOI] [PMC free article] [PubMed] [Google Scholar]
- Chen LY, Rex CS, Pham DT, Lynch G, Gall CM. 2010a. BDNF signaling during learning is regionally differentiated within hippocampus. J Neurosci 30: 15097–15101. [DOI] [PMC free article] [PubMed] [Google Scholar]
- Chen LY, Rex CS, Sanaiha Y, Lynch G, Gall C. 2010b. Learning induces neurotrophin signaling at hippocampal synapses. Proc Natl Acad Sci 107: 7030–7035. [DOI] [PMC free article] [PubMed] [Google Scholar]
- Cox CD, Rex CS, Palmer LC, Babayan AH, Pham DT, Corwin SD, Trieu BH, Gall CM, Lynch G. 2014. A map of LTP-related synaptic changes in dorsal hippocampus following unsupervised learning. J Neurosci 34: 3033–3041. [DOI] [PMC free article] [PubMed] [Google Scholar]
- Dede AJO, Frascino JC, Wixted JT, Squire LR. 2016. Learning and remembering real-world events after medial temporal lobe damage. Proc Natl Acad Sci 113: 13480–13485. [DOI] [PMC free article] [PubMed] [Google Scholar]
- Eacott MJ, Easton A. 2010. Episodic memory in animals: remembering which occasion. Neuropsychologia 48: 2273–2280. [DOI] [PubMed] [Google Scholar]
- Eilam D, Golani I. 1989. Home base behavior of rats (Rattus norvegicus) exploring a novel environment. Behav Brain Res 34: 199–211. [DOI] [PubMed] [Google Scholar]
- Eysenck HJ, Broadhurst PL. 1964. Experiments in motivation In Experiments in motivation, pp. 375–389. Pergamon Press, New York. [Google Scholar]
- Falkenberg T, Mohammed AK, Henriksson B, Persson H, Winblad B, Lindefors N. 1992. Increased expression of brain-derived neurotrophic factor mRNA in rat hippocampus is associated with improved spatial memory and enriched environment. Neurosci Lett 138: 153–156. [DOI] [PubMed] [Google Scholar]
- Farovik A, Dupont LM, Eichenbaum H. 2010. Distinct roles for dorsal CA3 and CA1 in memory for sequential nonspatial events. Learn Mem 17: 12–17. [DOI] [PMC free article] [PubMed] [Google Scholar]
- Fedulov V, Rex CS, Simmons DA, Palmer L, Gall CM, Lynch G. 2007. Evidence that long-term potentiation occurs within individual hippocampal synapses during learning. J Neurosci 27: 8031–8039. [DOI] [PMC free article] [PubMed] [Google Scholar]
- Fisher DH, Pazzani MJ, Langley P. 1991. Concept formation: knowledge and experience in unsupervised learning. Morgan Kaufmann Publishers. [Google Scholar]
- Frankland PW, Bontempi B. 2005. The organization of recent and remote memories. Nat Rev Neurosci 6: 119–130. [DOI] [PubMed] [Google Scholar]
- Genaro G, Schmidek WR. 2000. Exploratory activity of rats in three different environments. Ethology 106: 849–859. [Google Scholar]
- Globus A, Rosenzweig MR, Bennett EL, Diamond MC. 1973. Effects of differential experience on dendritic spine counts in rat cerebral cortex. J Comp Physiol Psychol 82: 175–181. [DOI] [PubMed] [Google Scholar]
- Granger R, Whitson J, Larson J, Lynch G. 1994. Non-Hebbian properties of long-term potentiation enable high-capacity encoding of temporal sequences. Proc Natl Acad Sci 91: 10104–10108. [DOI] [PMC free article] [PubMed] [Google Scholar]
- Greenough WT, Volkmar FR, Juraska JM. 1973. Effects of rearing complexity on dendritic branching in frontolateral and temporal cortex of the rat. Exp Neurol 41: 371–378. [DOI] [PubMed] [Google Scholar]
- Hall C, Ballachey EL. 1932. A study of the rat's behavior in a field. A contribution to method in comparative psychology. University of California Publications in Psychology. [Google Scholar]
- Harlow HF. 1949. The formation of learning sets. Psychol Rev 56: 51–65. [DOI] [PubMed] [Google Scholar]
- Hastie T, Tibshirani R, Friedman J. 2009. The elements of statistical learning In The elements of statistical learning, pp. 485–585. Springer, New York. [Google Scholar]
- Ishizuka N, Weber J, Amaral DG. 1990. Organization of intrahippocampal projections originating from CA3 pyramidal cells in the rat. J Comp Neurol 295: 580–623. [DOI] [PubMed] [Google Scholar]
- Jennings JW, Keefer LH. 1969. Olfactory learning set in two varieties of domestic rat. Psychol Rep 24: 3–15. [DOI] [PubMed] [Google Scholar]
- Kay H, Oldfield-Box H. 1965. A study of learning-sets in rats with an apparatus using 3-dimensional shapes. Anim Behav 13: 19–24. [Google Scholar]
- Kehagia AA, Murray GK, Robbins TW. 2010. Learning and cognitive flexibility: frontostriatal function and monoaminergic modulation. Curr Opin Neurobiol 20: 169–192. [DOI] [PubMed] [Google Scholar]
- Kennedy MB. 1997. The postsynaptic density at glutamatergic synapses. Trends Neurosci 20: 264–268. [DOI] [PubMed] [Google Scholar]
- Kolb DA. 2015. Experiential learning: experience as the source of learning and development. 2nd ed Prentice Hall, Inc. [Google Scholar]
- Kolb B, Gibb R. 1991. Environmental enrichment and cortical injury : behavioural and anatomical consequences of frontal cortex lesions. Cereb Cortex 1: 189–198. [DOI] [PubMed] [Google Scholar]
- Kolb B, Whishaw IQ. 1998. Brain plasticity and behavior. Annu Rev Psychol 49: 43–64. [DOI] [PubMed] [Google Scholar]
- Kolb B, Gorny G, Söderpalm AH, Robinson TE. 2003. Environmental complexity has different effects on the structure of neurons in the prefrontal cortex versus the parietal cortex or nucleus accumbens. Synapse 48: 149–153. [DOI] [PubMed] [Google Scholar]
- Lauterborn JC, Jafari M, Babayan AH, Gall CM. 2015. Environmental enrichment reveals effects of genotype on hippocampal spine morphologies in the mouse model of fragile X syndrome. Cereb Cortex 25: 516–527. [DOI] [PMC free article] [PubMed] [Google Scholar]
- Leggio MG, Mandolesi L, Federico F, Spirito F, Ricci B, Gelfo F, Petrosini L. 2005. Environmental enrichment promotes improved spatial abilities and enhanced dendritic growth in the rat. Behav Brain Res 163: 78–90. [DOI] [PubMed] [Google Scholar]
- Lesburgueres E, Gobbo OL, Alaux-Cantin S, Hambucken A, Trifilieff P, Bontempi B. 2011. Early tagging of cortical networks is required for the formation of enduring associative memory. Science 331: 924–928. [DOI] [PubMed] [Google Scholar]
- Loewen I, Wallace DG, Whishaw IQ. 2005. The development of spatial capacity in piloting and dead reckoning by infant rats: use of the huddle as a home base for spatial navigation. Dev Psychobiol 46: 350–361. [DOI] [PubMed] [Google Scholar]
- Lynch G, Kramár EA, Babayan AH, Rumbaugh G, Gall CM. 2013. Differences between synaptic plasticity thresholds result in new timing rules for maximizing long-term potentiation. Neuropharmacology 64: 27–36. [DOI] [PMC free article] [PubMed] [Google Scholar]
- Maaswinkel H, Whishaw IQ. 1999. Homing with locale, taxon, and dead reckoning strategies by foraging rats: sensory hierarchy in spatial navigation. Behav Brain Res 99: 143–152. [DOI] [PubMed] [Google Scholar]
- Mankin EA, Sparks FT, Slayyeh B, Sutherland RJ, Leutgeb S, Leutgeb JK. 2012. Neuronal code for extended time in the hippocampus. Proc Natl Acad Sci 109: 19462–19467. [DOI] [PMC free article] [PubMed] [Google Scholar]
- Maviel T, Durkin TP, Menzaghi F, Bontempi B. 2004. Sites of neocortical reorganization critical for remote spatial memory. Science 305: 96–99. [DOI] [PubMed] [Google Scholar]
- McClelland JL, McNaughton BL, O'Reilly RC. 1995. Why there are complementary learning systems in the hippocampus and neocortex: insights from the successes and failures of connectionist models of learning and memory. Psychol Rev 102: 419–457. [DOI] [PubMed] [Google Scholar]
- Morris LS, Kundu P, Dowell N, Mechelmans DJ, Favre P, Irvine MA, Robbins TW, Daw N, Bullmore ET, Harrison NA, et al. 2016. Fronto-striatal organization: defining functional and microstructural substrates of behavioural flexibility. Cortex 74: 118–133. [DOI] [PMC free article] [PubMed] [Google Scholar]
- Muntz WR. 1967. A behavioural study on photopic and scotopic vision in the hooded rat. Vision Res 7: 371–376. [DOI] [PubMed] [Google Scholar]
- Nilsson M, Perfilieva E, Johansson U, Orwar O, Eriksson PS. 1999. Enriched environment increases neurogenesis in the adult rat dentate gyrus and improves spatial memory. J Neurobiol 39: 569–578. [DOI] [PubMed] [Google Scholar]
- Pan SJ, Yang Q. 2010. A survey on transfer learning. IEEE Trans Knowl Data Eng 22: 1345–1359. [Google Scholar]
- Pastalkova E, Itskov V, Amarasingham A, Buzsáki G. 2008. Internally generated cell assembly sequences in the rat hippocampus. Science 321: 1322–1327. [DOI] [PMC free article] [PubMed] [Google Scholar]
- Perkins DN, Salomon G. 1992. Transfer of learning In International encyclopedia of education, pp. 6452–6457. Pergamon Press. [Google Scholar]
- Petersen JD, Chen X, Vinade L, Dosemeci A, Lisman JE, Reese TS. 2003. Distribution of postsynaptic density (PSD)-95 and Ca2+/calmodulin-dependent protein kinase II at the PSD. J Neurosci 23: 11270–11278. [DOI] [PMC free article] [PubMed] [Google Scholar]
- Preston AR, Eichenbaum H. 2013. Interplay of hippocampus and prefrontal cortex in memory. Curr Biol 23: R764–R773. [DOI] [PMC free article] [PubMed] [Google Scholar]
- Renner MJ, Rosenzweig MR. 1987. Enriched and impoverished environments: effects on brain and behavior. Springer, Berlin, Germany. [Google Scholar]
- Restivo L, Vetere G, Bontempi B, Ammassari-Teule M. 2009. The formation of recent and remote memory is associated with time-dependent formation of dendritic spines in the hippocampus and anterior cingulate cortex. J Neurosci 29: 8206–8214. [DOI] [PMC free article] [PubMed] [Google Scholar]
- Rex CS, Chen LY, Sharma A, Liu J, Babayan AH, Gall CM, Lynch G. 2009. Different Rho GTPase-dependent signaling pathways initiate sequential steps in the consolidation of long-term potentiation. J Cell Biol 186: 85–97. [DOI] [PMC free article] [PubMed] [Google Scholar]
- Rosenzweig MR, Bennett EL. 1996. Psychobiology of plasticity: effects of training and experience on brain and behavior. Behav Brain Res 78: 57–65. [DOI] [PubMed] [Google Scholar]
- Sassoé-Pognetto M, Utvik JK, Camoletto P, Watanabe M, Stephenson FA, Bredt DS, Ottersen OP. 2003. Organization of postsynaptic density proteins and glutamate receptors in axodendritic and dendrodendritic synapses of the rat olfactory bulb. J Comp Neurol 463: 237–248. [DOI] [PubMed] [Google Scholar]
- Squire LR, Alvarez P. 1995. Retrograde amnesia and memory consolidation: a neurobiological perspective. Curr Opin Neurobiol 5: 169–177. [DOI] [PubMed] [Google Scholar]
- Stanford SC. 2007. The open field test: reinventing the wheel. J Psychopharmacol 21: 134–135. [DOI] [PubMed] [Google Scholar]
- Thomson EE, Carra R, Nicolelis MAL. 2013. Perceiving invisible light through a somatosensory cortical prosthesis. Nat Commun 4: 1482. [DOI] [PMC free article] [PubMed] [Google Scholar]
- Tse D, Langston RF, Kakeyama M, Bethus I, Spooner PA, Wood ER, Witter MP, Morris RG. 2007. Schemas and memory consolidation. Science 316: 76–82. [DOI] [PubMed] [Google Scholar]
- Tse D, Takeuchi T, Kakeyama M, Kajii Y, Okuno H, Tohyama C, Bito H, Morris RGM. 2011. Schema-dependent gene activation and memory encoding in neocortex. Science 333: 891–895. [DOI] [PubMed] [Google Scholar]
- van Praag H, Kempermann G, Gage FH. 2000. Neural consequences of environmental enrichment. Nat Rev Neurosci 1: 191–198. [DOI] [PubMed] [Google Scholar]
- Vertes RP. 2006. Interactions among the medial prefrontal cortex, hippocampus and midline thalamus in emotional and cognitive processing in the rat. Neuroscience 142: 1–20.16887277 [Google Scholar]
- Walsh RN, Cummins RA. 1976. The open-field test: a critical review. Psychol Bull 83: 482–504. [PubMed] [Google Scholar]
- Wang S-H, Morris RGM. 2010. Hippocampal-neocortical interactions in memory formation, consolidation, and reconsolidation. Annu Rev Psychol 61: 49–79. [DOI] [PubMed] [Google Scholar]
- Whishaw IQ, Hines DJ, Wallace DG. 2001. Dead reckoning (path integration) requires the hippocampal formation: evidence from spontaneous exploration and spatial learning tasks in light (allothetic) and dark (idiothetic) tests. Behav Brain Res 127: 49–69. [DOI] [PubMed] [Google Scholar]
- Whishaw IQ, Gharbawie OA, Clark BJ, Lehmann H. 2006. The exploratory behavior of rats in an open environment optimizes security. Behav Brain Res 171: 230–239. [DOI] [PubMed] [Google Scholar]
Associated Data
This section collects any data citations, data availability statements, or supplementary materials included in this article.