

Abstract
Purpose
To seek a better understanding of the effect of organized capillary flow on the MR diffusion-weighted signal.
Methods
A theoretical framework was proposed to describe the diffusion-weighted MR signal, which was then validated both numerically using a realistic model of capillary network and experimentally in an animal model of isolated perfused heart preparation with myocardial blood flow verified by means of direct arterial spin labeling measurements.
Results
Microcirculation in organized tissues gave rise to an MR signal that could be described as a combination of the bi-exponential behavior of conventional intravoxel incoherent motion (IVIM) theory and diffusion tensor imaging (DTI) -like anisotropy of the vascular signal, with the flow-related pseudo diffusivity represented as the linear algebraic product between the encoding directional unit vector and an appropriate tensor entity. Very good agreement between theoretical predictions and both numerical and experimental observations were found.
Conclusion
These findings suggest that the DTI formalism of anisotropic spin motion can be incorporated into the classical IVIM theory to describe the MR signal arising from diffusion and microcirculation in organized tissues.
Keywords: organized capillary flow, diffusion-weighted MRI, IVIM, perfusion fraction, apparent diffusion coefficient, anisotropic blood flow
INTRODUCTION
The MR signal in the presence of a magnetic field gradient is highly sensitive to the aggregate translational molecular motion of water, which in turn is heavily influenced by the microstructure or microcirculation of the tissue (1,2). For example, cell swelling in acute brain ischemia causes hyperintensity in diffusion-weighted imaging (DWI) (3). The same diffusion contrast exhibits anisotropy in ordered tissues such as brain white matter and myocardium, which can be characterized by means of diffusion tensor imaging (DTI) (4). Furthermore, for highly vascularized tissues, diffusion-like contrast induced by microcirculation has been used as a means to characterize perfusion (5,6).
In general, the diffusion signal can be described as the statistical average of phase dispersion associated with spin displacements. For isotropic systems with Gaussian-distributed Brownian motion, the signal is an exponentially decaying function of the spin motility and the encoding b-value. The same behavior also applies to ordered tissues, except the rate of signal decay depends also on the relative direction of the encoding gradient. In heterogeneous systems that contain spin populations with different motility, depending on the rate of compartmental exchange, the signal is modeled as either a single exponential function with weighted decay constant or superposition of separate exponential functions, in the so-called fast or slow-exchange approximations, respectively (7–9).
Because blood flow in capillaries also results in translational dispersion of water molecules, theories such as the intravoxel incoherent motion (IVIM) have been proposed for characterizing microcirculation using similar DWI methodology (5,6). A key assumption in IVIM theory is that the capillary network consists of identical but randomly oriented straight segments, with blood changing segments rapidly while transiting through the network. In tissues, the MR signal is usually modeled as a bi-exponential function to separate the slower extravascular diffusion from the faster flow-mediated component, whose decay constant is referred to as the pseudo diffusion coefficient (D*). Because of the assumption of random capillary orientation, it is unclear whether the classical IVIM theory can be directly applied to ordered tissues such as the myocardium where the capillary network is both organized and oriented mostly parallel to the myofibers (10–13). A study using IVIM to explain diffusion signals from hearts in vivo reported different vascular compartment sizes for different encoding directions with respect to the myofiber orientation (14).
Theories that incorporate partially coherent microcirculation, namely intravoxel partially coherent motion (IVPCM), have been proposed and used to characterize flow and diffusion in the skeletal muscle (15). The IVPCM model also predicted that organized flow would manifest as different observed vascular volume fraction (VF) along different encoding directions, while D* would remain isotropic. These predictions are somewhat counterintuitive, because VF is a scalar parameter reflecting the physical compartmental sizes, which should be independent of the means of observation. Moreover, because D* reflects the spin translational dispersion, an anisotropic D* is more likely when the underlying spin motion is nonrandom. Clearly, unlike DWI and DTI in ordered tissues, the relationship between IVIM and microcirculation-mediated diffusion signal and organized capillary networks is not completely understood.
The overall aim of the current work is to seek a better understanding of the microcirculation-induced MR signal in organized tissues. In the ensuing sections, a theoretical framework is proposed to describe the MR signal, which is then validated both numerically using a realistic model of capillary network and experimentally using an animal isolated perfused heart preparation (16) with myocardial blood flow verified by means of direct arterial spin labeling (ASL) measurements (17). For consistency, whenever possible the notation and convention of classical IVIM theory are followed in the theoretical formulation and analysis of the observed MR signal.
METHODS
Theory
Effects of Flow in Single and Multiple Tubes
The effects of constant-velocity flow in single straight tubes on the MR signal has long been characterized (18–20). For “plug” flow, e.g., when red blood cells are transiting through capillaries (21), the fluid moves with uniform velocity and generates a constant phase shift. Writing as a modulation factor F, the phase shift arising from flow with average velocity v0, subject to an encoding gradient g(t) with first moment , is given by
| [1] |
In contrast, flow of a fluid without red blood cells in a similar tube is laminar (21), characterized by an inverted parabolic radial velocity profile. The heterogeneous flow creates phase dispersion that results in attenuation of the signal modulation,
| [2] |
Effects of flow in a system of tubes with heterogeneous velocity, in both speed v and orientation φ, can be estimated by the superposition of the contributions of individual single tubes described above (20). In general, for a system whose vessels are described by the probability density function P(v, φ), the net effects for plug and laminar flows can be obtained by their respective expected values:
| [3] |
| [4] |
Special Multitube Systems
In the special case of plug flow inside identically oriented tubes with Gaussian-distributed v, a closed-form analytical solution exists for Fmulti−plug. Suppose the vessels make an angle θ with respect to the motion encoding gradient axis, and that
| [5] |
where vm and σv are the mean and standard deviation of the flow speeds, respectively. Because capillaries are interconnected and are driven by the same overall arteriovenous pressure differential, σv is directly proportional to vm. Consequently, by equating σv = cvm, with c being some constant of proportionality, Eq. [3] leads directly to
| [6] |
Moreover, without loss of generality, suppose Stejskal-Tanner gradient pulses of duration δ and separation Δ are used. Substituting the corresponding m1 = δΔg, and taking the magnitude of the modulation factor, Eq. [6] reduces to
| [7] |
which bears the general form of the signal attenuation exp(−b D*) used in classical IVIM theory. Because the gradient weighting factor b in this case is , the flow-mediated pseudo diffusion coefficient D* is equal to
| [8] |
Following the convention of DTI, and assuming the tubes of the special system are oriented along the x-axis while the motion sensitizing gradient has the directional unit vector ĝ, D* can be expressed as a product ĝ and a special tensor entity,
| [9] |
with . Except for the specific definition of , which depends on the timing of the gradient pulses, the form of Eq. [9] is expected to be valid for other encoding schemes, provided of course that they have nontrivial first moments.
Generalized Multitube Systems in Tissues
For generalized multitube systems with either heterogeneous tube orientations, non-Gaussian speed distribution or laminar flow, a close-form solution for Fmulti−plug or Fmulti−laminar is more difficult to obtain, but its behavior can be studied by means of numerical analysis. To illustrate, consider plug and laminar flow under the extreme conditions when (i) the tubes have identical orientation as the encoding gradient but the speeds originate from Gaussian-distributed capillary diameters and variable input flow rates resulting in different vm distributions, and (ii) vary the tube orientation φ in two-dimensional (2D) (quasi Gaussian) with respect to the gradient encoding direction to simulate different flow anisotropies, while keeping the velocity distribution fixed.
Results of the numerical simulations are shown in Figure 1 and Table 1, with the specific details of the approach and more thorough investigations of configurations and effects of noise provided below in the Methods section. Figure 1a corresponds to the special case discussed above where the analytical solution for Fmulti−plug is available and serves as validation of the numerical approach. By comparing Figures 1b with 1a, and 1d with 1c, it is clear that, like varying flow, different degrees of anisotropy results in different rates of MR signal attenuations. By comparing Figures 1c with 1a, and 1d with 1b, it is also clear that laminar flow generally yields faster signal attenuation than plug flow for the same networks of tubes, as predicted by the sinc term in Eq. [4]. Moreover, as seen in Figures 1c and 1d, the unzdulations normally associated with the sinc function are largely smoothened out by having vm, φ, and implicitly θ as random variables. Table 1 lists the σv and D* obtained for the flow conditions shown in Figures 1a and 1c, and verifies the expected linear and quadratic dependence of σv and D*, respectively, on vm. (The dependence D* on vm is not exactly quadratic due to the fact the flow speed distribution is not perfectly Gaussian.) Overall, although the conditions investigated are not meant to be exhaustive, they indicate that flow in a multi-tube system under a wide variety of configurations likely results in signal attenuation that can be reasonably approximated as an exponentially decaying function in the forms of Eqs. [7] and [8], especially for low b-values.
FIG. 1.
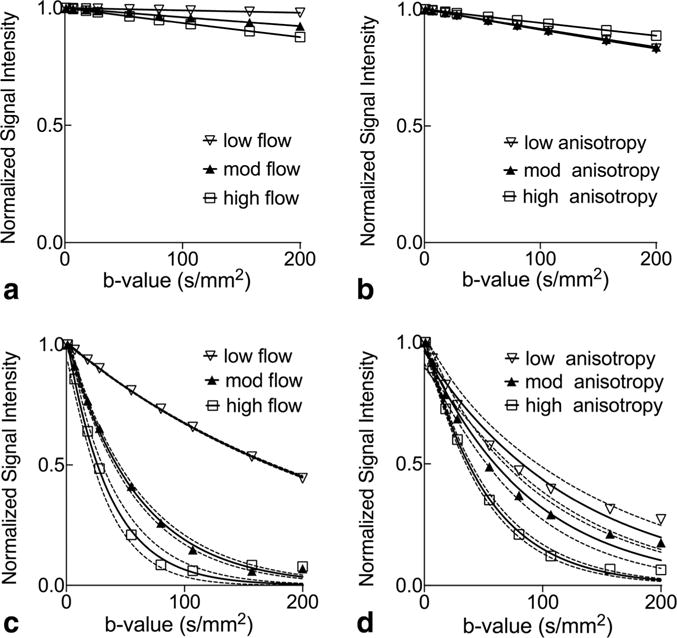
Numerical simulations of flow-induced MR signal attenuation. a: Panels correspond to plug flow of varying speeds in tubes that have identical and same orientation as the encoding gradient. The low, moderate, and high flow settings correspond to mean speeds (vm) of 0.32±0.13, 0.64±0.25, and 0.86±0.34 mm/s, respectively, obtained from Gaussian-distributed capillary radii at different flow rates. b: Plug flow of the same speed distribution as the “high flow” case above in tubes whose orientations have varying degree of anisotropy of quasi Gaussian-distributed capillary orientations with standard deviations of 52° (low anisotropy), 44° (mod anisotropy), and 28° (high anisotropy), respectively. c,d: Results obtained for laminar flow of the same volumetric flow rate under the same configurations as in (a) and (b), respectively. The solid lines denote nonlinear least-squares single exponential fits of the noiseless data points, and the dotted lines denote the 95% confidence interval of the fits.
Table 1.
Quantified Microcirculation Parameters (Mean Velocity vm and SD σv) in Perfectly Aligned Tubes Subjected to Various Input Flow Rates and the Resulting Single Exponential Fitted D* for Both Plug and Laminar Flow Cases
|
vm (mm/s) |
σv (mm/s) |
D* Plug flow (×10−3 mm2/s) |
D* Laminar flow (×10−3 mm2/s) |
|---|---|---|---|
| 0.32 | 0.13 | 0.16 | 4.51 |
| 0.64 | 0.25 | 0.61 | 18.05 |
| 0.86 | 0.34 | 1.07 | 31.48 |
Because in the generalized system flow is no longer constrained to the same orientation and along the x-axis, supposing flow yields exponentially decaying functions with pseudo diffusion coefficients , and along the tissue’s local principal axes in descending order of the dispersion rate, Eq. [9] can be extended to,
| [10] |
where R is the orthonormal rotation matrix for transforming the laboratory frame of reference onto the tissue’s local coordinates. A generalized pseudo diffusion tensor can then be defined as
| [11] |
such that the microcirculation-mediated signal attenuation factor Fmulti−tube for both plug and laminar flow conveniently follows the form
| [12] |
Flow in Organized Tissues
Because the capillary network occupies only 3–25% of the tissue volume (21–24), a realistic tissue model needs to account for both vascular and nonvascular constituents. In the classical IVIM model (5), the diffusion signal in perfused tissues consists of nonexchanging extravascular and intravascular signals, denoted by the subscripts “tissue” and “blood,” respectively, is given as
| [13] |
where f is the vascular volume fraction (i.e., VF), S0 is the reference nonweighted signal, D is the intrinsic apparent diffusion coefficients of the compartment, and F is the flow-mediated attenuation factor. In organized tissues, Dtissue is anisotropic, and can be related to the diffusion tensor of the tissue Dtissue according to well-established relationship Dtissue = ĝT · Dtissue · ĝ. Incorporating the arguments from preceding paragraphs for the vascular compartment, Eq. [13] can then be modified for describing diffusion and flow in organized tissues according to,
| [14] |
where the intrinsic blood and flow induced pseudo diffusivities are combined into an apparent pseudo diffusion tensor , with I being the identity matrix. Equation [14] provides the basis to model the diffusion signal in perfused organized tissues as a function of both encoding factor b and gradient direction ĝ, and to interpret it as having two distinct diffusion tensor components, one associated with each extravascular and vascular compartments. In principle, Eq. [14] allows the tissue and the microcirculation compartments to have different orientations through the specifications of Dtissue and , albeit whether such tissue exists in reality requires further validation with independent histological measurements of vessel orientations.
Numerical Simulation
Realistic Tissue Model
Whereas previous studies (6,15,25) modeled the capillary network simply as a collection of straight tubes with identical radius, length and interior flow, a more realistic model that allowed flexible specifications of the capillary geometries and flow conditions while ensuring conservations of mass and momentum was used in the present work. The realistic network was constructed by first defining a voxel volume and placing in it nodes that represented bifurcations or confluences of capillary segments. Neighboring nodes were connected by capillary segments, which were randomly assigned a Gaussian-distributed diameter of 5 ± 1 mm (mean ± SD) with uniform length of 200 μm (21). The volumetric flow rate in the k-th capillary segment was related to the capillary radius rk and length lk by means of Darcy’s law (conservation of momentum) , where Δpk was the pressure differential at two ends of the capillary, and was the hydraulic resistance of a Newtonian fluid with viscosity η = 3.5 × 10⁻³ Pa · s. Conservation of mass for incompressible fluid was achieved by enforcing at each node. The mean flow speed in each capillary was calculated by means of . In the above manner, capillary networks with various orientation and flow distribution function P(v, φ) were empirically configured by adjusting Δpk (by means of ) and placements of the nodes.
MR Signal Simulation
Numerical experiments to examine the effects of varying each capillary flow speed and degree of orientation anisotropy to the MR signal were conducted using Matlab (Version R2014a, Mathworks, Natick, MA). To investigate flow speed, the same perfectly aligned network was subject to different input flows to achieve vm of speeds 0.32±0.13 (low), 0.64±0.25 (moderate), and 0.86±0.34 mm/s (high). Behaviors of the vascular signal attenuation for θ = 0° are shown in Figure 1c. For varying the degree of anisotropy, vm of 0.86±0.34 mm/s was used in networks having quasi-Gaussian distributed φ with standard deviations of 52° (low), 44° (moderate), and 28° (high anisotropy). The vascular signal attenuation for θ = 0° are shown in Figure 1d. For all networks, the direction of the mean capillary orientation was taken to be the x-axis.
For each capillary configuration described above, Eq. [4], which applied to laminar flow found in perfused isolated hearts, was used along with the given P(v, φ) to generate the flow-induced signal attenuation factor Fmutli−laminar. Relative absolute encoding angle θ ranged from 0° (i.e., oriented parallel to the x-axis) to 90° (y-axis) in 10° increments, with rectangular gradient pulses with δ of 5 ms, Δ of 15 ms, and g ranging from 0 to 200 mT/m in 13 exponentially spaced steps. Subsequently, using Dtissue eigenvalues of 1.5, 1.0, and 1.0 × 10⁻³ mm2/s, f of 15% (26), and Dblood of 3.0 × 10⁻³ mm2/s, signal intensities S(b, ĝ) were synthesized according to
| [15] |
Gaussian noise was added to achieve signal-to-noise ratio (SNR) of 100, similar to that found in the experimental study. For each encoding direction and level, the capillary network and corresponding MR signal were generated 50 times then averaged to mimic the behaviors of as many neighboring and similar voxels in a region of interest (ROI) that contained minor structural variations.
Data Analysis
The resulting averaged MR signal for each capillary configuration and relative encoding angle θ, as a function of the b value, was analyzed using to the “two-step” parameter estimation approach commonly used in IVIM studies (27). First, nonlinear least-squares single-exponential fit was performed on signal intensities obtained for b values greater than 200 s/mm2 to estimate the scalar Dtissue. The choice of the minimum b > 200 was taken similar to a previous study in the heart (14), and the implication of this choice on the measured IVIM parameters will be revisited in the discussion section below. Subsequently, with Dtissue fixed, a two-parameter fit was performed on signal intensities over the full range of b values using Eq. [14] to yield f and . The parameters were repeatedly estimated 7 times (each with newly generated capillary networks and signals) to represent results obtained from different subjects, averaged and plotted as functions of |θ|, along with results obtained without adding image noise to serve as basis for reference.
Experimental Validation
Isolated Heart Preparation
All animal procedures were approved by the University of Utah Institutional Animal Care and Use Committee. Retired breeder male guinea pigs (n = 7; 900 ± 100 g, mean ± SEM) were anesthetized using pentobarbital sodium (30 mg/kg, i.p.) and their hearts were rapidly excised. Using a MRI-compatible Langendorff apparatus as described previously (16), the heart was immediately perfused retrogradely by means of the aorta with Tyrode’s solution consisting of (in mM) 1.25 CaCl2, 140 NaCl, 4.6 KCl, 5.5 dextrose, 0.7 MgCl2, and 10 HEPES at 7.40 pH and oxygenated with 100% O2. Myocardial contraction was partially inhibited by an electromechanical uncoupler, 2,3-butanedione monoxime (7.5 mM). Bovine serum albumin (0.4% wt/wt) was added to the perfusate to minimize interstitial edema (28).
A raised, pump-fed (Masterflex C/L, Fisher Scientific, Barrington, IL) reservoir was used both as a means to trap air bubbles and to adjust the aortic perfusion pressure, which was continuously recorded by means of a pressure transducer (SPR882 Pressure Probe, AD Instruments, Colorado Springs, CO) placed in the perfusion line immediately upstream of the aorta. MR imaging experiments were conducted at two perfusion settings: (a) normal (physiologic) perfusion, with flow and pressure set at 20 mL/min and 47 ± 4 mmHg (mean ± SEM; n = 7), respectively, and (b) low perfusion, with pump turned off and pressure of 20 ± 4 mmHg. (Perfusion did not completely stop when the pump was turned off due to residual perfusate and hydrostatic pressure remaining in the perfusion line.) The perfused heart was completely immersed along with a saline-filled sealed tube used as reference standard in a chamber inside the imaging RF coil. Temperature inside the chamber was maintained by means of the warm inflow perfusion line at 36.0 ± 0.2°C during normal flow, but dropped to 33.6 ± 0.3°C when flow was stopped. To reduce bulk motion artifacts, the heart was arrested with 20 mM potassium in the Tyrode solution (described above) immediately before imaging at each flow rate. Before changing the flow setting, the heart was perfused normally with Tyrode’s solution and allowed to beat for ~10 min to ascertain its viability.
MRI Acquisition
MRI experiments were conducted using a custom-built loop-gap RF resonator interfaced to a Bruker Biospec 7 Tesla (T) scanner (Bruker Biospin, Ettlingen, Germany). For each flow setting, 3.0 mm-thick, 38 × 30 mm2 field of view cardiac short-axis images at the center of the heart at identical slice location were obtained, including (a) a FLASH scan (92 ms repetition time [TR], 6 ms echo time [TE], 30° flip angle, 256 × 256 matrix size) for anatomical visualization, (b) spin-echo flow-sensitive inversion recovery (FAIR) scan with single-shot echo planar imaging (EPI) readout (10 s TR; 35 ms TE; 128 × 100 matrix size), and alternating slice-selective and nonselective inversion preparation and 22 inversion times ranging from 30 ms to 10 s, for ASL quantification of flow, and (c) interleaved four-shot spin-echo diffusion-weighted EPI scans (2 s TR; 25 ms TE; 164 × 128 matrix size) encoded in each slice-selection and readout directions with 13 b-values (nominally 1, 7, 18, 28, 55, 80, 107, 157, 200, 310, 513, 766, and 1020 s/mm2). Total scan time for the FLASH, FAIR and diffusion-weighted scans was approximately 20 min at each flow setting.
Data Analysis
For each scanned heart, the left ventricular (LV) circumferential fiber region, readily identified as the ring-shaped hyperintense area in heavily weighted diffusion-weighted images encoded in the cardiac long axis (or slice-selection axis), was manually delineated, and divided into four ROIs by binning the pixels according to the absolute angle the fiber orientation made with respect to the image horizontal (readout) axis, yielding nominal |θ| of 0°, 30°, 60°, and 90°.
For each flow setting, Dtissue, f and were estimated using the ROI-averaged diffusion-weighted signal intensities encoded in the readout direction obtained by means of the two-step IVIM analysis described above. To account for the tissue temperature difference, Dtissue of the myocardium was normalized using the mean apparent diffusion coefficient obtained for the saline phantom. Normalization of was not required because it reflected mostly pressure-driven flow and not thermal Brownian motion. For each flow setting, IVIM parameter as a function of |θ| was compared by means of one-way repeated-measures analysis of variance (ANOVA) (Graph-Pad Prism 5.0a, GraphPad Software Inc., La Jolla, CA). In the Bonferroni-corrected post hoc tests, because the approximate capillary orientation was already known, hence, to reduce the number of comparison, only values observed at |θ|= 30°, 60°, and 90° were compared with that at |θ| = 0° for a total of 3 tests. Significance for all statistical tests was set at overall P < 0.05.
Finally, myocardial “blood” flow (MBF) maps were generated as described previously (17) using slice-selective and nonselective longitudinal relaxation times estimated from pixel-by-pixel nonlinear least-squares fitting of the corresponding FAIR intensities by means of
| [16] |
where 0.9 mL/g was used for the myocardial blood-tissue partition coefficient λ, and the obtained for the fluid in the ventricular cavity was taken as . MBF was averaged over the entire LV area. As independent validation of the MBF measurement, the MBF was correlated to the aortic input pressure, which is proportional to the myocardial blood flow assuming the myocardial capillary bed resistance is approximately constant (21,29). Subsequently, ASL-based MBF measurements were used to obtain scatter plots with each of the above measured IVIM parameters , f, and Dtissue. To quantify the relationships, the plot of D* was fitted to a quadratic as indicated by Eq. [8], whereas the other parameters (VF and tissue ADC) were each empirically fitted to a line.
RESULTS
Figure 2 shows the plots obtained in the numerical experiments for , f and Dtissue in the same capillary networks as functions of the relative encoding angle θ for different flow speeds. Overall, and Dtissue exhibit the expected half-cosine behavior from the square of directional cosine. With respect to the flow speed, the amplitude of is clearly nonlinear, whereas that of Dtissue appears constant. The values for at |θ| = 0° were 9.3, 21.4 and 35.6 × 10⁻³ mm2/s for low, moderate, and high flows, respectively, which are consistent with D* reported in Table 1 when accounting for Dblood. Moreover, compared with the theoretical value of 15%, the volume fraction f is both underestimated and θ-dependent, with markedly larger underestimation associated with either smaller or larger θ. Because the underlying capillary network configuration and flow conditions in Table 1 and Figure 2 are identical, and that only the latter contains tissue compartmental modeling and two-stage parameter fitting, these discrepancies more likely reflect systematic limitations of the compartmental mixing and fitting techniques than the flow modeling.
FIG. 2.
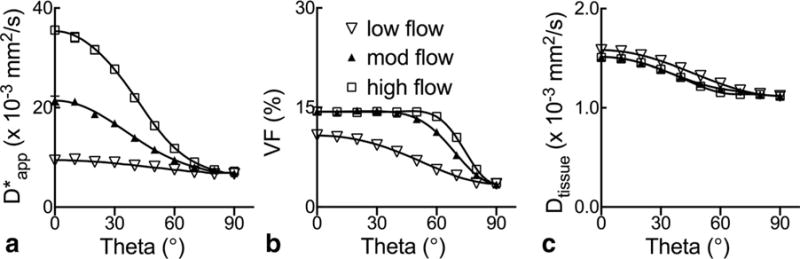
a–c: Anisotropy of tissue IVIM parameters in numerical analysis of laminar flow in the same perfectly aligned capillary network as a function of encoding angle θ. The low, moderate, and high flow settings correspond to mean speeds (vm) of 0.32±0.13, 0.64±0.25, and 0.86±0.34 mm/s, respectively, obtained from Gaussian-distributed capillary radii at different flow rates. Behaviors of the vascular signal attenuation for θ = 0° are shown in Figure 1c. Solid lines represent results obtained in the noiseless simulation.
Figure 3 shows the graphs of , f and Dtissue similarly obtained for capillary networks of different degrees of anisotropy but identical flow distribution. In general, and Dtissue follow the same wavy orientation-dependent behaviors as observed in Figure 2, and f also appears slightly underestimated. Considering that should be isotropic in a network of completely randomly oriented capillaries, not surprisingly, the amplitude of variation across θ diminishes when the degree of anisotropy or alignment decreases, which manifests as decreasing for smaller |θ| and the opposite at larger |θ|. This behavior is consistent with the flow-induced signals seen in Figure 1d, where |θ| = 0°.
FIG. 3.
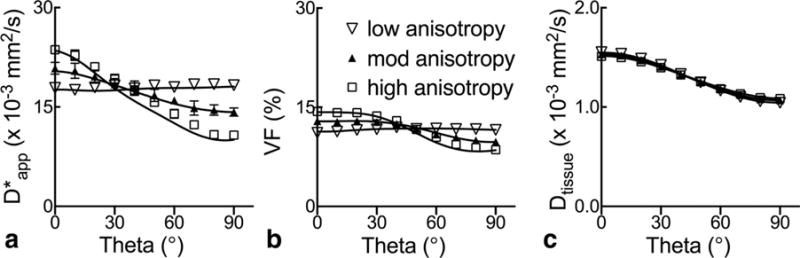
a–c: Orientation dependence of tissue IVIM parameters in numerical analysis of same laminar flow distribution (vm = 0.86±0.34 mm/s) in capillary networks of varying degrees of anisotropy. The low, moderate, and high anisotropy settings correspond to quasi Gaussian-distributed capillary orientations with standard deviations of 52°, 44°, and 28°, respectively. Behaviors of the vascular signal attenuation for θ = 0° are shown in Figure 1d. Solid lines represent results obtained in the noiseless simulation.
Representative MR images and signal decay curves obtained from the perfused isolated heart experiments appear in Figures 4 and 5, respectively. Figure 4 includes a FLASH image revealing the general morphology, and heavily diffusion-weighted images sensitized in each readout and slice directions. Figure 5 shows that all signals observed in parallel and perpendicular directions to the fibers, and at normal and low flow, exhibit non-monoexponential behavior as functions of the encoding b-value. However, departure from nonmonoexponential behavior is greatest for signal encoded in the parallel direction at normal flow, which is suggestive of not only a large presence of the flow-mediated component, but also its anisotropy.
FIG. 4.
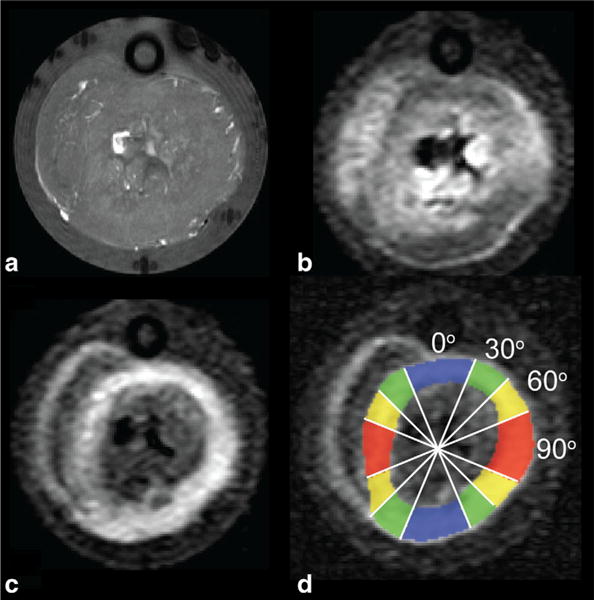
MRI of a representative isolated perfused heart. a–c: Images were obtained from a FLASH scan showing the gross morphology (a), and diffusion-weighted scans encoded in each of readout (horizontal) axis (b), and slice (in–out of page) direction (c). d: The latter is used to delineate the LV circumferential fiber region and bin the pixels into 4 approximately equal-size regions-of-interest according to the circumferential location and the relative absolute angle the fibers made with respect to the readout (horizontal) gradient direction.
FIG. 5.
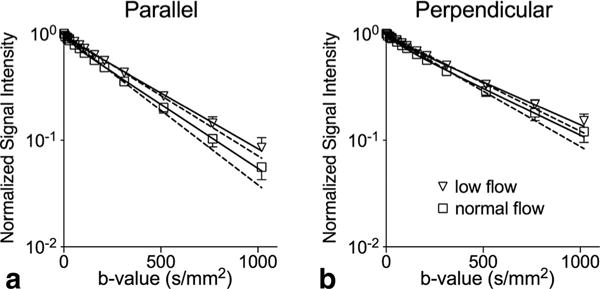
Experimental diffusion-weighted signal intensities in a representative isolated heart. a,b: Normalized signal intensities over the selected ROIs (mean ± SD) measured for diffusion encoded parallel (a) and perpendicular (b) to the LV circumferential fiber direction are plotted on a semi-log scale. Inverted triangles and open squares correspond to low and normal flow settings, respectively. Solid and dotted lines represent IVIM (two-compartment) and mono-exponential fits, respectively, of the data points.
Figure 6 displays the graphs of , f and Dtissue as functions of discretized |θ| observed at normal and low flow in the perfused myocardium. Compared with the value at |θ| = 0°, the experimental is significantly reduced for the two highest angles at normal flow, whereas no significant change is seen for all |θ| at low flow. The volume fraction f remains unchanged for different |θ|, and is uniformly higher in normal flow than low flow, in agreement with the theory and that the blood volume is known to change proportionally to myocardial perfusion (23). In contrast, Dtissue appears largely unchanged between the two flow settings and is significantly reduced for the two higher encoding angles at both flow settings, consistent with its extravascular origin and the well-known anisotropy of the myocardial microstructure in the DTI literature (30). Overall, within the noise of the experimental data, these observations are qualitatively consistent with the simulated results obtained for different flow speeds shown in Figure 2, and are in very good agreement with the key predictions of the proposed theory.
FIG. 6.
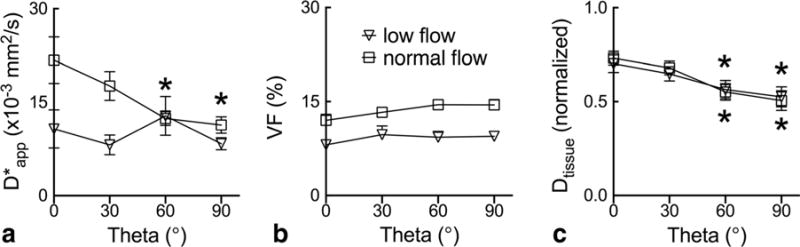
a–c: Anisotropy of experimentally observed IVIM parameters in isolated perfused hearts. The group averaged parameters (mean ± SEM; n = 7) are plotted as a function of the nominal relative encoding angle obtained as illustrated in Figure 4d. Entries with asterisks (*) are significantly different from values observed at |θ| = 0° for each flow setting according to one-way repeated-measures ANOVA, which include under normal flow at |θ| of 60° and 90°, and Dtissue under both normal and low flow at |θ| of 60° and 90°.
Representative T1 and MBF maps associated with the ASL experiment obtained at low and normal flow are shown in Figure 7. Consistent with the perfusion states, the average MBF obtained from all hearts decreased from 85 ± 7 at normal flow to 5 ± 3 mL/min/100 g (mean ± SEM; n = 7; P < 0.01) when the pump was turned off. Figure 8 shows a good correlation between MBF measurements and aortic pressure (Pearson r = 0.78; P < 0.01), which suggests that, despite their relative noisiness, the ASL quantities are a reasonable first-order approximation of the underlying blood flow. The scatter plots between MBF and each , f and Dtissue for different encoding angles |θ| are shown in Figure 9. Due to the experimental noise, modest coefficients of determination were found for and f. Nevertheless, the predicted decrease in the concavity of as |θ| increases is apparent. There also appears a trend of increasing slope of f as |θ| increases, which agrees with the underestimation of the parameter seen in Figure 2. Lastly, as expected, no obvious trend or significant dependence on MBF was found for Dtissue, which demonstrates the relative reliability of the two-stage fitting technique for capturing microstructural information of the extravascular compartment in the perfused myocardium.
FIG. 7.
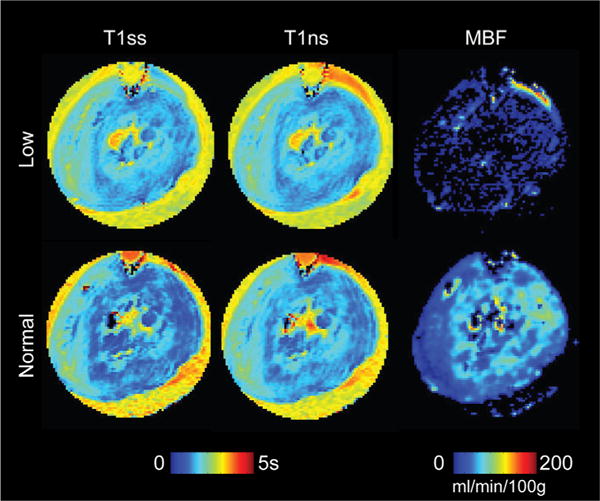
Arterial spin labeling MRI of a representative isolated heart. Slice-selective and nonselective FAIR images are used to obtain the falsecolor-coded longitudinal relaxation and maps, respectively, and subsequently the myocardial blood flow (MBF) map, for both normal and low flow settings.
FIG. 8.
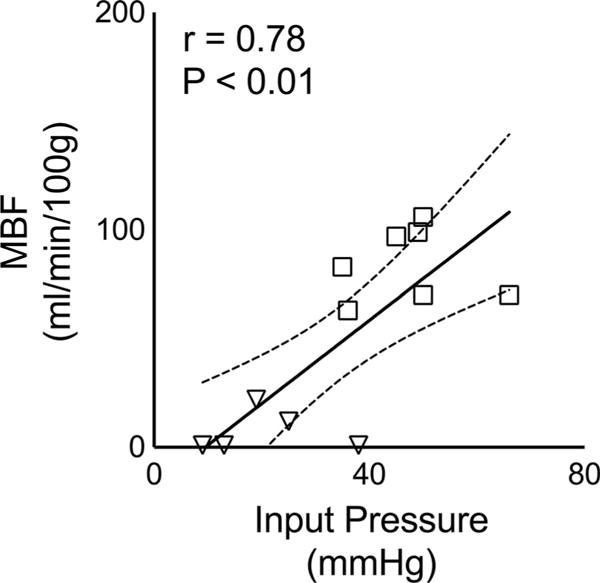
Scatter plot between ASL-based MBF measurements in a ROI spanning whole heart slice (mean ± SEM) versus (aortic) input pressure in each heart. Open squares correspond to normal flow rate while inverted triangles correspond to low flow setting. Linear regression solid line and 95% confidence bands (dotted lines) are overlaid over the data points. Pearson correlation coefficient (r) is reported, along with the P value in top left corner, shows strong correlation between mean ASL-based MBF measurements and the recorded aortic pressures. Note that the SEM error bars are too small to be seen.
FIG. 9.
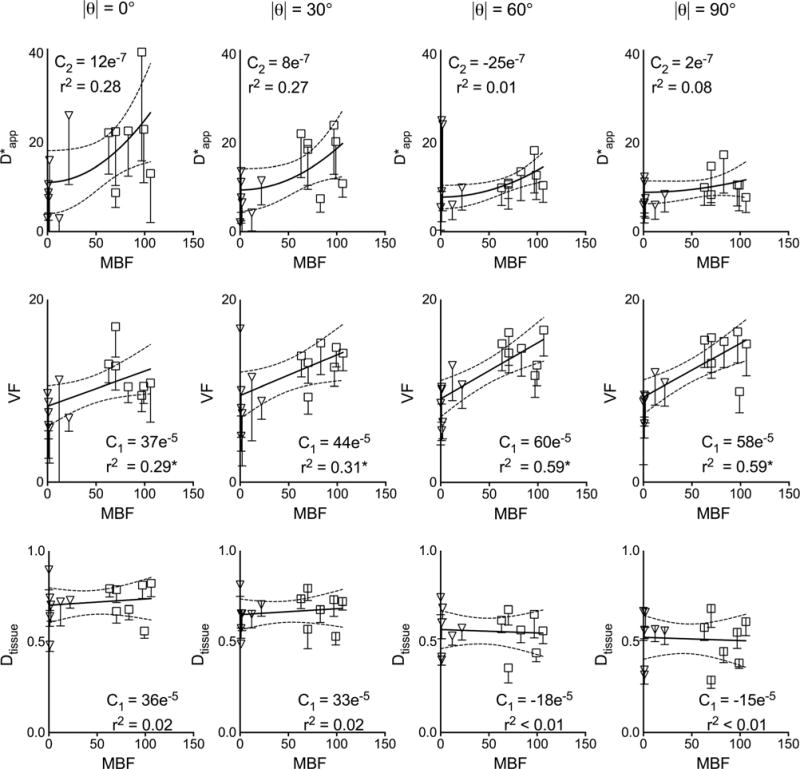
IVIM parameters graphed as functions of ASL-derived MBF for different encoding angles. Measurements obtained at both low (inverted triangles) and normal (open squares) flow setting are combined in the scatter plots. The and the other parameters are fitted to a quadratic and straight (solid) line respectively, with the order of the polynomial indicated in the subscripts of the C coefficients. Error bars obtained from IVIM fitting are shown with each data point, and the 95% confidence interval dotted bands of the regression fit are also displayed. The coefficient of determination r2 is reported under each coefficient (with asterisks in 2nd row denote P < 0.05 for linear regression). Units of MBF is mL/min/100 g, ×10−3 mm2/s, Dtissue normalized units, and VF is % of total volume.
DISCUSSION
The current work presents a theoretical framework based on a combination of familiar IVIM and DTI formulations as stated in Eq. [14] to describe the anisotropy of microcirculation-induced diffusion signal. Like in IVIM, the signal is modeled as one that comprises separable parts from each vascular and nonvascular compartment. And similar to DTI, contribution of each compartment is described by an apparent diffusivity equal to the linear algebraic product between the motion-encoding unit vector and the appropriate tensor entity associated with the direction of the local microstructure or microvasculature. Results of both simulation and empirical experiments (e.g., Figures 2 and 6, respectively) confirmed the dependence of the flow-mediated signal on the relative encoding angle and speed of flow. The simulations (Fig. 3) also verified the dependence of the signal on the degree of anisotropy or alignment of the microvasculature. Overall, the behaviors of the microcirculation-induced signal observed numerically and experimentally are in very good agreement with predictions of the proposed theoretical framework.
The orientation-dependent flow effect on IVIM has been previously observed in the heart and skeletal muscle at physiologic conditions (14,15). The main discrepancy between the current work and previous study of the perfused myocardium (14) or formulation of partially coherent system (15) exists in the interpretation of the microcirculation-induced signal attenuation factor (i.e., ||Fmulti−tube||). Previously, the attenuation factor was interpreted as part of the vascular fraction, giving it an apparent anisotropic behavior. In the present study, the dependence of the attenuation factor on the encoding gradient strength (i.e., b-value) and the empirical exponential nature of the attenuation were combined into D*. Consequently, it became possible to express D* as a function of the gradient encoding direction, leaving the vascular volume fraction constant. The authors believe that both approaches are equally valid, except that by adopting the familiar DTI formalism, the current framework provides a more intuitive and convenient alternative for describing the anisotropy of the microcirculation-induced signal. However, because the experimental validation experiment tested end points of normal flow range (i.e., “physiologic” and “oligemia”), and that the observed changes in were smaller than those observed in ASL at different flow conditions, further investigation is needed to explain the apparent mismatch between the two techniques.
Nonetheless, the anisotropic behavior of flow-mediated signal is expected to have profound implications for in vivo DTI at least in the myocardium, which is increasingly used thanks to recent technical advances (31–33). Because the myocardial microvasculature and myofibers are aligned (10), flow is expected to have little or no impact on the observed DTI directionality (e.g., myocardial fiber direction). However, because D* is most pronounced in the direction of flow and fibers, and that conventional DTI is tantamount to fitting the apparent diffusivity that includes flow effects in each encoding direction to a single exponential decay, the flow-induced signal will contribute to an artificially inflated first eigenvalue of the diffusion tensor in the perfused myocardium, which in turn yield an overestimated fractional anisotropy (FA). The latter may be of particularly concern because it can mask the small FA reduction that is often linked to myocardial pathology, including fiber disarray (34) and fibrosis (35). To mitigate the adverse impact, as essentially done in the two-stage fitting approach, relatively large diffusion-weighting b-values can be used to take advantage of the faster decay of the flow-induced signal (36). Because higher b-values are often associated with heightened bulk motion sensitivity, a more practical alternative may be to use encoding schemes such as bipolar gradient pulses that have zero first moments (32,37) or compensated higher order motion (33).
As seen in the simulation results, a potential practical limitation of the proposed theoretical framework exists in either or a combination of the two-compartment signal modeling and the two-stage parameter fitting approach used. In the latter, residual flow-induced signal at higher b-values is interpreted as part of the tissue signal. Although the additional contribution yields only a small overestimation of Dtissue due to the relatively large size of the tissue compartment, the overestimated diffusivity has an amplified effect and leads to an underestimation of the vascular volume fraction accompanied by overestimation of the flow-related observed in Figures 2 and 3. This is confirmed by additional simulation analysis shown in Supporting Table S1, which is available online and indicates that progressively reducing the minimum b-values used in the segmented fit has a larger impact on underestimating VF and overestimating than overestimating Dtissue: Furthermore, using the ASL-MBF measurements at normal flow (85 mL/min/100 g) yields extrapolated vm of 0.35 mm/s (for a voxel of 0.3 mm × 0.3 mm × 3 mm containing parallel capillaries with 12% volume fraction as shown in Figure 6b at |θ| = 0°), which seems underestimated compared with the values reported in Table 1 at moderate flow. This likely suggests that the experimental VF was overestimated for not accounting the relaxation times differences between the intravascular and tissue compartments (38). The degree in which these concerns apply to the analysis of experimental data depends on the appropriateness of the two-compartment mixing approximation for modeling the signal empirically observed in organized tissues, and whether a better approach for the multi-parameter fitting can be found. Because of the above reasons, caution is warranted in interpreting at least the scalar quantitative characterization of the anisotropy of flow-induced diffusion signal.
In conclusion, a theoretical framework using conventional IVIM and DTI formulations to describe the anisotropy of microcirculation-mediated diffusion signal was presented. The theory predicted that the pseudo diffusivity measured using conventional IVIM approach can be described as the linear algebraic product between the encoding directional unit vector and an appropriate tensor entity, similar to DTI. In doing so, the anisotropy of the signal is manifested in the apparent rates of diffusion, and not in the vascular volume fraction. Within the limits of the noise and the used signal modeling and fitting techniques, the proposed theory was validated by means of both numerical simulations and empirical observations in perfused isolated heart experiments. These findings suggest that the presented theory can provide a convenient alternative to characterize diffusion and microcirculation in organized tissues, which has timely and significant implications for in vivo cardiac DTI.
Supplementary Material
Supporting Table S1. Simulated tissue diffusivity (Dtissue), vascular fraction (VF), and pseudo diffusion coefficient at different values of the minimum b used to extrapolate in the segmented fitting analysis routine at the low velocity case (v↓m=0.3±0.1mm/s). Units for diffusivities are (×10−3 mm2/s) and % volume for VF.
Acknowledgments
National Institutes of Health (NIH)
Grant numbers: R01 HL092055, S10 RR023017.
Footnotes
SUPPORTING INFORMATION
Additional Supporting Information may be found in the online version of this article.
References
- 1.Stejskal EO, Tanner JE. Spin diffusion measurements: spin echoes in the presence of a time-dependent field gradient. J Chem Phys. 1965;42:288. [Google Scholar]
- 2.Stejskal EO. Use of spin echoes in a pulsed magnetic-field gradient to study anisotropic, restricted diffusion and flow. J Chem Phys. 1965;43 [Google Scholar]
- 3.Moseley ME, Cohen Y, Mintorovitch J, Chileuitt L, Shimizu H, Kucharczyk J, Wendland MF, Weinstein PR. Early detection of regional cerebral ischemia in cats: comparison of diffusion- and T2-weighted MRI and spectroscopy. Magn Reson Med. 1990;14:330–3346. doi: 10.1002/mrm.1910140218. [DOI] [PubMed] [Google Scholar]
- 4.Basser PJ, Mattiello J, LeBihan D. MR diffusion tensor spectroscopy and imaging. Biophys J. 1994;66:259–267. doi: 10.1016/S0006-3495(94)80775-1. [DOI] [PMC free article] [PubMed] [Google Scholar]
- 5.Le Bihan D, Breton E, Lallemand D, Grenier P, Cabani E, Jeantet L. MR imaging of intravoxel incoherent motions: application to diffusion and perfusion in neurologic disorders. Radiology. 1986;161:401–407. doi: 10.1148/radiology.161.2.3763909. [DOI] [PubMed] [Google Scholar]
- 6.Le Bihan D, Breton E, Lallemand D, Aubin M-L, Vignaud J, Laval-Jeantet M. Separation of diffusion and perfusion in intra voxel incoherent motion MR imaging. Radiology. 1988;168:497–505. doi: 10.1148/radiology.168.2.3393671. [DOI] [PubMed] [Google Scholar]
- 7.Kärger J. NMR self-diffusion studies in heterogeneous systems. Adv Colloid Interface Sci. 1985;23:129–148. [Google Scholar]
- 8.Niendorf T, Dijkhuizen RM, Norris DG, van Lookeren Campagne M, Nicolay K. Biexponential diffusion attenuation in various states of brain tissue: implications for diffusion-weighted imaging. Magn Reson Med. 1996;36:847–857. doi: 10.1002/mrm.1910360607. [DOI] [PubMed] [Google Scholar]
- 9.Hsu EW, Buckley DL, Bui JD, Blackband SJ, Forder JR. Two-component diffusion tensor MRI of isolated perfused hearts. Magn Reson Med. 2001;45:1039–1045. doi: 10.1002/mrm.1138. [DOI] [PubMed] [Google Scholar]
- 10.Poole D, Mathieu-Costello O. Analysis of capillary and subendocardium geometry in rat subepicardium. Am J Physiol Hear Circ Physiol. 1990;259:204–210. doi: 10.1152/ajpheart.1990.259.1.H204. [DOI] [PubMed] [Google Scholar]
- 11.Vignaud A, Rodriguez I, Ennis DB, DeSilva R, Kellman P, Taylor J, Bennett E, Wen H. Detection of myocardial capillary orientation with intravascular iron-oxide nanoparticles in spin-echo MRI. Magn Reson Med. 2006;55:725–730. doi: 10.1002/mrm.20827. [DOI] [PMC free article] [PubMed] [Google Scholar]
- 12.Hsu EW, Buckley DL, Bui JD, Blackband SJ, Forder JR. Two-component diffusion tensor MRI of isolated perfused hearts. Magn Reson Med. 2001;45:1039–1045. doi: 10.1002/mrm.1138. [DOI] [PubMed] [Google Scholar]
- 13.Kaneko N, Matsuda R, Toda M, Shimamoto K. Three-dimensional reconstruction of the human capillary network and the intramyocardial micronecrosis. Am J Physiol Heart Circ Physiol. 2011;300:H754–H761. doi: 10.1152/ajpheart.00486.2010. [DOI] [PubMed] [Google Scholar]
- 14.Callot V, Bennett E, Decking UKM, Balaban RS, Wen H. In vivo study of microcirculation in canine myocardium using the IVIM method. Magn Reson Med. 2003;50:531–540. doi: 10.1002/mrm.10568. [DOI] [PMC free article] [PubMed] [Google Scholar]
- 15.Karampinos DC, King KF, Sutton BP, Georgiadis JG. Intravoxel partially coherent motion technique: characterization of the anisotropy of skeletal muscle microvasculature. J Magn Reson Imaging. 2010;31:942–953. doi: 10.1002/jmri.22100. [DOI] [PubMed] [Google Scholar]
- 16.Poelzing S, Veeraraghavan R. Heterogeneous ventricular chamber response to hypokalemia and inward rectifier potassium channel blockade underlies bifurcated T wave in guinea pig. Am J Physiol Heart Circ Physiol. 2007;292:H3043–H3051. doi: 10.1152/ajpheart.01312.2006. [DOI] [PubMed] [Google Scholar]
- 17.Fidler F, Wacker C, Dueren C, Weigel M, Jakob P, Bauer W, Haase A. Myocardial perfusion measurements by spin-labeling under different vasodynamic states. J Cardiovasc Magn Reson. 2004;6:509–516. doi: 10.1081/jcmr-120030571. [DOI] [PubMed] [Google Scholar]
- 18.Callaghan PT, Codd SL, Seymour JD. Spatial coherence phenomena arising from translational spin motion in gradient spin echo experiments. Concepts Magn Reson. 1999;11:181–202. [Google Scholar]
- 19.Codd S, Manz B, Seymour J, Callaghan P. Taylor dispersion and molecular displacements in Poiseuille flow. Phys Rev E. 1999;60:R3491–R3494. doi: 10.1103/physreve.60.r3491. [DOI] [PubMed] [Google Scholar]
- 20.Ahn CB. The effects of random directional distributed flow in nuclear magnetic resonance imaging. Med Phys. 1987;14:43. doi: 10.1118/1.596093. [DOI] [PubMed] [Google Scholar]
- 21.Levick JR. An introduction to cardiovascular physiology. London, UK: Arnold; 2001. [Google Scholar]
- 22.Leenders KL, Perani D, Lammertsma AA, Heather JD, Buckingham P, Healy MJ, Gibbs JM, Wise RJ, Hatazawa J, Herold S. Cerebral blood flow, blood volume and oxygen utilization. Normal values and effect of age Brain. 1990;113(Pt 1):27–47. doi: 10.1093/brain/113.1.27. [DOI] [PubMed] [Google Scholar]
- 23.Toyota E, Fujimoto K, Ogasawara Y, Kajita T, Shigeto F, Matsumoto T, Goto M, Kajiya F. Dynamic changes in three-dimensional architecture and vascular volume of transmural coronary microvasculature between diastolic- and systolic-arrested rat hearts. Circ Res. 2002;105:621–626. doi: 10.1161/hc0502.102964. [DOI] [PubMed] [Google Scholar]
- 24.Luciani A, Vignaud A, Cavet M, Van Nhieu J, Mallat A, Ruel L, Laurent A, Deux JF, Brugieres P, Rahmouni A. Liver cirrhosis: intravoxel incoherent motion MR imaging — pilot study. Radiology. 2008;249:891–899. doi: 10.1148/radiol.2493080080. [DOI] [PubMed] [Google Scholar]
- 25.Wetscherek A, Stieltjes B, Laun FB. Flow-compensated intravoxel incoherent motion diffusion imaging. Magn Reson Med. 2015;74:410–419. doi: 10.1002/mrm.25410. [DOI] [PubMed] [Google Scholar]
- 26.Delattre BMA, Viallon M, Wei ÞH, Zhu YM, Feiweier T, Pai VM, Wen H, Croisille P. In vivo cardiac diffusion-weighted magnetic resonance imaging quantification of normal perfusion and diffusion coefficients with intravoxel incoherent motion imaging. Invest Radiol. 2012;47:662–70. doi: 10.1097/RLI.0b013e31826ef901. [DOI] [PMC free article] [PubMed] [Google Scholar]
- 27.Federau C, Meuli R, O’Brien K, Maeder P, Hagmann P. Perfusion measurement in brain gliomas with intravoxel incoherent motion MRI. AJNR Am J Neuroradiol. 2014;35:256–262. doi: 10.3174/ajnr.A3686. [DOI] [PMC free article] [PubMed] [Google Scholar]
- 28.Arbel ER, Prabhu R, Ramesh V, Pick R, Glick G. A perfused canine right bundle branch-septal model for electrophysiological studies. Am J Physiol Hear Circ Physiol. 1979;236:H379–H384. doi: 10.1152/ajpheart.1979.236.2.H379. [DOI] [PubMed] [Google Scholar]
- 29.Heusch G. Heart rate in the pathophysiology of coronary blood flow and myocardial ischaemia: benefit from selective bradycardic agents. Br J Pharmacol. 2008;153:1589–1601. doi: 10.1038/sj.bjp.0707673. [DOI] [PMC free article] [PubMed] [Google Scholar]
- 30.Hsu EW, Muzikant AL, Matulevicius SA, Penland RC, Henriquez CS. Magnetic resonance myocardial fiber-orientation mapping with direct histological correlation. Am J Physiol Hear Circ Physiol. 1998;274(Pt 2):H1627–H1634. doi: 10.1152/ajpheart.1998.274.5.H1627. [DOI] [PubMed] [Google Scholar]
- 31.Nielles-Vallespin S, Mekkaoui C, et al. In vivo diffusion tensor MRI of the human heart: reproducibility of breath-hold and navigator-based approaches. Magn Reson Med. 2012;70:454–465. doi: 10.1002/mrm.24488. [DOI] [PMC free article] [PubMed] [Google Scholar]
- 32.Gamper U, Boesiger P, Kozerke S. Diffusion imaging of the in vivo heart using spin echoes-considerations on bulk motion sensitivity. Magn Reson Med. 2007;57:331–337. doi: 10.1002/mrm.21127. [DOI] [PubMed] [Google Scholar]
- 33.Welsh C, Di Bella E, Hsu E. Higher-order motion-compensation for in vivo cardiac diffusion tensor imaging in rats. IEEE Trans Med Imaging. 2015;34:1843–1853. doi: 10.1109/TMI.2015.2411571. [DOI] [PMC free article] [PubMed] [Google Scholar]
- 34.Chen J, Song S-K, Liu W, McLean M, Allen JS, Tan J, Wickline SA, Yu X. Remodeling of cardiac fiber structure after infarction in rats quantified with diffusion tensor MRI. Am J Physiol Heart Circ Physiol. 2003;285:H946–H954. doi: 10.1152/ajpheart.00889.2002. [DOI] [PubMed] [Google Scholar]
- 35.Abdullah OM, Drakos SG, Diakos NA, et al. Characterization of diffuse fibrosis in the failing human heart via diffusion tensor imaging and quantitative histological validation. NMR Biomed. 2014;27:1378–1386. doi: 10.1002/nbm.3200. [DOI] [PMC free article] [PubMed] [Google Scholar]
- 36.Scott AD, Ferreira PF, Nielles-Vallespin S, Gatehouse P, McGill LA, Kilner P, Pennell DJ, Firmin DN. Optimal diffusion weighting for in vivo cardiac diffusion tensor imaging. Magn Reson Med. 2015;74:420–430. doi: 10.1002/mrm.25418. [DOI] [PubMed] [Google Scholar]
- 37.Dou J, Reese TG, Tseng W-YI, Wedeen VJ. Cardiac diffusion MRI without motion effects. Magn Reson Med. 2002;48:105–114. doi: 10.1002/mrm.10188. [DOI] [PubMed] [Google Scholar]
- 38.Lemke A, Laun FB, Simon D, Stieltjes B, Schad LR. An in vivo verification of the intravoxel incoherent motion effect in diffusion-weighted imaging of the abdomen. Magn Reson Med. 2010;64:1580–1585. doi: 10.1002/mrm.22565. [DOI] [PubMed] [Google Scholar]
Associated Data
This section collects any data citations, data availability statements, or supplementary materials included in this article.
Supplementary Materials
Supporting Table S1. Simulated tissue diffusivity (Dtissue), vascular fraction (VF), and pseudo diffusion coefficient at different values of the minimum b used to extrapolate in the segmented fitting analysis routine at the low velocity case (v↓m=0.3±0.1mm/s). Units for diffusivities are (×10−3 mm2/s) and % volume for VF.