

Abstract
The mechanistic/mammalian target of rapamycin (mTOR) is a conserved serine/threonine kinase that integrates cellular signals from the nutrient and energy status to act, namely, on the protein synthesis machinery. While major advances have emerged regarding the regulators and effects of the mTOR signaling pathway, little is known about the regulation of mTOR gene expression. Here, we show that the human mTOR transcript can be translated in a cap-independent manner, and that its 5′ untranslated region (UTR) is a highly folded RNA scaffold capable of binding directly to the 40S ribosomal subunit. We further demonstrate that mTOR is able to bypass the cap requirement for translation both in normal and hypoxic conditions. Moreover, our data reveal that the cap-independent translation of mTOR is necessary for its ability to induce cell-cycle progression into S phase. These results suggest a novel regulatory mechanism for mTOR gene expression that integrates the global protein synthesis changes induced by translational inhibitory conditions.
Keywords: cap-independent translation, translational control, translation initiation, IRES, CITE, mechanistic target of rapamycin (mTOR)
INTRODUCTION
The cellular environment is subject to continuous environmental changes requiring prompt and accurate responses. To this end, the regulation of mRNA translation allows rapid changes in gene expression and occurs mainly at the level of initiation (Jackson et al. 2010). During translation initiation, the 40S ribosomal subunit binds to the eukaryotic initiation factor (eIF) 1, 1A, 3, 5, and the eIF2-GTP-Met-tRNAi ternary complex (TC) to form the 43S preinitiation complex (PIC). Subsequently, the recruitment of the PIC to the 7-methylguanosine cap 5′ end of the mRNA occurs via eIF4F, a complex consisting of the cap-binding protein eIF4E, the RNA helicase eIF4A, and the scaffold protein eIF4G. Upon loading onto the mRNA, the PIC then scans the 5′ untranslated region (5′UTR) in the 5′–3′ direction until a start codon, in a favorable context, is found (Sonenberg and Hinnebusch 2009; Jackson et al. 2010). Both the formation and recycling of TC, and the attachment of the PIC to the mRNA, are important targets of translational control (Sonenberg and Hinnebusch 2009; Jackson et al. 2010). Following a round of translation, a GDP–GTP exchange is necessary to recycle eIF2, and is accomplished through the binding of the guanine nucleotide exchange factor eIF2B to the α subunit of eIF2. The phosphorylation of eIF2α by stress-related kinases, such as the PKR-like endoplasmic reticulum kinase (PERK), increases the affinity of eIF2B to eIF2α and the availability of free eIF2B, which is limiting in the cell, decreases drastically (Pavitt 2005). Thus, eIF2 stays in its inactive GDP-bound form, resulting ultimately in the inhibition of translation initiation (Pavitt 2005). Such inhibition occurs during low oxygen availability, i.e., hypoxia (Koumenis et al. 2002). Another major target for translational repression is the eIF4F complex, whose formation is compromised by the competitive binding of the eIF4E-binding proteins (4E-BPs) to the cap-binding protein eIF4E. Hypophosphorylated 4E-BPs display high binding affinity to eIF4E, preventing its binding to eIF4G and thereby impairing eIF4F formation and translation initiation (Mader et al. 1995). The mechanistic target of rapamycin (mTOR) can, however, phosphorylate the 4E-BPs, relieving eIF4E from sequestration and allowing eIF4F complex assembly. Therefore, treatment with mTOR inhibitors can reduce mRNA translation (Beretta et al. 1996; Brunn et al. 1997).
mTOR is a serine/threonine protein kinase of the phosphatidylinositol 3-kinase (PI3K)-related kinase family that integrates signals from growth factor stimulation and hormone receptor activation, as well as from cellular nutrient- and energy-status, regulating cell growth and metabolism (Laplante and Sabatini 2012). mTOR is at the core of two complexes, mTOR complex 1 (mTORC1) and mTORC2, which display different functions according to distinct downstream targets (Laplante and Sabatini 2012). mTORC1 is sensitive to amino acid availability, growth factor stimulation, cellular oxygen levels, energy status, genotoxic stress, and cytokines. Upon stimuli recognition, mTORC1 functions toward the induction of anabolic processes, such as protein synthesis, lipid and nucleotide biogenesis, and suppression of catabolic processes, such as autophagy and lysosomal biogenesis, ultimately resulting in cell growth and proliferation (Laplante and Sabatini 2012). The main downstream targets of mTORC1 are the 4E-BPs and S6 kinases (S6Ks) (Hay and Sonenberg 2004; Laplante and Sabatini 2012). mTORC1 signaling inhibition, with concomitant translational arrest, occurs under a myriad of stress conditions, such as amino acid starvation, energy depletion, and prolonged hypoxia (Laplante and Sabatini 2012; Kaur and Sharma 2017). mTORC2 activity is modulated by growth factors and is important for actin cytoskeleton organization, protein synthesis, post-translational modifications, cell survival, migration, and metabolism (Oh and Jacinto 2011).
Following many different types of cell stress, global protein synthesis is inhibited, allowing the maintenance of energetic homeostasis and triggering a translational reprogramming toward production of stress-effector proteins (Sonenberg and Hinnebusch 2007). Indeed, repression of global protein synthesis is often accompanied with selective translation of mRNAs encoding proteins that are crucial for cell survival and stress recovery (Holcik and Sonenberg 2005; Jackson et al. 2010; Piccirillo et al. 2014). Synthesis of these stress-responsive proteins can occur via alternative mechanisms of translation initiation that are evolutionarily conserved and considerably impact translation in organisms as diverse as yeast and humans. This translational reprogramming occurs through mechanisms that can involve specific mRNA features, for example, small structural elements that interact with trans-acting factors, upstream open reading frames (uORFs), or other cis-acting RNA regulons (Jackson et al. 2010; Barbosa and Romão 2014; Lacerda et al. 2017). Furthermore, translational reprogramming occurs via a cap- and/or scanning-independent mechanism of ribosomal recruitment (Merrick 2004; Sonenberg and Hinnebusch 2007; Martínez-Salas et al. 2012; Jackson 2013; Xue et al. 2015). The alternatives of cap-dependent, scanning-free translation initiation include those taking place in mRNAs with extremely short 5′UTRs or with highly complex 5′UTRs that promote ribosome shunting, as well as those that may occur in transcripts with 5′UTRs that form highly stable structures (Ben-Asouli et al. 2002; Kumari et al. 2007; Elfakess and Dikstein 2008; Morley and Coldwell 2008; Elfakess et al. 2011; Dikstein 2012; Koh et al. 2013; Dai et al. 2015; Haimov et al. 2015; Schofield et al. 2015; Lacerda et al. 2017). However, many growth factors, oncogenes, and proteins involved in stress response and in the regulation of programmed cell death are encoded by mRNAs that present alternatives to the cap-dependent mechanisms of translation initiation to sustain protein synthesis under stress conditions or disease (Beretta et al. 1996; Holcik and Sonenberg 2005; Jackson et al. 2010; Liu and Qian 2014; Leprivier et al. 2015; Lacerda et al. 2017; Sajjanar et al. 2017). The better-described cap-independent mechanism of translation initiation involves a direct recruitment of the 40S ribosomal subunit to a position upstream of or directly at the initiation codon via a specific internal ribosome entry site (IRES) element (Martínez-Salas et al. 2012; Jackson 2013). In some cellular mRNAs under apoptosis conditions, a different cap-independent mechanism was described, in which translation occurs by a 5′ end-dependent scanning mechanism—the so-called cap-independent translational enhancer (CITE)-mediated translation (Shatsky et al. 2010; Andreev et al. 2012; Terenin et al. 2013). More recently, it was described that mRNAs containing N6-methyladenosine (m6A) in their 5′UTR can also be translated via a cap-independent mechanism (Zhou et al. 2016).
Although mTOR signaling pathways have been extensively studied, the regulation of mTOR expression itself is not well characterized. Knowing that the mTORC1 pathway is hyperactive during mitosis despite decreased global protein synthesis and reduced activity of mTORC1 upstream activators (Ramirez-Valle et al. 2010), we asked how mTOR is translationally regulated both in normal and in stress conditions associated with a reduction of global protein synthesis. We found that human mTOR transcript allows both cap-dependent and eIF4E-independent translation, their ratio being different under normal conditions or cellular stress. Furthermore, we observed that the mTOR 5′UTR forms a highly folded RNA scaffold consisting of several stem–loops that binds to the 40S ribosomal subunit with high affinity. Additionally, we show that the cap-independent translation of mTOR ensures that cells enter into the S phase of the cell cycle. Our data demonstrate a novel regulatory mechanism of mTOR gene expression and how it contributes in maintaining mTOR biological functions.
RESULTS
The 5′UTR of mTOR mRNA contributes to sustained translation under global protein synthesis inhibition
mTOR is sensitive to different signals such as growth factors, cellular oxygen levels, energy status, genotoxic stress, and cytokines (Huang and Fingar 2014). The effects on the activation status of mTOR signaling, particularly of mTORC1, imposed by those conditions are well known (Ramirez-Valle et al. 2010; Kato et al. 2011). In contrast, the regulation of mTOR protein expression is poorly understood, and it is not known whether modulation of mTOR signaling in response to environmental cues also involves regulation of mTOR protein expression itself. Previous studies have shown that mTOR operates in conditions of global protein synthesis shutdown (Wang et al. 1995), indicating that its synthesis might also be maintained in conditions of global mRNA translation inhibition. Given that the presence of regulatory elements within the 5′UTR of transcripts can confer translational advantage in conditions of global protein synthesis inhibition driven by inactivation of the ternary and/or eIF4F complexes (Martínez-Salas et al. 2012), we evaluated the role of human mTOR 5′UTR in the regulation of mTOR protein expression in conditions of disrupted eIF4E/eIF4G interaction. For this purpose, HeLa cells were transiently transfected with reporter constructs encoding the accessible Flag-tagged rat mTOR ORF (gift of R. Schneider, New York University School of Medicine, New York, NY), as it has high homology with the human mTOR ORF, under the control of either the human β-globin 5′UTR (HBB-5′UTR-mTOR-Flag), which exclusively allows cap-mediated translation initiation (Lockard and Lane 1978), or the human mTOR 5′UTR (mTOR-5′UTR-mTOR-Flag) (Fig. 1A). Cells were treated with 250 µM 4EGI-1, a compound that blocks the eIF4E/eIF4G interaction (Moerke et al. 2007), or DMSO vehicle, during 24 h. To confirm the ability of 4EGI-1 to disrupt the eIF4E/eIF4G interaction, each pool of lysates was immunoprecipitated using an anti-eIF4E antibody, and detection of eIF4E and eIF4G was performed by Western blot (Fig. 1B; left panel). Our results demonstrate that eIF4G is negligible in the immunoprecipitated lysates of 4EGI-1 treated cells, indicating that the 4EGI-1 treatment blocks eIF4E/eIF4G interaction.
FIGURE 1.
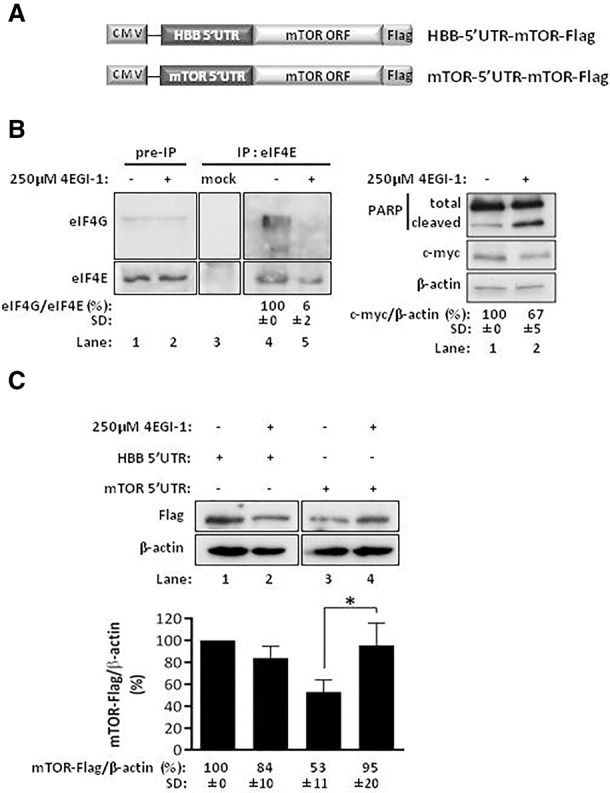
The 5′UTR of mTOR mRNA contributes to sustained translation under global protein synthesis inhibition. (A) Representation of HBB-5′UTR-mTOR-Flag and mTOR-5′UTR-mTOR-Flag plasmid constructs. The 5′UTR of human β-globin (HBB) (HBB 5′UTR) or of human mTOR (mTOR 5′UTR) was cloned upstream of the open reading frame (ORF) of rat mTOR (NM_019906.1), which is fused, in the 3′ end, with the Flag-tag encoding sequence. The transcriptional unit expressing mTOR is under the control of a cytomegalovirus (CMV) promoter. (B,C) mTOR protein levels are increased in conditions of disrupted eIF4E/eIF4G interaction. HeLa cells were transfected with the HBB 5′UTR or mTOR 5′UTR plasmid constructs and treated, 2 h later, with 100 µM of 4EGI-1. After 16 h, cells were further treated with 150 µM of 4EGI-1 for 8 h more. In parallel, a set of transfected HeLa cells was treated with DMSO vehicle (−). (B) 4EGI-1 treatment disrupts eIF4E/eIF4G interaction, induces apoptosis, and reduces c-myc protein levels. (Left panel) Lysates from transfected and 4EGI-1-treated HeLa cells were subjected to immunoprecipitation (IP) using an anti-eIF4E antibody coupled to protein G-agarose beads. As a control, the eIF4E antibody was omitted from a DMSO-treated lysate at lane 3 (mock). The immunoprecipitated and preimmunoprecipitated cell extracts were analyzed by Western blot, in a 1.5:1 ratio, using antibodies anti-eIF4E and anti-eIF4G. (Right panel) Western blot analysis of transfected and 4EGI-1-treated HeLa cell extracts using antibodies anti-poly(ADP-ribose) polymerase (PARP) and anti-c-myc. The β-actin specific antibody controls for protein loading. Increased PARP cleavage demonstrates apoptosis stimulation. Densitometry measurement of c-myc protein is shown below the autoradiographs (percentage relative to the respective control vehicle condition, arbitrarily set to 100%). (C) 4EGI-1 treatment with disrupted eIF4E/eIF4G interaction increases mTOR protein expression. (Upper panel) Western blot analysis of transfected and 4EGI-1-treated HeLa cell extracts using an anti-Flag antibody. The β-actin specific antibody controls for protein loading (shown is a representative autoradiograph of three independent experiments). (Lower panel) mTOR-Flag protein levels were quantified by densitometry relatively to the β-actin levels, and these values were plotted for each condition (average and standard deviations [SDs] of three independent experiments) normalized to the HBB 5′UTR-Flag levels in the control vehicle condition, arbitrarily set to 100%.
It is known that 4EGI-1 treatment reduces mRNA translation of c-myc via eIF4E/eIF4G disruption, and induces apoptosis (Moerke et al. 2007). Thus, to confirm eIF4E/eIF4G disruption, we also evaluated the protein levels of c-myc by Western blot, and of the full-length and cleaved forms of nuclear DNA repair enzyme poly(ADP-ribose) polymerase (PARP) (Fig. 1B; right panel). 4EGI-1 treatment clearly induced apoptosis and reduced c-myc protein levels, as expected (Moerke et al. 2007). Under these conditions, inspection of ectopically expressed mTOR-Flag protein under the control of the mTOR 5′UTR revealed an increase from 53% to 95% relative to that without treatment (Fig. 1C, lane 4 versus 3). On the contrary, mTOR-Flag protein expression under the control of the HBB 5′UTR decreases in cells treated with 4EGI-1 drug, from 100% to 84% when compared to that in untreated cells (Fig. 1C, lane 2 versus 1). The decrease of ectopically expressed mTOR-Flag protein under the control of mTOR 5′UTR, relative to that under the control of the HBB 5′UTR, may reflect the lower efficiency of the mTOR 5′UTR in mediating cap-dependent translation when compared to the highly efficient human HBB 5′UTR (Shakin and Liebhaber 1986; Groebe et al. 1992). Together, these observations suggest that mTOR protein expression is resistant to perturbations of ternary and eIF4F complexes, and that the mTOR 5′UTR is involved in this process.
The mTOR 5′UTR supports firefly luciferase activity from a dicistronic plasmid with impaired translation reinitiation
Given that our previous results (Fig. 1) show that mTOR translation can occur independent of eIF4F, we hypothesized that the mTOR 5′UTR might mediate cap-independent translation initiation. Supporting this hypothesis is the fact that the sequence of the human mTOR 5′UTR has a high GC content (74%) (Fig. 2A), which could suggest the presence of strong secondary structure elements. In addition, the alignment of human mTOR 5′UTR with that of chimpanzee, dog, mouse, chicken, and rat revealed relatively conserved sequences, especially those in close proximity to the AUG start codon (Fig. 2A). This relative conservation of the human mTOR 5′UTR indicates that this sequence might have a regulatory function. These observations together with results shown in Figure 1, suggested that mTOR 5′UTR might mediate cap-independent translation initiation.
FIGURE 2.

mTOR 5′UTR supports firefly luciferase (FLuc) activity in a dicistronic reporter DNA construct with impaired reinitiation. (A) Alignment of mTOR 5′UTRs from different species shows highly conserved sequences. Nucleotide sequence alignment of the human (Homo sapiens), chimpanzee (Pan troglodytes), dog (Canis lupus), mouse (Mus musculus), chicken (Gallus gallus), and rat (Rattus norvegicus). Highly conserved nucleotides are shown in black boxes and nonconserved sequences are shown in white boxes. For each 5′UTR, the length is indicated (in nucleotides) on the right. (B) Representation of the dicistronic reporter pR_F, pR_HBB_F, pR_mTOR_F, and pR_EMCV_F constructs. The 5′ untranslated regions (5′UTRs) of human β-globin (HBB) or of human mTOR mRNAs, and the encephalomyocarditis virus (EMCV) internal ribosome entry site (IRES) element were cloned into the empty vector (pR_F), downstream from the Renilla luciferase (RLuc) open reading frame (ORF) (RLuc box) and downstream from a stable hairpin structure (represented as a stem–loop), but upstream of the firefly luciferase (FLuc) ORF (FLuc box), to create the pR_HBB_F, pR_mTOR_F, and pR_EMCV_F constructs, respectively. The dicistronic transcriptional units expressing RLuc and FLuc are under the control of the SV40 promoter. (C) Induction of downstream reporter luciferase expression mediated by HBB, mTOR, or EMCV segments, comparing to that from the EMCV IRES-containing construct, in HEK293T cells. Cells were transiently cotransfected with the dicistronic plasmids depicted in B and the pSV-β-Galactosidase control vector (β-gal). Luciferase and β-gal activities were measured 16 h post-transfection. The values (relative light units [RLU]) are shown as the FLuc (FLuc levels) or RLuc (RLuc levels) luminescence percentage relative to the one obtained from the EMCV IRES-containing construct, arbitrarily set to 100%. Histograms show mean ± SD from three independent experiments. Statistical analysis was performed using the Student's t-test (unpaired, two-tailed); (NS) nonsignificant; (*) P < 0.05, (**) P < 0.01, (***) P < 0.001. (D) Deletional analysis of mTOR 5′UTR reveals that the 3′ end is required for cap-independent translation initiation. (Left panel) Schematic representation of plasmids used to identify the minimal sequence of mTOR 5′UTR required for cap-independent translation activity. RLuc is the Renilla luciferase cap-dependent translated cistron and FLuc the firefly cap-independent translated cistron. Black boxes of different sizes represent the different lengths of the deletional sequences cloned upstream of FLuc AUG. pR_F is the empty transcript; pR_mTOR_F, the full-length mTOR 5′UTR-containing transcript; pR_16-121_F, the mTOR 5′UTR nucleotides (nt) 16–121-containing plasmid; pR_27-121_F, the mTOR 5′UTR nt 27–121-containing plasmid; pR_69-121_F, the mTOR 5′UTR nt 69–121-containing plasmid; pR_92-121_F, the mTOR 5′UTR nt 92–121-containing plasmid; pR_1-15_F, the mTOR 5′UTR nt 1–15-containing plasmid; pR_1-26_F, the mTOR 5′UTR nt 1–26-containing plasmid; pR_1-68_F, the mTOR 5′UTR nt 1–68-containing plasmid. All constructs contain a stable hairpin downstream from RLuc cistron to prevent translation reinitiation. On the right panel, the values are shown as the luminescence ratio, normalized to that of the pR_F (empty vector), which was arbitrarily set to 1. Histogram shows mean ± SD from three independent experiments. Statistical analysis was performed using the Student's t-test (unpaired, two-tailed); (***) P < 0.001.
A common method to test for cap-independent translation initiation activity of a given RNA sequence relies on dicistronic reporter systems expressing mRNAs in which the upstream cistron is translated via the cap-dependent mechanism, whereas the downstream ORF is only translated if preceded by a sequence that allows internal translation initiation, i.e., cap-independent translation initiation (Van Eden 2004; Jackson 2013). In this study, we used a dicistronic DNA reporter with the RLuc ORF as the first cistron and the FLuc ORF as the second cistron. In order to prevent translation reinitiation, a stable hairpin (Candeias et al. 2006) was inserted downstream from RLuc (Fig. 2B). Previously described data have demonstrated that this hairpin efficiently inhibits ribosome scanning (Candeias et al. 2006). The positive control was the EMCV IRES sequence (Jang et al. 1988). Human mTOR 5′UTR and the aforementioned sequences were cloned upstream of the FLuc cistron so that each native initiation codon is replaced by the FLuc AUG start codon. The resulting constructs were called pR_mTOR_F (mTOR), pR_HBB_F (HBB), and pR_EMCV_F (EMCV). As a negative control, an empty reporter plasmid (pR_F) was used containing a short linker sequence between the two luciferase cistrons (Fig. 2B). Expression of each of the reporter genes was assessed after transient cotransfection of these constructs with the pSV-β-Galactosidase control vector (β-gal) into HEK293T cells. To this end, cellular extracts were prepared and assayed for luciferase and β-gal activities. FLuc and RLuc activities of each construct were normalized to the activity of the β-gal. The subsequent FLuc to β-gal (FLuc/β-gal) and RLuc to β-gal (RLuc/β-gal) ratios were compared to those from the pR_EMCV_F construct (Fig. 2C), arbitrarily set to 100%. The insertion of mTOR 5′UTR in the dicistronic reporter significantly induces FLuc expression, representing ∼30% of that induced by EMCV IRES (Fig. 2C, left panel). Several previous studies demonstrated that EMCV IRES is active in HEK293T cells (Genolet et al. 2011; Chan et al. 2013). In contrast, HBB 5′UTR did not induce relative FLuc activity, reflecting the expected absence of internal translation initiation (Fig. 2C, left panel). It is important to note that the RLuc expressed from the EMCV IRES-containing construct is significantly higher than that expressed from the empty construct (Fig. 2C, right panel). Analogous observations were previously made in K562 cells, in which RLuc activity from the pR_EMCV_F construct was about 1.6-fold from that observed in the empty vector (Gerlitz et al. 2002). In addition, induction of FLuc expression by mTOR 5′UTR was also observed in HCT116, A549, HeLa, NCM460, and SW480 cell lines, which are derived from different tissues (Supplemental Fig. S1). Together, our results show that mTOR 5′UTR allows production of FLuc in a dicistronic plasmid that impedes translation reinitiation, strongly suggesting that this RNA fragment can mediate cap-independent translation initiation.
The mTOR minimal segment that allows cap-independent translation is evolutionarily conserved
To identify the minimum segment that allows cap-independent translation, we made a series of deletions within the 121 nucleotides (nt) of human mTOR 5′UTR cloned into the dicistronic DNA reporter, as before (Fig. 2D). Expression of each of the reporter genes (Fig. 2D; left panel) was assessed after transient transfection of these constructs into HEK293T cells. The FLuc/RLuc ratios were compared to those from the pR_F construct (Fig. 2D), arbitrarily set to 1. We localized the minimum fragment for cap-independent translation activity to nt 92–121 (Fig. 2D, right panel); i.e., in the 3′ end of the mTOR 5′UTR. Although this fragment does not fully recapitulate the cap-independent translation activity observed with full-length mTOR 5′UTR, it has very strong activity—approximately 70% of that from the full-length mTOR 5′UTR—and its removal abolishes cap-independent translation. Indeed, segments corresponding to nt 1–15, 1–26, or 1–68 do not show significant cap-independent translation activity (Fig. 2D, right panel). Of note, the segment containing nt 57–121 of the mTOR 5′UTR shows important evolutionary conservation in all species analyzed (Fig. 2A). Together, these findings support a regulatory function for the mTOR 5′UTR 3′ end segment.
The mTOR 5′UTR-mediated FLuc activity is neither due to abnormal splicing nor cryptic promoter activation
Cryptic promoter activity and/or abnormal splicing within the 5′UTR can lead to misinterpretation of bicistronic reporter luciferase assays and generate a false-positive result if the generated monocistronic and/or aberrant dicistronic RNAs encode an enzymatically active FLuc (Van Eden 2004; Jackson 2013). To test whether those events could account for the observed induction of FLuc by mTOR 5′UTR, we used a comprehensive set of approaches as reported before (Van Eden 2004; Jackson 2013). First, we checked whether the transfected pR_mTOR_F plasmid was transcribed into a full-length transcript. To this end, the integrity of the R_mTOR_F transcript expressed in HEK293T cells was analyzed by RT-PCR (Supplemental Fig. S2A). As shown in Supplemental Figure S2A, the full-length dicistronic R_mTOR_F mRNA is produced and, by sequencing the corresponding PCR fragments, we confirmed that the expected dicistronic R_mTOR_F mRNA is present. The same analysis was performed in HeLa and A549 cells and similar results were obtained (Supplemental Fig. S2A, lower panels). Then, to further evaluate the possibility of cryptic splicing, a computer-assisted analysis for the prediction of potential splice sites was performed with the SpliceView (Rogozin and Milanesi 1997) and NNSplice (Reese et al. 1997) programs. This analysis revealed that mTOR 5′UTR does not contain any potential splice acceptor site. To confirm the absence of cryptic splicing in the R_mTOR_F mRNA, the previously used constructs (shown in Fig. 2B) were modified to relocate the hairpin upstream of RLuc, generating the “hpR_x_F” subset of constructs (hpR_F, hpR_HBB_F, hpR_mTOR_F, and hpR_EMCV_F) (Fig. 3A). The luciferase activities from these plasmids expressed in HEK293T cells were compared to those obtained from the constructs in which the hairpin is located downstream from RLuc (“pR_x_F”) (Fig. 3A; see also Fig. 2B). The RLuc and FLuc activities of each construct were normalized to the activity units of β-gal, as before, and the subsequent FLuc/β-gal and RLuc/β-gal ratios were compared to those of the pR_EMCV_F construct (Fig. 3B), arbitrarily set to 100%. Introducing the hairpin upstream of RLuc decreases its translation by about 60%–70% (Fig. 3B, right panel); in addition, the mTOR 5′UTR-driven FLuc activity remains unaffected in those settings (Fig. 3B, left panel). Furthermore, as a consequence of the hairpin-mediated inhibition of cap-dependent translation, the EMCV IRES activity was enhanced (Fig. 3B, left panel), as previously observed for the CDK1/p34Cdc2 IRES (Marash et al. 2008). These results indicate that FLuc activity induced by mTOR 5′UTR is not affected when RLuc translation is inhibited, suggesting that both cistrons are intact in the same mRNA and, thus, FLuc activity does not result from the expression of abnormally spliced transcripts.
FIGURE 3.

mTOR 5′UTR induces firefly luciferase expression from a proper full-length mRNA transcribed from the transfected reporter plasmid and from transfected reporter mRNAs. (A) Representation of the pR_x_F and hpR_x_F sets of constructs. A stable hairpin was cloned either downstream or upstream of the Renilla luciferase (RLuc) open reading frame (ORF), originating the pR_x_F (described in Fig. 2B) or the hpR_x_F subset of constructs, respectively. The “x” represents a linker sequence (hpR_F or pR_F), the human β-globin 5′ untranslated region (HBB 5′UTR) (hpR_HBB_F or pR_HBB_F), the human mTOR 5′UTR (hpR_mTOR_F or pR_mTOR_F), or the EMCV IRES (hpR_EMCV_F or pR_EMCV_F), cloned upstream of the firefly luciferase (FLuc) ORF. (B) Reduction of RLuc by a stable hairpin does not change FLuc induction by mTOR 5′UTR. HEK293T cells were transiently cotransfected with the dicistronic plasmids depicted in A and the pSV-β-Galactosidase control vector (β-gal). Luciferase and β-gal activities were measured 24 h post-transfection. The values (RLU) are shown as the RLuc (RLuc levels), or FLuc (FLuc levels) luminescence percentage relative to that obtained from the pR_EMCV_F construct, arbitrarily set to 100%. Histograms show mean ± SD from three independent experiments. Statistical analysis was performed using the Student's t-test (unpaired, two-tailed); (NS) nonsignificant; (*) P < 0.05; (**) P < 0.01; (***) P < 0.001. (C) Representation of the pR_x_F constructs, in which “x” represents a linker sequence (pR_F), the human β-globin 5′ untranslated region (HBB 5′UTR) (pR_HBB_F), or the human mTOR 5′UTR (pR_mTOR_F), cloned upstream of the firefly luciferase (FLuc) ORF. Positions of the short-interfering RNA (siRNA) oligonucleotides targeting RLuc or FLuc are represented below. HEK293T cells were cotransfected with the constructs depicted in C and FLuc or RLuc siRNAs. Alternatively, an unspecific siRNA targeting the green fluorescent protein (GFP) was used as a control. Luciferase activity and total protein content was measured 24 h post-transfection. (D) RLuc activity is decreased to residual values by siRNA-mediated depletion of RLuc and FLuc, whereas FLuc activity is reduced to background levels by siRNA-mediated depletion of RLuc and to residual values by siRNAs targeting FLuc. The luciferase values (RLU) are shown as the RLuc per µg of total protein (RLuc/µg) (RLuc levels), or FLuc per µg of total protein (FLuc/µg) (FLuc levels), relative to that obtained in the pR_mTOR_F construct expressed in GFP siRNA-treated cells, arbitrarily set to 100%. Histograms show mean ± SD from three independent experiments. Statistical analysis was performed using the Student's t-test (unpaired, two-tailed); (NS) nonsignificant. (E) Representation of the pR_x_F constructs, in which “x” represents a linker sequence (pR_F), the human mTOR 5′UTR (pR_mTOR_F), or the human MutL homolog 1 (MLH1) 5′UTR, cloned upstream of the FLuc ORF, in plasmids with or without SV40 promoter. MLH1 5′UTR was used as a positive control for cryptic promoter activity. HEK293T cells were transiently cotransfected with each of the constructs described in E, along with the pSV-β-Galactosidase control vector (β-gal). Luciferase and β-gal activities were measured 24 h post-transfection. (F) FLuc activity induced by mTOR 5′UTR is not a result of cryptic promoter activity. The values (RLU) are shown as the luminescence ratio between RLuc and β-gal (RLuc/β-gal), or FLuc and β-gal (FLuc/β-gal), compared to the RLuc/β-gal ratio from the empty construct with promoter, arbitrarily set to 1. Histogram shows mean ± SD from three independent experiments. Statistical analysis was performed using the Student's t-test (unpaired, two-tailed); (NS) nonsignificant, (***) P < 0.001. (G) Schematic illustration of the in vitro transcribed, m7GpppG-capped (m7G-capped; 5′G) (left panel) or GpppA-capped (A-capped; 5′A) (right panel), and polyadenylated monocistronic reporter constructs. (H) In vitro transcribed monocistronic mRNAs containing mTOR 5′UTR undergo cap-independent translation after transient transfection. The 5′G-capped and 5′A-capped polyadenylated monocistronic mRNAs were transiently transfected into HEK293T cells, along with the pSV-β-Galactosidase control vector (β-gal), and FLuc and β-gal enzymatic activity were measured 4 h post-transfection. The values (RLU) are shown as the luminescence ratio between 5′A and 5′G, normalized to that of the F mRNA (empty vector), which was arbitrarily set to 1. Histogram shows means from three independent experiments. Statistical analysis was performed using the Student's t-test (unpaired, two-tailed); (*) P < 0.05, (**) P < 0.01.
To unequivocally prove that both FLuc and RLuc are expressed from the same mRNA, and that no abnormal mRNA species appear either due to a cryptic splicing event between a 5′-splicing site located within or upstream of RLuc and the mTOR 5′UTR, or by cryptic promoter activity of the sequence within the mTOR 5′UTR, siRNA-mediated depletion of FLuc or RLuc was performed as previously suggested (Van Eden 2004; Jackson 2013). To this end, FLuc or RLuc siRNAs were cotransfected with pR_F, pR_HBB_F, or pR_mTOR_F plasmids (Fig. 3C) into HEK293T cells. In parallel, siRNAs targeting the mRNA of the green fluorescent protein (GFP) were used as a nonspecific control. The RLuc and FLuc levels were normalized to protein content. The analysis revealed that RLuc siRNAs decrease both RLuc and FLuc activities to background levels (Fig. 3D). Similarly, siRNA targeting the FLuc cistron resulted in residual values of both FLuc and RLuc in all the constructs (Fig. 3D). These data indicate that pR_mTOR_F plasmid only expresses one species of transcript, the proper full-length mRNA.
To extend these observations and further confirm that a single dicistronic R_mTOR_F full-length mRNA is present in our experimental conditions, we evaluated the expression of the reporter genes in promoterless constructs. First, the SV40 promoter and chimeric intron were removed from the dicistronic DNA constructs pR_F and pR_mTOR_F (Fig. 3E), then their expression was analyzed following transfection into HEK293T, HeLa, and A549 cells (Fig. 3F; Supplemental Fig. S2B,C). The 5′UTR of the human gene encoding the DNA mismatch repair MLH1 protein contains a cryptic promoter (Ito et al. 1999; Arita et al. 2003) and was used as a positive control for cryptic promoter activity. The RLuc/β-gal or FLuc/β-gal ratios were compared to those from the empty pR_F vector, arbitrarily set to 1. The removal of SV40 promoter significantly decreases RLuc activity from pR_F and pR_ mTOR_F constructs to background levels (Fig. 3F), as expected. Similarly, the FLuc activity from the pR_mTOR_F construct was significantly reduced to levels that are not different from the FLuc values obtained from the pR_F construct (Fig. 3F). On the other hand, SV40 promoter removal does not affect the high levels of FLuc activity expressed from the dicistronic plasmid containing MLH1 5′UTR (Fig. 3F). In support of these observations, similar results were obtained in HeLa and A549 cells (Supplemental Fig. S2B,C).
To eliminate any potential contribution from cryptic promoters or splicing activation, cells can be transfected with reporter mRNA instead of plasmid DNA. Thus, to confirm that mTOR 5′UTR-mediated FLuc activity is not a result of cryptic promoters or splicing activation, and instead results from cap-independent translation, cells were transfected with m7GpppG-capped (m7G-capped; 5′G) or GpppA-capped (A-capped; 5′A) monocistronic reporter mRNAs (Fig. 3G). For this purpose, the different mRNAs were in vitro transcribed from the T7 RNA polymerase promoter-containing p_F, pHBB_F, pc-MYC_F, pEMCV_F, and pmTOR_F DNA reporters, capped and polyadenylated. The mRNAs (Fig. 3G, G-capped: left panel; A-capped: right panel) were cotransfected with the pSV-β-Galactosidase control vector into HEK293T cells, and the reporter activity was measured 4 h post-transfection in order to evaluate luciferase expression within the linear phase of translation (Jackson 2013). FLuc activity of each construct was normalized to the activity of the β-gal. The subsequent FLuc activity from each one of the uncapped (i.e., A-capped) transcripts was normalized to that of the corresponding m7G-capped transcript (5′A/5′G) and compared to that from the p_F construct (empty vector), arbitrarily set to 1 (Fig. 3H). Results show that the presence of the mTOR 5′UTR segment in the monocistronic uncapped mRNA induces FLuc activity, at a level of about 15-fold of that produced via the empty vector, being similar to that mediated by a positive control for cellular IRES activity—the human c-myc IRES (Stoneley et al. 1998). These data show that human mTOR 5′UTR is able to mediate cap-independent translation initiation. Overall, this comprehensive set of data demonstrate that the pR_mTOR_F construct originates a dicistronic mRNA, and that the induction of FLuc by mTOR 5′UTR is a result of cap-independent translation initiation.
The mTOR 5′UTR sequence adopts a highly folded RNA scaffold in solution
Most cis-acting sequences involved in translational control contain structured RNA domains that are critical for function through their role in interacting with eIFs or the ribosome (Filbin and Kieft 2009). Thus, to further characterize the mTOR 5′UTR, we analyzed its RNA structure in solution using chemical and enzymatic probes. The structure was modeled using nucleotide accessibility information yielded by RNAse V1 reactivity, to detect double stranded regions, and CMCT and DMS reactivity, to detect single stranded regions (Fig. 4A; Supplemental Fig. S3). The data were then used as constraints for “RNA mFold,” an RNA secondary structure prediction software (Zuker 2003). The different models obtained were evaluated for consistency with the V1, DMS, and N-cyclohexyl-N′-[N-methylmorpholinoethyl]-carbodiimid-4-toluenesulfonate (CMCT) data and the model that best fits all the data is shown in Figure 4A. Overall, the model is in excellent agreement with the reactivity data. Most V1 hits are in the helical region, while CMCT and DMS hits are consistent with either loop-exposed residues or noncanonical pairing.
FIGURE 4.
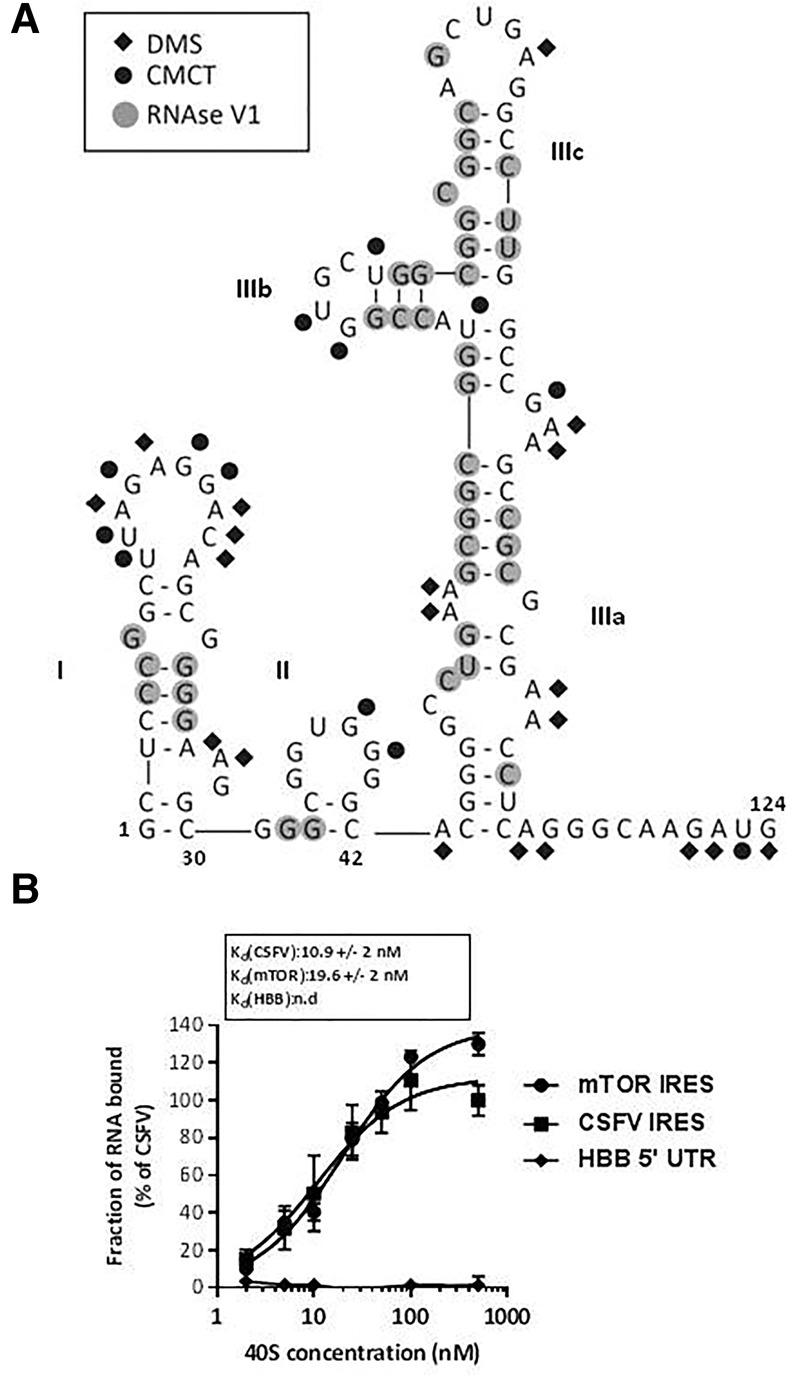
The mTOR 5′UTR folds in a compact RNA structure that directly binds to the 40S ribosomal subunit. (A) mTOR 5′UTR adopts a highly folded RNA scaffold in solution. The results of enzymatic probing of the mTOR 5′UTR sequence are schematically represented on the proposed secondary structure model. Cleavages by RNase V1 are shown in gray circles. Results of CMCT and dimethyl sulphate (DMS) modifications are indicated using black circles and diamonds, respectively. The free energy of the proposed stem–loop structures at 37°C, in 1 M NaCl were calculated with the MFold software (Huang and Fingar 2014). (B) mTOR 5′UTR sequence directly binds to 40S subunits. Binding curves of 32P-labeled CSFV IRES, mTOR 5′UTR, and HBB 5′UTR control RNA to purified human 40S subunits. Labeled RNAs were incubated with 40S subunits and binding assessed by filter binding assay.
The mTOR 5′UTR adopts a compact structure, which is largely reflected by the formation of several stem–loops. Three main domains can be identified, the first corresponding to nucleotides 1–30, the second consists of nucleotides 33–42, and the third to 44–113 (Fig. 4A). The first part of the structure is formed by domain I, which consists of one stem–loop structure helix. This part of the structure provides a potential platform for protein recruitment as domain I is capped by a large loop consisting of 10 nt that are all highly accessible as reflected by the reactivity to CMCT or DMS. Domain II is a short stem–loop capped by a guanine-rich G2UG3 hexaloop. Domain III consists of three subdomains IIIa to IIIc. IIIa corresponds to the basal stem of this domain which is then organized into two stem–loops: IIIb and IIIc. The subdomain IIIb is capped by a GUGC tetraloop, while domain IIIc is capped by a heptaloop. The 3′ end of the sequence is a single-stranded region, containing the AUG start codon, which is thus accessible for recognition by the translational machinery.
mTOR 5′UTR directly binds to the 40S ribosomal subunit
Given that several viral IRESs have the ability to bind directly to the 40S subunit in the absence of any initiation factor, a property common to HCV-like IRESs, dicistrovirus IRESs, lentiviral IRESs, and the recently characterized vFLIP IRES (Locker et al. 2011; Othman et al. 2014; Deforges et al. 2015), we assayed whether the 40S ribosomal subunit could directly interact with the mTOR 5′UTR sequence, using the CSFV IRES and the human HBB 5′UTR as positive and negative controls for IRES activity, respectively. Ribosomal subunits were purified from HeLa cells according to described procedures and incubated with 32P-labeled mTOR or HBB 5′UTRs or CSFV IRES, before conducting filter-binding assays to analyze the affinity and specificity of putative interactions (Othman et al. 2014). We determined that the mTOR 5′UTR binds the 40S subunit with an apparent equilibrium dissociation constant (Kd) of 19.6 nM, while the CSFV IRES (as a control) bound with an affinity of 10.9 nM (Fig. 4B); as expected, the HBB 5′UTR did not bind. These results further support the mTOR 5′UTR ability to function in mediating ribosomal recruitment and independent translation initiation. In addition, it demonstrates that mTOR 5′UTR shares with viral IRESs the ability to bind directly to the 40S ribosomal subunit with high affinity.
The mTOR protein level remains constant under hypoxic conditions
The cellular response to hypoxia is characterized by HIF1α stabilization that elicits a global reprogramming of gene expression (Wang et al. 1995; Koritzinsky et al. 2006). The inactivation of eIF2 through eIF2α phosphorylation is one of the mechanisms by which, during hypoxia, protein synthesis is globally inhibited while a subset of mRNAs is preferentially translated, namely those encoding proteins involved in the hypoxic response (Koumenis et al. 2002; Pavitt 2005; Koritzinsky et al. 2006). Since mTORC1 is involved in the hypoxic response by regulating expression of HIF1α and modulating its transcriptional activity (Hudson et al. 2002; Bernardi et al. 2006; Land and Tee 2007), we hypothesized that mTOR cap-independent translation might be also operating under hypoxia. To test this hypothesis, HEK293T cells were transiently cotransfected with the dicistronic constructs pR_F, pR_HBB_F, pR_mTOR_F, or pR_EMCV_F (Fig. 2B), along with the pSV-β-Galactosidase control vector, and cells were treated with 200 µM CoCl2 or H2O vehicle. In agreement with previous studies (Reese et al. 1997; Koumenis et al. 2002), CoCl2 treatment increases the protein levels of the HIF1α subunit and phosphorylated eIF2α (P-eIF2α). Nevertheless, mTOR levels remain constant, while total eIF2α decreases. Of note, α-tubulin levels remarkably decrease after 24 h of hypoxia (Fig. 5A), showing that cap-dependent translation is inhibited.
FIGURE 5.
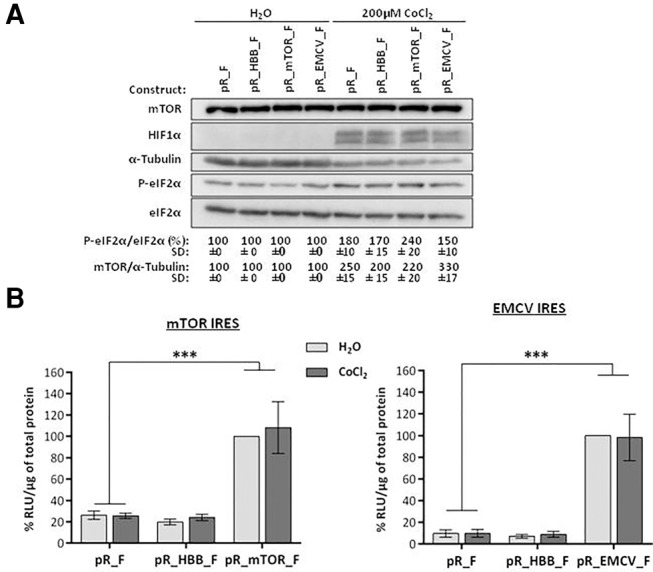
mTOR cap-independent translation occurs in conditions of hypoxia. HEK293T cells were transiently cotransfected with the dicistronic pR_F, pR_HBB_F, pR_mTOR_F, or pR_EMCV_F constructs (Fig. 2B), along with the pSV-β-Galactosidase control vector (β-gal), and treated 17 h later with 200 µM CoCl2 for 24 h. (A) Cap-dependent translation is reduced after 200 µM CoCl2 treatment. Western blot analysis of transfected HEK293T cell extracts treated with 200 µM CoCl2 or vehicle (H2O), using antibodies against HIF1α, total and phosphorylated eIF2α (P-eIF2α). CoCl2 treatment increases HIF1α and eIF2α phosphorylation and decreases levels of α-tubulin and total eIF2α. eIF2α phosphorylation is demonstrated by increased P-eIF2α/eIF2α total ratio. Induction of hypoxia increases levels of mTOR protein relative to those of α-tubulin. Values are the mean ± SD from two independent experiments. (B) mTOR cap-independent translation activity slightly increases after CoCl2-induced hypoxia. FLuc activities were measured in extracts from HEK293T treated with 200 µM CoCl2. The values (RLU) were normalized to total protein content and are shown as the luminescence percentage (%) relative to the FLuc activities obtained from the pR_mTOR_F (left panel) or pR_EMCV_F (right panel) H2O-control samples, arbitrarily set to 100%. Histograms show mean ± SD from three independent experiments. Statistical analysis was performed using Student's t-test (unpaired, two-tailed); (NS) nonsignificant; (***) P < 0.001.
The mTOR cap-independent translation and EMCV IRES activity were also evaluated under these conditions. Our results demonstrate that following CoCl2-induced hypoxia, the mTOR cap-independent translation is slightly activated compared to control (Fig. 5B; left panel). The activity of EMCV IRES is unaffected (Fig. 5B; right panel), in agreement with a previous study demonstrating that EMCV IRES remains unchanged upon CoCl2-induced hypoxia (Morfoisse et al. 2014). Together, these data demonstrate that during hypoxia, marked with cap-dependent translation inhibition through inactivation of eIF2, the total translation activity of mTOR remains unaffected, accompanying the sustained levels of endogenous mTOR protein.
Cap-independent translation of mTOR is necessary for its ability to induce cell-cycle progression into S phase
In favorable energetic and nutritional conditions, mTOR signaling induces cell growth and cell-cycle progression, both in yeast and mammals (Vilella-Bach et al. 1999; Schmelzle and Hall 2000; Fingar and Blenis 2004; Fingar et al. 2004). Therefore, we examined whether cap-independent synthesis of mTOR contributes to its ability to induce cell-cycle progression to S phase. To this end, A549 cells were transfected with the HBB-5′UTR-mTOR-Flag or mTOR-5′UTR-mTOR-Flag construct (Fig. 6A) for 2 d. After 30 h of serum starvation, to arrest cells in G0, serum was reintroduced for 18 h and 250 µM 4EGI-1, or DMSO was added for 12 h, before performing a cell-cycle analysis using fluorescence-activated cell sorting (FACS). A subset of mock-transfected A549 cells were treated in parallel. The population of cells at the S phase of the cell cycle was analyzed by FACS and is represented as the percentage change after 4EGI-1 treatment (Fig. 6B). Results revealed that 4EGI-1 treatment reduces by 10% the cell population at S phase (Fig. 6B), which is in accordance with the cellular need of protein synthesis maintenance for entry into the S phase (Schmelzle and Hall 2000). The same result was observed when mTOR was expressed under the control of the HBB 5′UTR (Fig. 6B; Supplemental Fig. S4). On the other hand, the presence of the mTOR 5′UTR forces cells to enter into S phase (Fig. 6B; Supplemental Fig. S4), which is accompanied by mTOR protein accumulation following 4EGI-1 treatment (Fig. 1C, lane 4 versus 3). Indeed, expression of mTOR from the mTOR 5′UTR construct overcomes cell-cycle arrest and induces a 10% increase in the number of cells in S phase following serum starvation release (Fig. 6B; Supplemental Fig. S4). These data support our hypothesis that the mTOR protein levels sustained by cap-independent translation of the mTOR transcript are necessary for its ability to assure cell-cycle progression into the S phase. We further validated our model by performing single-cell analyses of cell-cycle progression. For that, we used the fucci system where A549 cells stably expressing mKO2-hCdt1 and mAG-hGeminin (Fig. 6C; Sakaue-Sawano et al. 2008) were treated as in 6B and observed using computer-assisted incubator fluorescence microscopy (Olympus LCV100) for 42 h after addition of 4EGI-1 or DMSO. mKO2-hCdt1 and mAG-hGeminin constructs express orange (mKO2) and green (mAG) fluorescent proteins exclusively during G0/G1 and S/G2/M phase, respectively (Fig. 6D; Sakaue-Sawano et al. 2008). Cells that were cultured with serum maintained a constant division rate, as indicated in Figure 6E, by a S/G2/M percentage often between 40% and 50%. On the other hand, only 10%–20% of the cells that were deprived of serum were found in the S/G2/M phase, in line with our results from the FACS experiments (Supplemental Fig. S4, right panels). Cells to which serum was restored 4 h before imaging showed a complete resumption of cell-cycle division 28 h after imaging started (Fig. 6E, gray line). This recovery was slower and incomplete in the presence of the eIF4E/eIF4G interaction inhibitor 4EGI-1, which abrogates cap-dependent translation (Fig. 6F). Under these conditions, mTOR expressed from the construct with the HBB 5′UTR weakly induced entry into S/G2/M phase in the late 40 h after imaging was initiated, when compared to empty vector condition (Fig. 6G, gray line). In contrast, mTOR expressed from the construct with the mTOR 5′UTR resulted in 60% of cells in S/G2/M phase just 1 d following serum restoration, even in the presence of 4EGI-1 (Fig. 6G). This was accompanied by a 30% increase in cell number from the start until the end of the imaging period, against a decrease of 20% for HBB 5′UTR-transfected cells (Fig. 6H). Western blots executed in parallel 12 h after 4EGI-1 treatment (corresponding to 12 h in the graph in Fig. 6G) already showed an induction of mTOR-5′UTR-mTOR by 4EGI-1, while HBB-5′UTR-mTOR is reduced by the same treatment; after 24 h treatment, mTOR-5′UTR-mTOR levels were higher than HBB-5′UTR-mTOR levels, explaining the differences in cell-cycle progression (cf. Fig. 6I, lanes 1–4, with Fig. 1C, lanes 2,4, and with Fig. 6B and 6G). As expected, endogenous mTOR levels were also induced by 4EGI-1 because in this case its 5′UTR is also present (Fig. 6I, lanes 5 and 6). All together, these results convincingly show that the cap-independent translation of mTOR is crucial for mTOR expression and function, leading to cell-cycle progression under conditions when the general translation initiation machinery is still shut down.
FIGURE 6.

mTOR protein induces cell-cycle progression, when its mRNA its translated through cap-independent translation. (A) Representation of HBB-5′UTR-mTOR-Flag and mTOR-5′UTR-mTOR-Flag plasmid constructs. The 5′UTR of human β-globin (HBB) (5′UTR HBB), or of human mTOR (5′UTR-mTOR), was cloned upstream of the ORF of rat mTOR, which is fused, in the 3′ end, with the Flag-tag encoding sequence. The transcriptional unit expressing mTOR is under the control of CMV promoter. (B–I) Cap-independent translation of mTOR is necessary for its ability to induce cell-cycle progression into S phase. A549 cells were transfected with the HBB 5′UTR or mTOR 5′UTR plasmid constructs and serum deprived for 30 h. Serum was reintroduced and, 4–6 h later, cells were treated with 250 µM 4EGI-1, or DMSO-vehicle for 12 h, or as indicated. In parallel, a subset of control vector-transfected A549 cells was treated similarly. (B) Fluorescence-activated cell sorting (FACS) analyses of 4EGI-1-treated and transfected A549 cells. The y-axis shows the percentage of cells that entered (if positive) or left (if negative) S phase of the cell cycle after treatment with 4EGI-1. Histogram shows mean ± SD from three independent experiments. Statistical analysis was performed using Student's t-test (unpaired, two-tailed); (NS) nonsignificant; (**) P < 0.01 (see also Supplemental Fig. S4). (C) Representation of fucci constructs: mKO2-hCdt1 encodes a monomeric version of Kusabira Orange fluorescent protein gene fused to codons 30–120 of human cdt1, and mAG-hGeminin encodes a monomeric version of Azami Green fluorescent protein gene fused to codons 1–110 of human geminin (Genolet et al. 2011). (D) Representation of the expression of fucci constructs during the different phases of the cell cycle: mKO2-hCdt1 protein is degraded by the SCFSkp2 complex at the onset of S phase and thus is only expressed during G0/G1 phase, and mAG-hGeminin protein is degraded by the APCCdh1 complex during late mitosis and G1 and thus is only expressed during S/G2/M phase. (E–G) A549 cells stably expressing the fucci constructs were treated and transfected as described above, and mKO2-hCdt1 and mAG-hGeminin expression were followed in single cells for 42 h from the moment 4EGI-1 or DMSO was added, using computer-assisted incubator fluorescence microscopy. The radius-axis indicates time after 4EGI-1/DMSO addition (for Restoration conditions this corresponds to 4 h after serum reintroduction) and is presented in hours. The angle-axis indicates the percentage of cells in S/G2/M phase. At least 100 cells were analyzed for each condition and the experiment was repeated three times. Shown are representative data. (H) Cell growth analyses of 4EGI-1-treated and transfected A549 cells. The y-axis shows the percentage increase (if positive) or decrease (if negative) of the total number of cells 42 h after treatment with 4EGI-1. Histogram shows mean ± SD from three independent experiments. Statistical analysis was performed using Student's t-test (unpaired, two-tailed); (NS) nonsignificant; (∗∗∗) P < 0.001. (I) Western blot analysis of transfected and 4EGI-1-treated A549 cell extracts using anti-mTOR antibody. The α-tubulin-specific antibody controls for protein loading. Densitometry measurement of mTOR protein is shown below the autoradiographs (percentage relative to the HBB 5′UTR levels in the control vehicle condition, arbitrarily set to 100%).
DISCUSSION
mTOR protein kinase is a central signaling node that responds to an array of signaling inputs to activate several downstream effector pathways. mTOR is the catalytic subunit of two complexes, mTORC1 and mTORC2, which regulate cell growth, cell-cycle progression, autophagy, metabolism, and protein synthesis, acting as a master switch between anabolic and catabolic processes (Laplante and Sabatini 2012). The regulation and function of mTORC1 and mTORC2 signaling have been the subject of extensive studies; however, little is known about mTOR protein expression regulation itself. To cope with stress conditions, cells can reduce their energy consumption by inhibiting global mRNA translation, directing efforts toward the synthesis of stress-effector proteins, and this can be achieved by inactivating mTORC1 signals. The reversibility of this inactivation is demonstrated by the fact that amino acid replenishment restores S6K activity of amino acid-starved cells (Weingarten-Gabbay et al. 2016). Thus, it is expected that mTOR protein expression itself is not critically reduced by global translational inhibitory conditions to allow cells to bypass adverse conditions and efficiently restore their translational ability by reactivating mTORC1 signaling. Furthermore, mTORC1 can also operate during cellular conditions that reduce mRNA translation by other means, such as in mitosis (Ramirez-Valle et al. 2010). Of note, in these conditions mTOR protein levels remain constant despite the accentuated decrease in the overall protein synthesis rate (Ramirez-Valle et al. 2010). The present work demonstrates that the human mTOR transcript allows both canonical and cap-independent translation, their ratio being different under normal conditions or cellular stress.
The existence of mTOR cap-independent translation is supported by the fact that it induces FLuc activity from a bicistronic pR/F reporter construct expressed in HEK293T, HCT116, A549, HeLa, NCM460, and SW480 cell lines (Fig. 2; Supplemental Fig. S1). The observation that a single and intact dicistronic mRNA is produced from the pR_mTOR_F construct (Fig. 3; Supplemental Fig. S2), obtained through several of the accepted tests for discarding false-positive results (Van Eden 2004; Jackson 2013), in addition to the findings that mTOR 5′UTR induces FLuc expression from a monocistronic A-capped 5′A_mTOR_F mRNA (Figs. 3H, 5D), clearly demonstrates that mTOR 5′UTR mediates cap-independent translation. Moreover, we demonstrate that human mTOR 5′UTR induces the homologous rat mTOR expression from a monocistronic construct when mRNA translation is reduced (Figs. 1C, 6I), which further corroborates the conclusion that the human mTOR 5′UTR can mediate cap-independent translation initiation.
While the structure of viral IRESs has long been a subject of studies, less is known about the RNA secondary structure of cellular cis-acting elements mediating cap-independent translation. Viral IRES have the ability to fold into complex RNA structures that mediate the recruitment of the ribosome and initiation factors (Kieft 2008). Some of the identified cellular IRESs, however, can adopt more loose structures such as the APAF IRES (Mitchell et al. 2003; Weingarten-Gabbay et al. 2016). Here, we established a model for the mTOR 5′UTR secondary structure using chemical and enzymatic probes (Fig. 4A; Supplemental Fig. S3). The probing of the RNA in solution revealed a complex secondary structure that is one of the characteristics of many IRESs. The mTOR 5′UTR structure scaffold is separated into three domains, consisting of domain I, domain II, and domains IIIa to IIIc, respectively (Fig. 4A). The identification of this RNA scaffold strongly suggests that elements of the modular structures might be involved in direct interaction with the ribosome, initiation factors, or other trans-acting factors to mediate cap-independent translation initiation. Of note, domain III encompasses the highly conserved sequences of mTOR 5′UTR (Figs. 2A, 4A) and confers 70% of the full 5′UTR activity (Fig. 2D), while domains I and II alone do not show significant cap-independent activity (Fig. 2D). These results indicate that domain III may play a fundamental role in attracting the translational machinery. Further support to the hypothesis of the involvement of specific motifs of mTOR 5′UTR in the direct recruitment of the translational machinery is reflected by the ability of this sequence to directly interact with the 40S ribosomal subunit (Fig. 4B). Based on these results we can assume that mTOR 5′UTR functions as a cellular IRES, directly binding to the 40S ribosomal subunit, a property that is common to several viral IRESs (Deforges et al. 2015). A cellular IRES that directly interacts with the 40S ribosomal subunit is the c-Src IRES, an IRES that functions analogously to HCV-like IRESs (Allam and Ali 2010). However, we cannot exclude the possibility that mTOR 5′UTR mediates cap-independent translation initiation through a different mechanism, for example, through a cap-independent translational enhancer (Andreev et al. 2012; Zhou et al. 2016). In addition, our data indicate that mTOR cap-independent translation initiation occurs when eIF2 is inactivated, as increased eIF2α phosphorylation does not abolish mTOR cap-independent translation following CoCl2-induced hypoxia (Fig. 5). This suggests that mTOR cap-independent translation initiation may not involve eIF2 to deliver tRNAiMet under stress conditions. Some IRESs, such as HCV-like IRESs, rely on eIF2 in normal conditions, but use alternative factors to deliver tRNAiMet in an eIF2-independent manner under stress conditions (Pestova et al. 2008; Terenin et al. 2008; Dmitriev et al. 2010; Skabkin et al. 2010). Additional studies should therefore aim at characterizing the structure–function relationship of the mTOR 5′UTR and the role of particular domains in interacting with the cellular translational machinery to mediate cap-independent translation initiation.
mTOR signaling potentiates HIF1α mRNA translation and modulates HIF1α-dependent transcriptional induction (Hudson et al. 2002; Bernardi et al. 2006; Land and Tee 2007). Furthermore, it has been suggested that severe exposure to hypoxia is characterized by a biphasic inhibition of mRNA translation in which the first phase (acute response) of inhibition is achieved by PERK-eIF2α phosphorylation activation, which then switches to mTORC1- and 4ET-mediated protein synthesis reduction (Koritzinsky et al. 2006). Therefore, it is tempting to speculate that maintenance of mTOR protein levels through cap-independent translation is a cellular response to maintain mTORC1 functional in the acute phase of hypoxia by creating a positive feedback loop in which hypoxia-induced eIF2α phosphorylation allows cap-independent synthesis of mTOR, which in turn aids HIF1α stabilization.
Our data strongly suggest that the mTOR cap-independent translation is determinant for the function of this kinase, as it ensures that cells enter into the S phase of the cell cycle (Fig. 6). These data also point out a “deleterious effect” of activation of the mTOR cap-independent translation, as an arrest in the G1 phase is beneficial when protein synthesis is reduced (Pardee 1989). Further studies will be performed in order to better understand how mTOR protein levels are regulated in the cell and how these mechanisms impact human health and disease.
MATERIALS AND METHODS
Plasmid constructs
The dicistronic vector carrying Renilla luciferase (RLuc) and firefly luciferase (FLuc) open reading frames (ORFs) was based on the psiRF vector (Tahiri-Alaoui et al. 2009). A splice donor site within RLuc ORF was changed by site-directed mutagenesis, using primers #1 and #2 (Supplemental Table S1). The resulting construct was named psimutRF. In order to prevent translation reinitiation, a sequence of a stable hairpin was PCR amplified with primers #3 and #4 (Supplemental Table S1) from plasmid p53 “A” (Candeias et al. 2006), digested with XhoI and cloned into psimutRF. The resulting construct was named pR_F. Human β-globin (NM_000518; HBB) and mTOR (NM_004958.3; uc001asd.3) 5′UTRs were PCR amplified, using primers #5–#6 and #7–#8, respectively (Supplemental Table S1). In parallel, a fragment from the pR_F vector was amplified with primers #9–#11 and #10–#11 for HBB and mTOR 5′UTRs, respectively. The respective fragments were subjected to SOEing PCR (Horton et al. 1989) with primers #5–#11 and #7–#11 for HBB and mTOR 5′UTRs, respectively (Supplemental Table S1). The resultant PCR products were digested with XmaI/BsrGI or NotI/BsrGI, for HBB and mTOR 5′UTRs, respectively, and cloned into pR_F, generating pR_HBB_F and pR_mTOR_F constructs, respectively. The same strategy was used for cloning MutL homolog 1 (MLH1; NM_000249.3) 5′UTR, but with primers #12–#15 (Supplemental Table S1) and the enzymes XmaI/BsrGI; the resulting construct was called pR_MLH1_F. The mTOR 5′UTR deletional reporter constructs—pR_16-121_F: the mTOR 5′UTR nucleotides (nt) 16–121-containing plasmid; pR_27-121_F; the mTOR 5′UTR nt 27–121-containing plasmid; pR_69-121_F: the mTOR 5′UTR nt 69–121-containing plasmid; pR_92-121_F: the mTOR 5′UTR nt 92–121-containing plasmid; pR_1-15_F: the mTOR 5′UTR nt 1–15-containing plasmid; pR_1-26_F: the mTOR 5′UTR nt 1–26-containing plasmid; pR_1-68_F: the mTOR 5′UTR nt 1–68-containing plasmid—were obtained by SOEing PCR, using the mTOR 5′UTR as template and primers from #16 to #30 (Supplemental Table S1), and cloned into the pR_F dicistronic plasmid using XmaI and BsrGI restriction enzymes. The encephalomyocarditis virus (EMCV) IRES sequence was PCR amplified from the EMCV-IRES-Ova plasmid (Apcher et al. 2009), using primers #31–#32 (Supplemental Table S1). In parallel, psimutR_F vector was amplified with primers #31–#15 (Supplemental Table S1). SOEing PCR was performed with the resulting PCR products using primers #31–#15 (Supplemental Table S1). The generated fragment was digested with EcoRI/AccI and cloned into psimutR_F, creating the psimutR_EMCV_F plasmid. To generate pR_EMCV1_F, the previous plasmid was digested with XmaI/BsrGI and cloned into the pR_F vector. To remove one adenine from a loop located at the intersection of stem J with K of EMCV IRES (Bochkov and Palmenberg 2006) and to correct the Kozak context, site-directed mutagenesis was performed, using primers #34–#35 and #36–#37, respectively (Supplemental Table S1). The originated construct was named pR_EMCV_F.
To generate the promoterless constructs and remove the SV40 promoter and the chimeric intron, pR_F was digested with NheI/BglII, blunt-ended with the Quick Blunting Kit (New England Biolabs) and religated, originating the promoterless_pR_F plasmid. pR_mTOR_F and pR_MLH1_F plasmids were digested with EcoRV/BsrGI and the resulting fragments were cloned into promoterless_pR_F, originating the promoterless_pR_mTOR_F and promoterless_pR_MLH1_F, respectively.
To generate the hpR_x_F subset of constructs, a stable hairpin was PCR amplified with primers #38 and #39 (Supplemental Table S1) from plasmid P53 “C” (Candeias et al. 2006) and cloned into pCR@2.1 TOPO (Life Technologies), generating the hp_TOPO_I construct. The hp_TOPO_I construct was digested with AgeI/HindII and the originated overhangs were filled in using the Quick Blunting Kit (New England Biolabs), originating the hp_TOPO_II construct. The hp_TOPO_II construct was subsequently digested with NheI and the resulting fragment was cloned into the same site of the psimutRF vector. The resulting construct was named hpR_F, in which the hairpin is located at 300 base pairs downstream from the transcription initiation site. The pR_HBB_F and pR_EMCV_F vectors were digested with XmaI/BsrGI, and the resulting fragment containing the HBB 5′UTR or the EMCV IRES was cloned into the same site of the hpR_F vector, originating the hpR_HBB_F and hpR_EMCV_F constructs, respectively. Similarly, the pR_mTOR_F vector was digested with NotI/BsrGI and the resulting fragment containing the mTOR 5′UTR was cloned into the hpR_F vector, previously digested with the same enzymes, originating the hpR_mTOR_F construct.
To obtain the monocistronic reporter constructs, the RLuc ORF sequence was removed from pR_F by SOEing PCR using primers #40–#45 (Supplemental Table S1). PCR product and pR_F were then digested with NheI/BsrGI and the resulting vector and insert were ligated; the resulting construct was called p_F. The 5′UTR of HBB and mTOR, as well as the IRES sequence of c-MYC and EMCV, were cloned using the same restriction enzymes used for the dicistronic constructs explained above, generating the constructs pHBB_F, pmTOR_F, pcMYC_F, and pEMCV_F, respectively.
To generate the Flag-tagged monocistronic constructs, the human mTOR (NM_004958.3) and HBB 5′UTRs were PCR amplified, using primers #46–#47 and #48–#49, respectively (Supplemental Table S1). In parallel, a fragment from rat Myc-mTOR vector (Ramirez-Valle et al. 2010), encoding the rat mTOR protein (NM_019906.1), was amplified with primers #50–#51 and #52–#51 for mTOR and HBB 5′UTRs, respectively (Supplemental Table S1). The respective fragments were subjected to SOEing PCR with primers #46–#51 and #48–#51 for mTOR and HBB 5′UTRs, respectively (Supplemental Table S1). The resulting PCR products were digested with ClaI/EcoRI, and cloned into the rat Myc-mTOR vector, generating the mTOR 5′UTR_RatmTOR and HBB 5′UTR_RatmTOR constructs, respectively. To introduce the sequence encoding the Flag-tag, the 3′ part of the rat Myc-mTOR ORF was PCR amplified using primers #53–#54 (primer #54 contains the sequence encoding the Flag-tag) (Supplemental Table S1). The resultant fragment was digested with BstEII/XbaI and cloned into the same site of the mTOR 5′UTR_RatmTOR and HBB 5′UTR_RatmTOR plasmid constructs, originating the mTOR-5′UTR-mTOR-Flag and HBB-5′UTR-mTOR-Flag constructs, respectively.
Cell culture, drug treatments, and plasmid/siRNA transfection
HEK293T, HeLa, A549, HCT116, and SW480 cells were cultured in Dulbecco's modified Eagle's medium while NCM460 cells were cultured in Roswell Park Memorial Institute 1640 medium, both supplemented with 10% (v/v) fetal bovine serum. Cells were kept at 37°C in a humidified atmosphere containing 5% CO2. Transient transfection was performed using Lipofectamine 2000 (Invitrogen), according to manufacturer's instructions, in 35-mm plates, and then harvested after the appropriate times. To assay FLuc and RLuc activities, cells were transfected with 200 ng (HEK293T), 500 ng (A549), 1 µg (SW480), 2 µg (HeLa and NCM460), or 2.5 µg (HCT116) of each dicistronic plasmid. When necessary, HEK293T, HeLa and A549 cells were cotransfected with the following amounts of pSV-β-Galactosidase control vector (Promega) (β-gal): 200 ng for HEK293T cells, 1 µg for HeLa and A549 cells. For 4EGI-1 and rapamycin treatment, 4 h post-transfection, HEK293T cells were changed to fresh medium supplemented with 250 µM 4EGI-1 (Calbiochem), 30 nM rapamycin (Sigma-Aldrich), or DMSO vehicle during 7 h. HeLa cells were treated, 2 h after transfection, with 100 µM 4EGI-1 and 16 h after cells were further treated with 150 µM 4EGI-1 for 8 h more. To mimic hypoxia, 17 h post-transfection, HEK293T cells were treated with 200 µM CoCl2 (Sigma-Aldrich), or vehicle (H2O), during 24 h.
Transfection of HEK293T cells with short interfering RNA (siRNA) was performed using Lipofectamine 2000 (Invitrogen), according to manufacturer's instructions, in 35-mm plates. For that, HEK293T cells were cotransfected with 200 ng of the dicistronic pR_F, pR_HBB_F, or pR_EMCV_F constructs and 100 pmol of FLuc (5′-GGACGAGGACGAGCACUUC-AA-3′), RLuc (5′-GCU GCAAGCAAAUGAACGU-AA-3′), or control green fluorescent protein (GFP) (5′-GGCUACGUCCAGGAGCGCAC-AA-3′) siRNA oligonucleotides (Thermo Scientific). Twenty hours later, cells were harvested and luciferase activities and total protein content were measured.
In vitro transcription and RNA transfection
p_F, pHBB_F, pmTOR_F, pcMYC_F, and pEMCV_F plasmids were linearized with ClaI downstream from the FLuc ORF, in vitro transcribed with HiScribe T7 Quick High Yield RNA Synthesis Kit (NEB), capped using the 3′-O-Me-m7G(5′)ppp(5′)G RNA Cap Structure Analog (NEB) or the G(5′)ppp(5′)A RNA Cap Structure Analog (NEB), and polyadenylated with E. coli poly(A) polymerase (NEB), according to manufacturer's instructions. RNA samples were treated with Turbo DNase (Ambion) and purified by phenol:chloroform extraction. Transcript quality was analyzed by denaturing formaldehyde–agarose gel electrophoresis. HEK293T cells were cotransfected with 3.75 µg of each RNA along with 500 ng of pSV-β-Galactosidase control vector, using Lipofectamine 2000 (Invitrogen), and luciferase and β-gal activities were assayed 4 h post-transfection.
RNA isolation
Total RNA from transfected cells was prepared using Nucleospin RNA extraction II (Macherey-Nagel) followed by treatment with RNase-free DNase I (Ambion) and purification by phenol:chloroform extraction.
Reverse transcription-PCR and splicing prediction
First-strand cDNA synthesis from 1 µg of total RNA was carried out using SuperScript II Reverse Transcriptase (Life Technologies) and oligod(T) primer, according to the manufacturer's standard protocol. cDNAs were PCR amplified using primers #55 and #56 (Supplemental Table S1) for fragment I, or #57 and #58 (Supplemental Table S1) for fragment II.
Computer-assisted analysis for prediction of potential splice sites was performed with SpliceView (Rogozin and Milanesi 1997) (http://zeus2.itb.cnr.it/~webgene/wwwspliceview_ex.html) and NNSplice (Reese et al. 1997) (http://www.fruitfly.org/seq_tools/splice.html) programs.
Luciferase and β-galactosidase assays
Lysis was performed in all cell lines with Passive Lysis Buffer (Promega) and then cells were subjected to a freeze–thaw cycle at −80°C to 37°C and centrifuged at maximum speed for 5 min. The cell lysates were used to determine luciferase and β-gal activities with the Dual-Luciferase Reporter Assay System (Promega) and Beta-Glo Assay System (Promega), respectively, using the Lucy 2 (Anthos Labtec) or GloMax 96 Microplate (Promega) luminometers, according to the manufacturer's standard protocol. When indicated, total protein content was determined with the Pierce 660 nm Assay Kit (Thermo Scientific) using NanoDrop 2000 (Thermo Scientific). The luciferase values are presented as the units of FLuc or RLuc after being normalized to β-gal or, alternatively, per µg of total protein. Each value was derived from at least three independent experiments.
Coimmunoprecipitation
HeLa cells were transfected with 100 ng of HBB 5′UTR or mTOR 5′UTR plasmid constructs and treated, 2 h later, with 100 µM 4EGI-1 (Calbiochem). After 16 h, cells were further treated with 150 µM 4EGI-1 (Calbiochem) for 8 h more. In parallel, a set of transfected HeLa cells was treated with DMSO vehicle. Cells were washed in cold PBS on ice and lysed with 150 µL of lysis buffer (50 mM Tris–HCl pH 7.5, 10 mM MgCl2, 100 mM NaCl, 10% glycerol, 1% [v/v] Nonidet P-40 and protease inhibitor mixture [Sigma-Aldrich]). Lysates were cleared by centrifugation at 5000 rpm for 10 min at 4°C. A 20 µL aliquot of total lysate (Pre-IP) was used for Western blot analysis. The remaining lysate was incubated with 2 µg of eIF4E antibody (Santa Cruz Biotechnology), at 4°C. One hour later, samples were incubated with Protein G-agarose beads (Roche) at 4°C overnight. The complexes were washed three times with wash buffer (50 mM Tris–HCl pH 7.5, 10 mM MgCl2, 100 mM NaCl, 10% glycerol, 1% [v/v] Nonidet P-40). After complete removal of wash buffer, 25 µL of 2× Laemmli sample buffer (Bio-Rad) was added and the samples were boiled for 10 min at 95°C.
SDS-PAGE and Western blot
Protein lysates were resolved, according to standard protocols, in 15%, 12%, 10%, or 8% SDS-PAGE and transferred to PVDF membranes (Bio-Rad). Membranes were probed using rabbit polyclonal anti-mTOR (Sigma) at 1:1500 dilution, or monoclonal anti-mTOR (Cell Signalling) at 1:1000 dilution, mouse monoclonal anti-HIF1α (BD Biosciences) at 1:750 dilution, rabbit monoclonal anti-PARP (Cell Signalling) at 1:750 dilution, rabbit monoclonal anti-Phospho-p70 S6 Kinase (Thr389) (Cell Signalling) at 1:1000 dilution, rabbit monoclonal anti-p70 S6K (Cell Signalling) at 1:750 dilution, rabbit polyclonal anti-Phospho-eIF2α (Ser52) (Invitrogen) at 1:750 dilution, rabbit polyclonal anti-eIF2α (Cell Signalling) at 1:500 dilution, rabbit polyclonal anti-eIF4G (Cell Signalling) at 1:1000 dilution, rabbit polyclonal anti-eIF4E (Abcam) at 1:2500 dilution, rabbit polyclonal anti-c-myc (Santa Cruz Biotechnology) at 1:250 dilution, mouse monoclonal anti-Flag M2 (Sigma-Aldrich) at 1:4000 dilution, mouse monoclonal anti-cyclin D1 (BD Biosciences) at a 1:1000 dilution, rabbit polyclonal anti-phospho-4E-BP (Santa Cruz Biotechnology) at 1:300 dilution, mouse monoclonal anti-α-tubulin (Sigma-Aldrich) at 1:10,000 dilution, mouse monoclonal anti β-actin (Sigma-Aldrich) at 1:2000 dilution or mouse monoclonal anti-PCNA (Calbiochem) at 1:1000 dilution. Detection was carried out using secondary peroxidase-conjugated anti-mouse IgG (Bio-Rad), anti-rabbit IgG (Bio-Rad), or anti-goat (Santa Cruz Biotechnology) antibodies followed by enhanced chemiluminescence (ECL).
RNA structure determination
The secondary structure of the mTOR 5′UTR was probed using dimethyl sulphate (DMS), N-cyclohexyl-N′-[N-methylmorpholinoethyl]-carbodiimid-4-toluenesulfonate (CMCT) and RNase V1 and analyzed by reverse extension as described previously (Jang et al. 1988; Candeias et al. 2006; Moerke et al. 2007). RNA (2 pmol) was resuspended in 20 µL of a buffer containing 20 mM Tris, 100 mM K acetate, 200 mM KCl, 2.5 mM MgCl2, and 1 mM dithiothreitol (DTT) (pH 7.5) (DMS), 20 mM Tris, 5 mM MgCl2, and 100 mM KCl (pH 7.5) (V1), or 50 mM borate–NaOH and 1 mM EDTA (pH 8.0) (CMCT), denatured for 1 min at 95°C and cooled on ice. DMS (0.395 M), CMCT (2, 4, or 10 mg/mL), or RNase V1 (0.01, 0.02, or 0.05 U) was added, and the mixture was incubated for 1, 5, or 10 min (DMS), 20 min (CMCT), or 5 min (RNase V1). The modified RNA was then immediately ethanol precipitated on dry ice in the presence of 0.3 M ammonium acetate, washed with 70% ethanol, and resuspended in 8 µL of water. Modifications were revealed by reverse transcriptase using 32P-labeled primer and avian myeloblastosis virus reverse transcriptase (Promega). The products were resolved on a 7 M urea 6% polyacrylamide gel and revealed using a fluorescent screen and a Typhoon FLA7000 (GE Healthcare). Data were then interpreted and analyzed using the software MFold (Zuker 2003) (http://mfold.rna.albany.edu).
Filter binding assays
The filter binding assays were performed as described before without modification (Willcocks et al. 2011). Control RNA encoding the CSFV IRES (1-427; Paderborn strain) was generated by standard molecular cloning using a bicistronic plasmid containing the CSFV IRES as previously described (Othman et al. 2014). Briefly, CSFV IRES, and mTOR and HBB 5′UTR RNAs were transcribed in vitro in the presence of α-32P-UTP (3000 mCi/mmol). The 40S ribosomal subunits were prepared following previously established procedures from HeLa cells (Pisarev et al. 2007). Radiolabeled RNA (50 fmol) was incubated with serial dilutions of a 40S subunit in binding buffer (20 mM Tris [pH 7.6], 100 mM KCl, 2 mM DTT, 2 mM MgCl2) and incubated at 37°C for 15 min before performing filter binding assays. Bound RNA was quantified using a Typhoon FLA7000 (GE Healthcare). To determine the apparent dissociation constant (Kd), the data were fitted to a Langmuir isotherm described by the equation θ = P/(P + Kd), where θ is the fraction of RNA bound and P is the 40S subunit concentration. Reported values are the average of results from three repetitions with standard errors. All calculations were performed with GraphPad Prism 7.
Cell-cycle analyses
For FACS analysis, A549 cells were transfected with 2 µg of the HBB 5′UTR, mTOR 5′UTR, or empty vector and submitted to serum starvation for 30 h, to arrest cells in G0/G1. Serum and 250 µM 4EGI-1 or DMSO were added 18 and 12 h before harvest, respectively. Cells were then fixed with ice-cold 70% ethanol. After 30 min incubation with RNase at 37°C, cells were stained with 50 mg/mL propidium iodide (Sigma-Aldrich), and cell-cycle distribution was analyzed using FACSAria II flow cytometer (BD Biosciences) and FlowJo Software.
For single-cell analysis using fucci, A549 cells stably expressing fucci constructs (gift from Michiyuki Matsuda) were transfected with 2 µg of the HBB 5′UTR, mTOR 5′UTR, or the empty vector and submitted to serum starvation for 30 h, to arrest cells in G0/G1. Serum and 250 µM 4EGI-1 or DMSO were added 4 and 0 h before imaging, respectively. Imaging was initiated after 4EGI-1 addition using a computer-assisted incubator fluorescence microscope (Olympus, LCV100) equipped with an objective lens (Olympus, UAPO 403/340 N.A. = 0.90), a halogen lamp, a red LED (620 nm), a CCD camera (Olympus, DP30), differential interference contrast (DIC) optical components, and interference filters. For fluorescence imaging, the halogen lamp was used with two filter cubes, one with excitation (BP520-540HQ) and emission (BP555-600HQ) filters for observing mKO2 fluorescence, and the other with excitation (470DF35) and emission (510WB40) filters for observing mAG fluorescence. For DIC imaging, the red LED was used with a filter cube containing an analyzer. Image acquisition and analysis were performed by using MetaMorph 6.13 software (Universal Imaging, Media, PA).
Statistical analyses
Data are presented as mean ± SD of at least three independent experiments. Test F was used for evaluation of variances equality. Student's two-tailed t-test was used for estimation of statistical significance. Significance for statistical analysis was defined as P < 0.05.
SUPPLEMENTAL MATERIAL
Supplemental material is available for this article.
Supplementary Material
ACKNOWLEDGMENTS
This work was partially supported by Fundação Merck Sharp and Dohme and Fundação para a Ciência e a Tecnologia (FCT) through center grant UID/MULTI/04046/2013 (to BioISI) and research grant PTDC/BIM-ONC/4890/2014. A.M.-R., J.M., and R.L. were supported by fellowships from FCT (SFRH/BD/33462/2008 to A.M.-R., FCT/SFRH/BPD/98360/2013 to J.M., and SFRH/BD/74778/2010 and PTDC/BIM-ONC/4890/2014 to R.L.). M.M.C. was supported by fellowships from the Japan Society for the Promotion of Science (JSPS/FF1/184), AXA Research Fund, JSPS Grant-in-Aid for Young Scientists (B) (16K21111), and PTDC/BIM-ONC/4890/2014. We thank A. Tahiri-Alaoui (University of Oxford, Oxford, UK) for providing the psiRF vector, R. Schneider (NYU School of Medicine, NY) for providing the rat Myc-mTOR vector, M. Matsuda (Kyoto University, Kyoto, Japan) for providing the A549 cells stably expressing mKO2-hCdt1 and mAG-hGeminin, P. Jordan (Instituto Nacional de Saúde Doutor Ricardo Jorge, Lisboa, Portugal) for providing anti-PCNA, anti-PARP, anti-cyclin D1, and anti-β-actin antibodies, G. Belsham (National Veterinary Institute, Lindholm, Denmark) for providing the bicistronic plasmid containing the CSFV IRES, and B. Silva (Instituto Nacional de Saúde Doutor Ricardo Jorge, Lisboa, Portugal) for technical support.
Footnotes
Article is online at http://www.rnajournal.org/cgi/doi/10.1261/rna.063040.117.
REFERENCES
- Allam H, Ali N. 2010. Initiation factor eIF2-independent mode of c-Src mRNA translation occurs via an internal ribosome entry site. J Biol Chem 285: 5713–5725. [DOI] [PMC free article] [PubMed] [Google Scholar]
- Andreev DE, Dmitriev SE, Zinovkin R, Terenin IM, Shatsky IN. 2012. The 5′ untranslated region of Apaf-1 mRNA directs translation under apoptosis conditions via a 5′ end-dependent scanning mechanism. FEBS Lett 586: 4139–4143. [DOI] [PubMed] [Google Scholar]
- Apcher S, Komarova A, Daskalogianni C, Yin Y, Malbert-Colas L, Fahraeus R. 2009. mRNA translation regulation by the Gly-Ala repeat of Epstein-Barr virus nuclear antigen 1. J Virol 83: 1289–1298. [DOI] [PMC free article] [PubMed] [Google Scholar]
- Arita M, Zhong X, Min Z, Hemmi H, Shimatake H. 2003. Multiple sites required for expression in 5′-flanking region of the hMLH1 gene. Gene 306: 57–65. [DOI] [PubMed] [Google Scholar]
- Barbosa C, Romão L. 2014. Translation of the human erythropoietin transcript is regulated by an upstream open reading frame in response to hypoxia. RNA 20: 594– 608. [DOI] [PMC free article] [PubMed] [Google Scholar]
- Ben-Asouli Y, Banai Y, Pel-Or Y, Shir A, Kaempfer R. 2002. Human interferon-γ mRNA autoregulates its translation through a pseudoknot that activates the interferon-inducible protein kinase PKR. Cell 108: 221–232. [DOI] [PubMed] [Google Scholar]
- Beretta L, Gingras AC, Svitkin YV, Hall MN, Sonenberg N. 1996. Rapamycin blocks the phosphorylation of 4E-BP1 and inhibits cap-dependent initiation of translation. EMBO J 15: 658–664. [PMC free article] [PubMed] [Google Scholar]
- Bernardi R, Guernah I, Jin D, Grisendi S, Alimonti A, Teruya-Feldstein J, Cordon-Cardo C, Celeste Simon M, Rafii S, Pandolfi PP. 2006. PML inhibits HIF-1α translation and neoangiogenesis through repression of mTOR. Nature 442: 779–785. [DOI] [PubMed] [Google Scholar]
- Bochkov Y, Palmenberg A. 2006. Translational efficiency of EMCV IRES in bicistronic vectors is dependent upon IRES sequence and gene location. BioTechniques 41: 283–292. [DOI] [PubMed] [Google Scholar]
- Brunn GJ, Hudson CC, Sekulić A, Williams JM, Hosoi H, Houghton PJ, Lawrence JC Jr, Abraham RT. 1997. Phosphorylation of the translational repressor PHAS-I by the mammalian target of rapamycin. Science 277: 99–101. [DOI] [PubMed] [Google Scholar]
- Candeias MM, Powell DJ, Roubalova E, Apcher S, Bourougaa K, Vojtesek B, Bruzzoni-Giovanelli H, Fåhraeus R. 2006. Expression of p53 and p53/47 are controlled by alternative mechanisms of messenger RNA translation initiation. Oncogene 25: 6936–6947. [DOI] [PubMed] [Google Scholar]
- Chan CP, Kok KH, Tang HMV, Wong CM, Jin DY. 2013. Internal ribosome entry site-mediated translational regulation of ATF4 splice variant in mammalian unfolded protein response. Biochim Biophys Acta 1833: 2165–2175. [DOI] [PubMed] [Google Scholar]
- Dai J, Liu ZQ, Wang XQ, Lin J, Yao PF, Huang SL, Ou TM, Tan JH, Li D, Gu LQ, et al. 2015. Discovery of small molecules for up-regulating the translation of antiamyloidogenic secretase, a disintegrin and metalloproteinase 10 (ADAM10), by binding to the G-quadruplex-forming sequence in the 5′ untranslated region (UTR) of its mRNA. J Med Chem 58: 3875–3891. [DOI] [PubMed] [Google Scholar]
- Deforges J, Locker N, Sargueil B. 2015. mRNAs that specifically interact with eukaryotic ribosomal subunits. Biochimie 114: 48–57. [DOI] [PubMed] [Google Scholar]
- Dikstein R. 2012. Transcription and translation in a package deal: the TISU paradigm. Gene 491: 1–4. [DOI] [PubMed] [Google Scholar]
- Dmitriev SE, Terenin IM, Andreev DE, Ivanov PA, Dunaevsky JE, Merrick WC, Shatsky IN. 2010. GTP-independent tRNA delivery to the ribosomal P-site by a novel eukaryotic translation factor. J Biol Chem 285: 26779–26787. [DOI] [PMC free article] [PubMed] [Google Scholar]
- Elfakess R, Dikstein R. 2008. A translation initiation element specific to mRNAs with very short 5′UTR that also regulates transcription. PLoS One 3: e3094. [DOI] [PMC free article] [PubMed] [Google Scholar]
- Elfakess R, Sinvani H, Haimov O, Svitkin Y, Sonenberg N, Dikstein R. 2011. Unique translation initiation of mRNAs-containing TISU element. Nucleic Acids Res 39: 7598–7609. [DOI] [PMC free article] [PubMed] [Google Scholar]
- Filbin ME, Kieft JS. 2009. Toward a structural understanding of IRES RNA function. Curr Opin Struct Biol 19: 267–276. [DOI] [PMC free article] [PubMed] [Google Scholar]
- Fingar DC, Blenis J. 2004. Target of rapamycin (TOR): an integrator of nutrient and growth factor signals and coordinator of cell growth and cell cycle progression. Oncogene 23: 3151–3171. [DOI] [PubMed] [Google Scholar]
- Fingar DC, Richardson CJ, Tee AR, Cheatham L, Tsou C, Blenis J. 2004. mTOR controls cell cycle progression through its cell growth effectors S6K1 and 4E-BP1/eukaryotic translation initiation factor 4E. Mol Cell Biol 24: 200–216. [DOI] [PMC free article] [PubMed] [Google Scholar]
- Genolet R, Rahim G, Gubler-Jaquier P, Curran J. 2011. The translational response of the human mdm2 gene in HEK293T cells exposed to rapamycin: a role for the 5′-UTRs. Nucleic Acids Res 39: 989–1003. [DOI] [PMC free article] [PubMed] [Google Scholar]
- Gerlitz G, Jagus R, Elroy-Stein O. 2002. Phosphorylation of initiation factor-2α is required for activation of internal translation initiation during cell differentiation. Eur J Biochem 269: 2810–2819. [DOI] [PubMed] [Google Scholar]
- Groebe DR, Busch MR, Tsao TY, Luh FY, Tam MF, Chung AE, Gaskell M, Liebhaber SA, Ho C. 1992. High-level production of human α- and β-globins in insect cells. Protein Expr Purif 3: 134–141. [DOI] [PubMed] [Google Scholar]
- Haimov O, Sinvani H, Dikstein R. 2015. Cap-dependent, scanning-free translation initiation mechanisms. Biochim Biophys Acta 1849: 1313–1318. [DOI] [PubMed] [Google Scholar]
- Hay N, Sonenberg N. 2004. Upstream and downstream of mTOR. Genes Dev 18: 1926–1945. [DOI] [PubMed] [Google Scholar]
- Holcik M, Sonenberg N. 2005. Translational control in stress and apoptosis. Nat Rev Mol Cell Biol 6: 318–327. [DOI] [PubMed] [Google Scholar]
- Horton RM, Hunt HD, Ho SN, Pullen JK, Pease LR. 1989. Engineering hybrid genes without the use of restriction enzymes: gene splicing by overlap extension. Gene 77: 61–68. [DOI] [PubMed] [Google Scholar]
- Huang K, Fingar DC. 2014. Growing knowledge of the mTOR signaling network. Semin Cell Dev Biol 36: 79–90. [DOI] [PMC free article] [PubMed] [Google Scholar]
- Hudson CC, Liu M, Chiang GG, Otterness DM, Loomis DC, Kaper F, Giaccia AJ, Abraham RT. 2002. Regulation of hypoxia-inducible factor 1 expression and function by the mammalian target of rapamycin. Mol Cell Biol 22: 7004–7014. [DOI] [PMC free article] [PubMed] [Google Scholar]
- Ito E, Yanagisawa Y, Iwahashi Y, Suzuki Y, Nagasaki H, Akiyama Y, Sugano S, Yuasa Y, Maruyama K. 1999. A core promoter and a frequent single-nucleotide polymorphism of the mismatch repair gene hMLH1. Biochem Biophys Res Commun 256: 488–494. [DOI] [PubMed] [Google Scholar]
- Jackson RJ. 2013. The current status of vertebrate cellular mRNA IRESs. Cold Spring Harb Perspect Biol 5: a011569. [DOI] [PMC free article] [PubMed] [Google Scholar]
- Jackson RJ, Hellen CUT, Pestova TV. 2010. The mechanism of eukaryotic translation initiation and principles of its regulation. Nat Rev Mol Cell Biol 11: 113–127. [DOI] [PMC free article] [PubMed] [Google Scholar]
- Jang SK, Kräusslich HG, Nicklin MJ, Duke GM, Palmenberg AC, Wimmer E. 1988. A segment of the 5′ nontranslated region of encephalomyocarditis virus RNA directs internal entry of ribosomes during in vitro translation. J Virol 62: 2636–2643. [DOI] [PMC free article] [PubMed] [Google Scholar]
- Kato H, Nakajima S, Saito Y, Takahashi S, Katoh R, Kitamura M. 2011. mTORC1 serves ER stress-triggered apoptosis via selective activation of the IRE1–JNK pathway. Cell Death Differ 19: 310–320. [DOI] [PMC free article] [PubMed] [Google Scholar]
- Kaur A, Sharma S. 2017. Mammalian target of rapamycin (mTOR) as a potential therapeutic target in various diseases. Inflammopharmacology 25: 293–312. [DOI] [PubMed] [Google Scholar]
- Kieft JS. 2008. Viral IRES RNA structures and ribosome interactions. Trends Biochem Sci 33: 274–283. [DOI] [PMC free article] [PubMed] [Google Scholar]
- Koh DC, Edelman GM, Mauro VP. 2013. Physical evidence supporting a ribosomal shunting mechanism of translation initiation for BACE1 mRNA. Translation (Austin, Tex) 1: e24400. [DOI] [PMC free article] [PubMed] [Google Scholar]
- Koritzinsky M, Magagnin MG, van den Beucken T, Seigneuric R, Savelkouls K, Dostie J, Pyronnet S, Kaufman RJ, Weppler SA, Voncken JW, et al. 2006. Gene expression during acute and prolonged hypoxia is regulated by distinct mechanisms of translational control. EMBO J 25: 1114–1125. [DOI] [PMC free article] [PubMed] [Google Scholar]
- Koumenis C, Naczki C, Koritzinsky M, Rastani S, Diehl A, Sonenberg N, Koromilas A, Wouters BG. 2002. Regulation of protein synthesis by hypoxia via activation of the endoplasmic reticulum kinase perk and phosphorylation of the translation initiation factor eIF2. Mol Cell Biol 22: 7405–7416. [DOI] [PMC free article] [PubMed] [Google Scholar]
- Kumari S, Bugaut A, Huppert JL, Balasubramanian S. 2007. An RNA G-quadruplex in the 5′ UTR of the NRAS proto-oncogene modulates translation. Nat Chem Biol 3: 218–221. [DOI] [PMC free article] [PubMed] [Google Scholar]
- Lacerda R, Menezes J, Romão L. 2017. More than just scanning: the importance of cap-independent mRNA translation initiation for cellular stress response and cancer. Cell Mol Life Sci 74: 1659–1680. [DOI] [PMC free article] [PubMed] [Google Scholar]
- Land SC, Tee AR. 2007. Hypoxia-inducible factor 1α is regulated by the mammalian target of rapamycin (mTOR) via an mTOR signaling motif. J Biol Chem 282: 20534–20543. [DOI] [PubMed] [Google Scholar]
- Laplante M, Sabatini DM. 2012. mTOR signaling in growth control and disease. Cell 149: 274–293. [DOI] [PMC free article] [PubMed] [Google Scholar]
- Leprivier G, Rotblat B, Khan D, Jan E, Sorensen PH. 2015. Stress-mediated translational control in cancer cells. Biochim Biophys Acta 1849: 845–860. [DOI] [PubMed] [Google Scholar]
- Liu B, Qian S-B. 2014. Translational reprogramming in cellular stress response. Wiley Interdiscip Rev RNA 5: 301–305. [DOI] [PMC free article] [PubMed] [Google Scholar]
- Lockard RE, Lane C. 1978. Requirement for 7-methylguanosine in translation of globin mRNA in vivo. Nucleic Acids Res 5: 3237–3248. [DOI] [PMC free article] [PubMed] [Google Scholar]
- Locker N, Chamond N, Sargueil B. 2011. A conserved structure within the HIV gag open reading frame that controls translation initiation directly recruits the 40S subunit and eIF3. Nucleic Acids Res 39: 2367–2377. [DOI] [PMC free article] [PubMed] [Google Scholar]
- Mader S, Lee H, Pause A, Sonenberg N. 1995. The translation initiation factor eIF-4E binds to a common motif shared by the translation factor eIF-4γ and the translational repressors 4E-binding proteins. Mol Cell Biol 15: 4990–4997. [DOI] [PMC free article] [PubMed] [Google Scholar]
- Marash L, Liberman N, Henis-Korenblit S, Sivan G, Reem E, Elroy-Stein O, Kimchi A. 2008. DAP5 promotes cap-independent translation of Bcl-2 and CDK1 to facilitate cell survival during mitosis. Mol Cell 30: 447–459. [DOI] [PubMed] [Google Scholar]
- Martínez-Salas E, Piñeiro D, Fernández N. 2012. Alternative mechanisms to initiate translation in eukaryotic mRNAs. Comp Funct Genomics 2012: 391546. [DOI] [PMC free article] [PubMed] [Google Scholar]
- Merrick WC. 2004. Cap-dependent and cap-independent translation in eukaryotic systems. Gene 332: 1–11. [DOI] [PubMed] [Google Scholar]
- Mitchell SA, Spriggs KA, Coldwell MJ, Jackson RJ, Willis AE. 2003. The Apaf-1 internal ribosome entry segment attains the correct structural conformation for function via interactions with PTB and unr. Mol Cell 11: 757–771. [DOI] [PubMed] [Google Scholar]
- Moerke NJ, Aktas H, Chen H, Cantel S, Reibarkh MY, Fahmy A, Gross JD, Degterev A, Yuan J, Chorev M, et al. 2007. Small-molecule inhibition of the interaction between the translation initiation factors eIF4E and eIF4G. Cell 128: 257–267. [DOI] [PubMed] [Google Scholar]
- Morfoisse F, Kuchnio A, Frainay C, Gomez-Brouchet A, Delisle M-B, Marzi S, Helfer A-C, Hantelys F, Pujol F, Guillermet-Guibert J, et al. 2014. Hypoxia induces VEGF-C expression in metastatic tumor cells via a HIF-1α-independent translation-mediated mechanism. Cell Rep 6: 155–167. [DOI] [PubMed] [Google Scholar]
- Morley SJ, Coldwell MJ. 2008. A cunning stunt: an alternative mechanism of eukaryotic translation initiation. Sci Signal 1: pe32. [DOI] [PubMed] [Google Scholar]
- Oh WJ, Jacinto E. 2011. mTOR complex 2 signaling and functions. Cell Cycle 10: 2305–2316. [DOI] [PMC free article] [PubMed] [Google Scholar]
- Othman Z, Sulaiman MK, Willcocks MM, Ulryck N, Blackbourn DJ, Sargueil B, Roberts LO, Locker N. 2014. Functional analysis of Kaposi's sarcoma-associated herpesvirus vFLIP expression reveals a new mode of IRES-mediated translation. RNA 20: 1803–1814. [DOI] [PMC free article] [PubMed] [Google Scholar]
- Pardee AB. 1989. G1 events and regulation of cell proliferation. Science 246: 603–608. [DOI] [PubMed] [Google Scholar]
- Pavitt GD. 2005. eIF2B, a mediator of general and gene-specific translational control. Biochem Soc Trans 33: 1487–1492. [DOI] [PubMed] [Google Scholar]
- Pestova TV, de Breyne S, Pisarev AV, Abaeva IS, Hellen CU. 2008. eIF2-dependent and eIF2-independent modes of initiation on the CSFV IRES: a common role of domain II. EMBO J 27: 1060–1072. [DOI] [PMC free article] [PubMed] [Google Scholar]
- Piccirillo CA, Bjur E, Topisirovic I, Sonenberg N, Larsson O. 2014. Translational control of immune responses: from transcripts to translatomes. Nat Immunol 15: 503–511. [DOI] [PubMed] [Google Scholar]
- Pisarev AV, Unbehaun A, Hellen CUT, Pestova TV. 2007. Assembly and analysis of eukaryotic translation initiation complexes. Methods Enzymol 430: 147–177. [DOI] [PubMed] [Google Scholar]
- Ramirez-Valle F, Badura ML, Braunstein S, Narasimhan M, Schneider RJ. 2010. Mitotic raptor promotes mTORC1 activity, G2/M cell cycle progression, and internal ribosome entry site-mediated mRNA translation. Mol Cell Biol 30: 3151–3164. [DOI] [PMC free article] [PubMed] [Google Scholar]
- Reese MG, Eeckman FH, Kulp D, Haussler D. 1997. Improved splice site detection in Genie. J Comput Biol 4: 311–323. [DOI] [PubMed] [Google Scholar]
- Rogozin IB, Milanesi L. 1997. Analysis of donor splice sites in different eukaryotic organisms. J Mol Evol 45: 50–59. [DOI] [PubMed] [Google Scholar]
- Sajjanar B, Deb R, Raina SK, Pawar S, Brahmane MP, Nirmale AV, Kurade NP, Manjunathareddy GB, Bal SK, Singh NP. 2017. Untranslated regions (UTRs) orchestrate translation reprogramming in cellular stress responses. J Therm Biol 65: 69–75. [DOI] [PubMed] [Google Scholar]
- Sakaue-Sawano A, Kurokawa H, Morimura T, Hanyu A, Hama H, Osawa H, Kashiwagi S, Fukami K, Miyata T, Miyoshi H, et al. 2008. Visualizing spatiotemporal dynamics of multicellular cell-cycle progression. Cell 132: 487–498. [DOI] [PubMed] [Google Scholar]
- Schmelzle T, Hall MN. 2000. TOR, a central controller of cell growth. Cell 103: 253–262. [DOI] [PubMed] [Google Scholar]
- Schofield JPR, Cowan JL, Coldwell MJ. 2015. G-quadruplexes mediate local translation in neurons. Biochem Soc Trans 43: 338–342. [DOI] [PubMed] [Google Scholar]
- Shakin SH, Liebhaber SA. 1986. Translational profiles of alpha 1-, alpha 2-, and beta-globin messenger ribonucleic acids in human reticulocytes. J Clin Invest 78: 1125–1129. [DOI] [PMC free article] [PubMed] [Google Scholar]
- Shatsky IN, Dmitriev SE, Terenin IM, Andreev DEE. 2010. Cap- and IRES-independent scanning mechanism of translation initiation as an alternative to the concept of cellular IRESs. Mol Cells 30: 285–293. [DOI] [PubMed] [Google Scholar]
- Skabkin MA, Skabkina OV, Dhote V, Komar AA, Hellen CUT, Pestova TV. 2010. Activities of Ligatin and MCT-1/DENR in eukaryotic translation initiation and ribosomal recycling. Genes Dev 24: 1787–1801. [DOI] [PMC free article] [PubMed] [Google Scholar]
- Sonenberg N, Hinnebusch AG. 2007. New modes of translational control in development, behavior, and disease. Mol Cell 28: 721–729. [DOI] [PubMed] [Google Scholar]
- Sonenberg N, Hinnebusch AG. 2009. Regulation of translation initiation in eukaryotes: mechanisms and biological targets. Cell 136: 731–745. [DOI] [PMC free article] [PubMed] [Google Scholar]
- Stoneley M, Paulin FE, Le Quesne JP, Chappell SA, Willis AE. 1998. C-Myc 5′ untranslated region contains an internal ribosome entry segment. Oncogene 16: 423–428. [DOI] [PubMed] [Google Scholar]
- Tahiri-Alaoui A, Smith LP, Baigent S, Kgosana L, Petherbridge LJ, Lambeth LS, James W, Nair V. 2009. Identification of an intercistronic internal ribosome entry site in a Marek's disease virus immediate-early gene. J Virol 83: 5846–5853. [DOI] [PMC free article] [PubMed] [Google Scholar]
- Terenin IM, Dmitriev SE, Andreev DE, Shatsky IN. 2008. Eukaryotic translation initiation machinery can operate in a bacterial-like mode without eIF2. Nat Struct Mol Biol 15: 836–841. [DOI] [PubMed] [Google Scholar]
- Terenin IM, Andreev DE, Dmitriev SE, Shatsky IN. 2013. A novel mechanism of eukaryotic translation initiation that is neither m7G-cap-, nor IRES-dependent. Nucleic Acids Res 41: 1807–1816. [DOI] [PMC free article] [PubMed] [Google Scholar]
- Van Eden ME. 2004. Demonstrating internal ribosome entry sites in eukaryotic mRNAs using stringent RNA test procedures. RNA 10: 720–730. [DOI] [PMC free article] [PubMed] [Google Scholar]
- Vilella-Bach M, Nuzzi P, Fang Y, Chen J. 1999. The FKBP12-rapamycin-binding domain is required for FKBP12-rapamycin-associated protein kinase activity and G1 progression. J Biol Chem 274: 4266–4272. [DOI] [PubMed] [Google Scholar]
- Wang GL, Jiang BH, Rue EA, Semenza GL. 1995. Hypoxia-inducible factor 1 is a basic-helix-loop-helix-PAS heterodimer regulated by cellular O2 tension. Proc Natl Acad Sci 92: 5510–5514. [DOI] [PMC free article] [PubMed] [Google Scholar]
- Weingarten-Gabbay S, Elias-Kirma S, Nir R, Gritsenko AA, Stern-Ginossar N, Yakhini Z, Weinberger A, Segal E. 2016. Systematic discovery of cap-independent translation sequences in human and viral genomes. Science 351: aad4939. [DOI] [PubMed] [Google Scholar]
- Willcocks MM, Locker N, Gomwalk Z, Royall E, Bakhshesh M, Belsham GJ, Idamakanti N, Burroughs KD, Reddy PS, Hallenbeck PL, et al. 2011. Structural features of the seneca valley virus internal ribosome entry site (IRES) element: a picornavirus with a pestivirus-like IRES. J Virol 85: 4452–4461. [DOI] [PMC free article] [PubMed] [Google Scholar]
- Xue S, Tian S, Fujii K, Kladwang W, Das R, Barna M. 2015. RNA regulons in Hox 5′ UTRs confer ribosome specificity to gene regulation. Nature 517: 33–38. [DOI] [PMC free article] [PubMed] [Google Scholar]
- Zhou J, Rode KA, Qian S-B. 2016. m6A: a novel hallmark of translation. Cell Cycle 15: 309–310. [DOI] [PMC free article] [PubMed] [Google Scholar]
- Zuker M. 2003. Mfold web server for nucleic acid folding and hybridization prediction. Nucleic Acids Res 31: 3406–3415. [DOI] [PMC free article] [PubMed] [Google Scholar]
Associated Data
This section collects any data citations, data availability statements, or supplementary materials included in this article.