Abstract
Super-enhancers are characterized by high levels of Mediator binding and are major contributors to the expression of their associated genes. They exhibit high levels of local chromatin interactions and a higher order of local chromatin organization. On the other hand, lncRNAs can localize to specific DNA sites by forming a RNA:DNA:DNA triplex, which in turn can contribute to local chromatin organization. In this paper, we characterize a new class of lncRNAs called super-lncRNAs that target super-enhancers and which can contribute to the local chromatin organization of the super-enhancers. Using a logistic regression model based on the number of RNA:DNA:DNA triplex sites a lncRNA forms within the super-enhancer, we identify 442 unique super-lncRNA transcripts in 27 different human cell and tissue types; 70% of these super-lncRNAs were tissue restricted. They primarily harbor a single triplex-forming repeat domain, which forms an RNA:DNA:DNA triplex with multiple anchor DNA sites (originating from transposable elements) within the super-enhancers. Super-lncRNAs can be grouped into 17 different clusters based on the tissue or cell lines they target. Super-lncRNAs in a particular cluster share common short structural motifs and their corresponding super-enhancer targets are associated with gene ontology terms pertaining to the tissue or cell line. Super-lncRNAs may use these structural motifs to recruit and transport necessary regulators (such as transcription factors and Mediator complexes) to super-enhancers, influence chromatin organization, and act as spatial amplifiers for key tissue-specific genes associated with super-enhancers.
Keywords: logistic regression, long-noncoding RNAs, super-enhancers, transposable elements, triplex
INTRODUCTION
Super-enhancers are clusters of enhancers that are characterized by high levels of Mediator binding and associated primarily with tissue-specific genes (Hnisz et al. 2013; Pott and Lieb 2014; Khan and Zhang 2016). Super-enhancers are most likely the major contributors to the expression of their associated genes. For example, super-enhancers associated with Sox2 and Gata2 contribute to 90% and 80% of their expression, respectively (Gröschel et al. 2014; Li et al. 2014); adipogenic-specific gene expression (Siersbæk et al. 2014) has been shown to be driven by their respective super-enhancers. There have also been several indications of links between super-enhancers and diseases. In general, super-enhancers are enriched for disease-associated variants, which are highest in tissues pertaining to that particular disease (Hnisz et al. 2013); especially in cancer, rearranged genomic regions overlap significantly with super-enhancers (Gröschel et al. 2014).
Super-enhancers host binding sites for different transcription factors and the cooperation between these factors is important for enhancer activity and transcription reprogramming (Siersbæk et al. 2014). The cooperativity between the different factors extends to interactions between different sites within the super-enhancers (Siersbæk et al. 2014). Studies suggest that super-enhancers exhibit high levels of local chromatin interactions and a higher order of local chromatin organization, which are necessary for driving expression of important genes. However, what coordinates the local chromatin organization within the super-enhancers and what recruits the regulatory complexes to the super-enhancers are yet to be fully explored. In this paper, we propose that a subset of lncRNAs targets super-enhancers and contributes to the chromatin organization in the super-enhancers.
Studies have shown that lncRNAs interact with proteins using specific domains (Engreitz et al. 2016) and serve as scaffolds that govern the function of different transcription regulatory complexes. LncRNAs, while acting as scaffolds, localize to specific DNA sites while transporting the regulatory complexes to appropriate genomic locations (Chu et al. 2011; Grote and Herrmann 2013; Engreitz et al. 2016; Long et al. 2016). Separate studies on lncRNAs (such as Fendrr and Tug1) have indicated that they localize at various genomic regions by forming a RNA:DNA:DNA triplex. This conclusion was further validated by a matching result between genome-wide triplexator's prediction of triplex helix DNA target sites by lncRNA HOTAIR and the peaks obtained using the CHIRP-seq experiment of HOTAIR (Kalwa et al. 2016).
Motivated by this preliminary evidence, we investigate the existence of a set of lncRNAs (which we term super-lncRNAs) that localizes to specific regions via RNA:DNA:DNA triplex formation within super-enhancers. Such lncRNAs can recruit necessary transcription factors and other regulatory complexes to appropriate genomic locations within the super-enhancers and can also contribute to the appropriate topological and spatial organization of chromatin in super-enhancer regions for driving transcriptional activity.
Using a logistic regression model based on the number of RNA:DNA:DNA triplex sites a lncRNA forms within the super-enhancer, we found 442 unique super-lncRNA transcripts in 27 different human cell and tissue types; 70% of these super-lncRNAs were tissue restricted. They primarily harbor a single triplex-forming repeat domain, which forms RNA:DNA:DNA triplex with multiple anchor DNA sites (originating from transposable elements) within the super-enhancers. Super-lncRNAs were also found to group into 17 different clusters based on the tissue or cell lines they target. Super-lncRNAs in a particular cluster harbored common short structural motifs, and their corresponding super-enhancer targets were associated with ontology terms pertaining to the tissue or cell line. Super-lncRNAs may use these motifs to recruit and transport necessary regulators (such as transcription factors and Mediator complexes) to super-enhancers, influence chromatin organization, and act as spatial amplifiers for key tissue-specific genes associated with super-enhancers.
RESULTS
Identification of super-lncRNAs
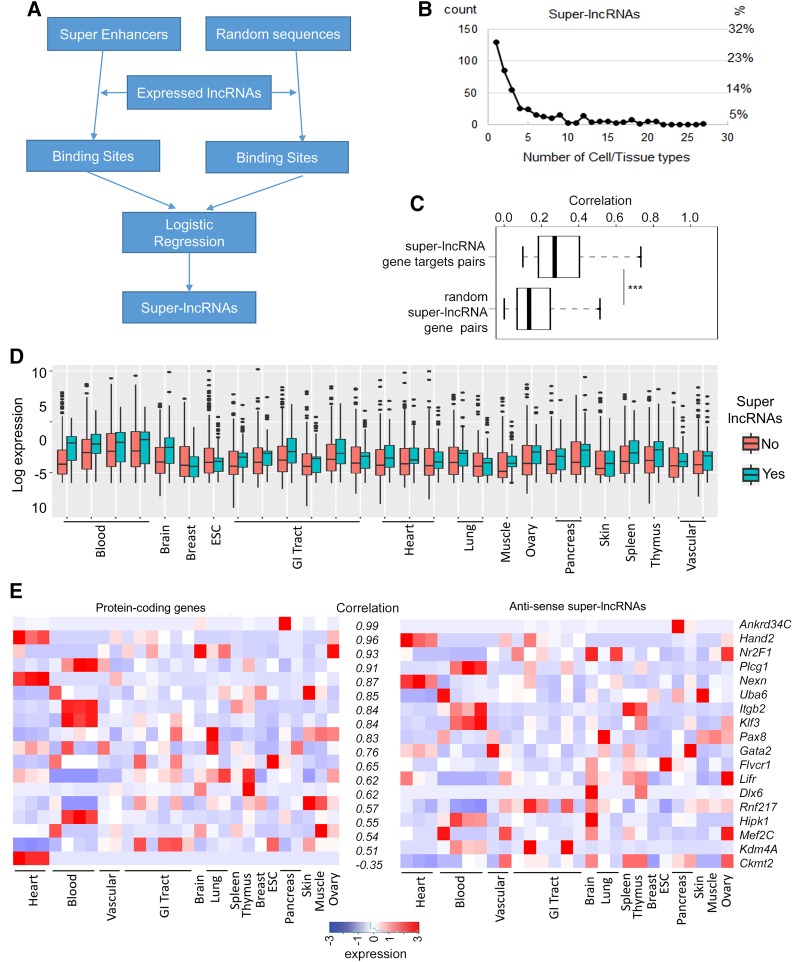
First, we compiled 27 human cell and tissue types (Table 1), which have publicly available data on lncRNA expression profiles from the NIH epigenome roadmap (http://www.roadmapepigenomics.org/mapping) as well as super-enhancer coordinates (http://bioinfo.au.tsinghua.edu.cn/dbsuper/). To identify lncRNAs that target super-enhancers (which we term super-lncRNAs) in each cell or tissue type, we used triplexator (Buske et al. 2012) to identify triplex-forming sites by expressed lncRNAs (fpkm > 0.5) in the super-enhancer (SE) sequences. Only the lncRNAs that are active in the tissue of interest were considered. Our procedure to identify super-lncRNAs is summarized in Figure 1A. An equal number of random sequences with comparable lengths were extracted from the human genome, and triplex-forming sites by lncRNAs on these sequences were also obtained. To obtain statistically meaningful super-lncRNAs, a logistic regression model (Materials and Methods) based on the frequency of binding sites of an lncRNA in the actual SEs and a random set was used to detect lncRNAs, which were a significant source of targets. Using this approach, we identified 442 unique super-lncRNAs transcripts that target super-enhancers in at least one of 27 cell or tissue types (Table 1). Super-lncRNAs in a particular cell line or tissue type passed a P-value <0.05 cutoff and targeted at least 3% of super-enhancers in that particular cell line or tissue. A complete list of super-lncRNAs is provided in Supplemental Table S1.
TABLE 1.
Super-lncRNAs in 27 human cell lines and tissues
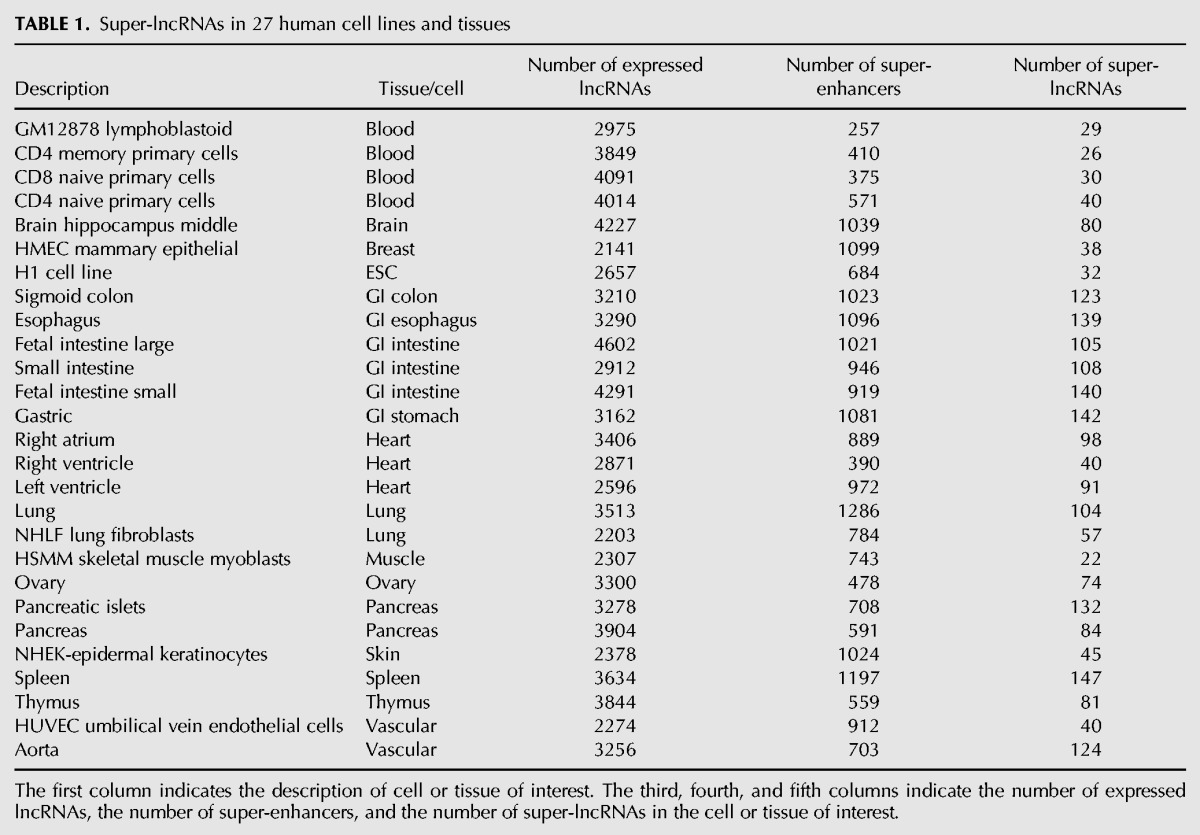
The first column indicates the description of cell or tissue of interest. The third, fourth, and fifth columns indicate the number of expressed lncRNAs, the number of super-enhancers, and the number of super-lncRNAs in the cell or tissue of interest.
FIGURE 1.
Identification of super-lncRNAs. (A) A summary of the steps used to identify super-lncRNAs in a particular cell or tissue type. (B) The fraction of super-lncRNAs in a tissue and the number of super-enhancers in the tissue of interest. The y-axis shows the number of super-lncRNAs as a fraction of the expressed lncRNAs in a tissue of interest; the x-axis represents the total number of cell types or tissues targeted. (C) Correlation between super-lncRNAs and their target genes. The boxplot shows the Pearson correlation coefficient between super-lncRNAs and target genes. A randomized set of pairs of super-lncRNA and protein-coding genes was used for comparison. The statistical significance is indicated as “***” for P-value <0.001. (D) Super-lncRNAs are expressed at higher levels compared to the other lncRNAs. Panel shows boxplots for expressions of super-lncRNAs and other lncRNAs in 27 different cell lines or tissues. (E) Expression profiles of antisense super-lncRNAs and their corresponding protein-coding genes across 27 cell lines and tissues. Heatmaps show the expression profiles of 17 positively correlated pairs and one negatively correlated pair of antisense super-lncRNAs and protein genes. The Pearson correlation coefficient values are also indicated.
Cell lines showed a lower number of super-lncRNAs compared with solid tissues (Table 1). For example, compared with 32 super-lncRNAs in H1 cells, there were 140 and 91 super-lncRNAs in fetal intestine and left ventricle, respectively (Table 1). We found that 30% of the super-lncRNAs were restricted to a single cell or tissue type (Fig. 1B). About 20% and 12% of super-lncRNAs were restricted to only two and three tissues, respectively (Fig. 1B). A very low fraction of super-lncRNAs (∼0.5% to 1.5%) targeted more than 10 tissue- or cell-type super-enhancers (Fig. 1B). We also investigated the correlation between the expression pattern of the super-lncRNA and the genes associated with the targeted super-enhancers. There was a moderate correlation (average Pearson correlation coefficient of 0.3) between super-lncRNA and its predicted protein-coding gene target (Fig. 1C), but it was significantly higher than the average correlation coefficient of 0.18 computed using randomized pairs of lncRNA and protein-coding genes (P-value < 10 × 10−16, Fig. 1C). This indicates some statistical confidence in our strategy in predicting super-lncRNAs. Interestingly, super-lncRNAs are expressed at higher levels compared to the other lncRNAs in majority of the 27 human cell or tissue types considered (Fig. 1D).
Out of the 442 super-lncRNA transcripts, 65 super-lncRNAs were antisense to a known protein-coding gene (Supplemental Table S2). Since these antisense super-lncRNAs are targeting multiple super-enhancers, it suggests that the functions of some antisense lncRNAs can extend beyond the local spatial proximity of their host or neighboring protein-coding gene. To check if the pairs of antisense super-lncRNAs and the protein-coding genes correlate in their expression, we calculated the Pearson correlation coefficient between their expressions across all the 27 human cell or tissue types. We found only one super-lncRNA (Ckmt2-AS1) antisense to Ckmt2 that showed a moderate negative correlation (−0.35) with its protein-coding gene (Fig. 1E). However, there were 17 antisense super-lncRNA protein-coding gene pairs which showed strong positive correlation coefficient of greater than 0.5 (Fig. 1E). For example, the expressions of Hand2 and Hand2-AS1 (are primarily enriched in heart) are highly correlated to each other (Fig. 1E). Pax8, which is known to be involved in different forms of lung cancers (Ozcan et al. 2011), also has a highly correlated antisense super-lncRNA Pax8-AS1 (Fig. 1E; Supplemental Table S2). Other correlated pairs include Mef2c (Muscle), Gata2 (vascular), Klf3 (blood), and Hipk1 (brain and blood) (Fig. 1E).
Binding sites of super-lncRNAs
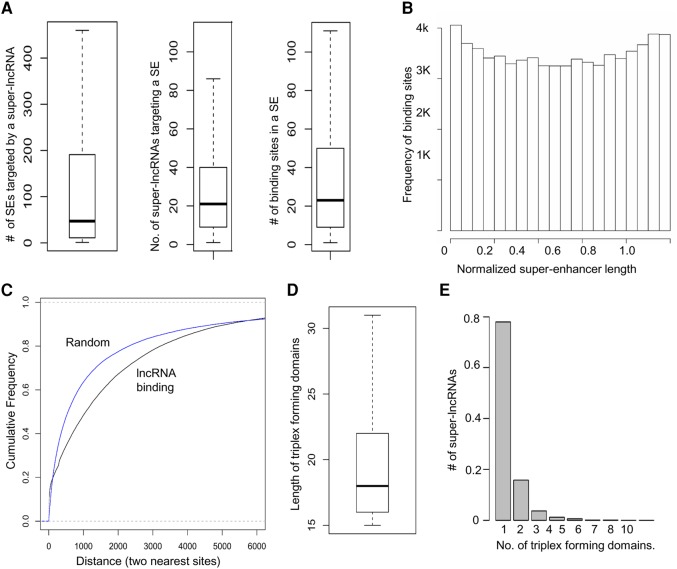
Next, we further explore the nature of binding sites of lncRNAs in the super-enhancer sequences. We found that a single super-lncRNA can target 25 super-enhancers on average (Fig. 2A). However, some super-lncRNAs are capable of targeting hundreds of super-enhancers (Fig. 2A). Similarly, a single super-enhancer can be targeted by multiple lncRNAs at different locations (10–50 sites on average) (Fig. 2A). This shows that multiple lncRNAs can be associated with a single super-enhancer. Since super-enhancers exhibit binding by different factors, lncRNAs that act as scaffolds to these factors may transport them to the super-enhancers. The lncRNA binding sites were uniformly distributed across the entire length of the super-enhancer (Fig. 2B). We also found that the super-lncRNA binding sites showed a lesser clustered pattern compared to random sites within the super-enhancers (Fig. 2C).
FIGURE 2.
Binding patterns of super-lncRNAs. (A) Number of super-enhancers targeted by a single super-lncRNA transcript, number of unique super-lncRNA transcripts targeting one single super-enhancer, and number of unique binding sites by super-lncRNAs in a super-enhancer. (B) The binding sites are uniformly distributed across the super-enhancer sequence. (C) Any two consecutive super-lncRNA binding sites in a super-enhancer are more spatially separated than expected. The x-axis indicates the distance between two nearest super-lncRNA binding sites and the y-axis indicates the cumulative frequency of pairs of binding sites (blue line for random intervals and black line for actual super-lncRNA binding sites). (D) Length of triplex-forming domains in super-lncRNAs. (E) Number of triplex-forming domains in super-lncRNAs.
A few studies suggest that lncRNAs may contain repeat elements that interact with various DNA sites across the genome. To check for similar patterns in super-lncRNAs, we mapped the DNA triplex binding sites back to the corresponding super-lncRNA sequence and merged any overlapping intervals to generate a triplex-forming domain of a super-lncRNA. The average length of such a domain ranged between 15 and 30 bp long (Fig. 2D). Interestingly, the majority (∼80%) of the super-lncRNAs have exactly one triplex-forming domain or locus (Fig. 2E). The existence of one single locus that interacts with multiple DNA sites within the super-enhancers suggests that the domain is nonrandom and is most likely single stranded because there is no complementary subsequence within the lncRNA that it can hybridize to form a duplex. This will allow such domains to form RNA:DNA:DNA triplex with target DNA regions in the super-enhancers.
Transposable elements contribute to the lncRNA binding sites
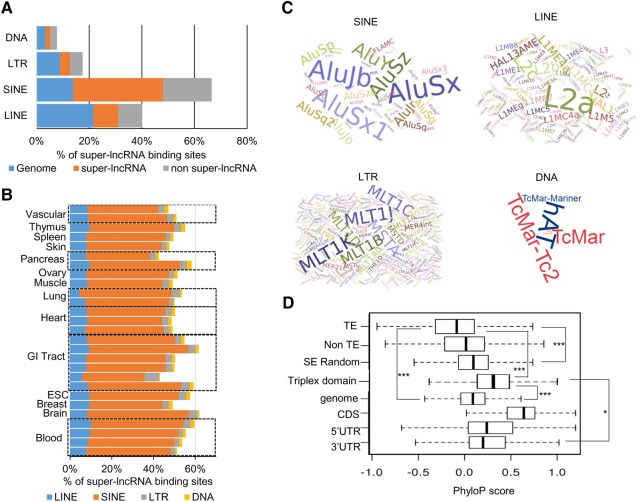
It has been shown that transposable elements (TEs) are major contributors to the origin, diversification, and regulatory roles of lncRNAs. It is possible that the anchor or binding regions in the super-enhancers that interact with the nonrandom triplex-forming locus of super-lncRNAs originate from TEs. This will explain why they are duplicated at different sites within the super-enhancer sequence, allowing interactions with the same lncRNA locus. TEs consist of four major families: short interspersed elements (SINEs), long interspersed elements (LINEs), long terminal repeats (LTRs) elements, and DNA transposons. We found that ∼40% of the super-lncRNA binding sites within the super-enhancers overlap with transposable elements (34% from SINEs, 9% from LINEs, 4% from LTRs, and 2% from DNA transposons) (Fig. 3A), which was only 1% higher than a 48% overlap of comparable random genomic intervals by transposable elements (Fig. 3A). To test if the TEs are preferably distributed at the super-lncRNA binding regions compared to the remaining portion of the super-enhancer, we generated comparable random intervals within the super-enhancers and determined their overlap count with TEs. About 35% of these random intervals overlap with TEs, indicating that the TEs are preferably located at the lncRNA anchor regions within the super-enhancers (Fig. 3A). In all 27 human cell or tissue types, the SINEs were the major contributors to the binding sites of super-lncRNAs (Fig. 3B).
FIGURE 3.
lncRNA binding sites and transposable elements. (A) Fraction of lncRNA binding sites that contain four types of transposable elements: (SINE) short interspersed nuclear elements; (LINE) long interspersed nuclear elements; (LTR) long terminal repeats; (DNA) DNA transposons. “Genome” indicates random intervals in the human genome, “Super-lncRNA” indicates actual lncRNA binding sites within the super-enhancers, and “non-Super-lncRNA” indicates sites within the super-enhancers that are not bound by super-lncRNAs. (B) Fraction of super-lncRNA binding sites that contain four types of transposable elements in 28 different cell or tissue types. (C) Wordle representation of subfamilies of SINEs, LINEs, LTRs, and DNA transposons that contribute to the super-lncRNA binding sites within the super-enhancers. (D) Phylop conservation scores of lncRNA binding sites. The categories are: the binding sites of super-lncRNAs that contain transposable elements (TE), which contains no transposable elements (non-TE); random sites within super-enhancers not bound by super-lncRNAs (SE random); random sites from the genome (Genome); coding exons (CDS); 5′ UTRs, 3′ UTRs of protein-coding regions.
Each of the TE family can be categorized to additional subfamilies. These different families have different functional and evolutionary properties, and it is important to check if they contribute differently to the lncRNA binding regions. We found that within each type of TE, subfamilies also contribute differently. For example, within the SINE family, Alu elements contribute the most; while in the LINE family, the L2a elements contribute the most (Fig. 3C). Studies have shown that large chunks of chromatin regions that exhibit local interactions are marked by small regions enriched in SINEs, suggesting the role of SINEs in shaping the higher-order chromatin structure. Our analysis supports the likelihood that these SINEs simply act as anchor regions for super-lncRNAs to bind to, which may contribute to shaping the local chromatin organization.
We further checked if the binding sites were conserved across species. As expected, the binding sites (the ones which originate from TEs as well as from non-TEs) were significantly less conserved compared to protein-coding genes (P < 0.0001) (Fig. 3D), comparable random intervals chosen from the genome (P < 0.01), and random intervals chosen from the super-enhancers (P < 0.01). However, the triplex-forming domains of super-lncRNAs were significantly more conserved compared to their corresponding binding sites (P < 0.001); even exhibiting moderately more similar conservation levels compared to 5′UTRs and 3′UTRs of protein-coding genes (P < 0.01) (Fig. 3D). These results show that the triplex-forming domains of super-lncRNA sequences are “older” than their corresponding binding regions within the super-enhancers. The appearance of the new binding sites in super-enhancers in the human genome will allow interactions between already existing triplex-forming domains, which will add another layer to the mechanism of gene regulation.
Master transcription factors and super-lncRNAs bind at different sites
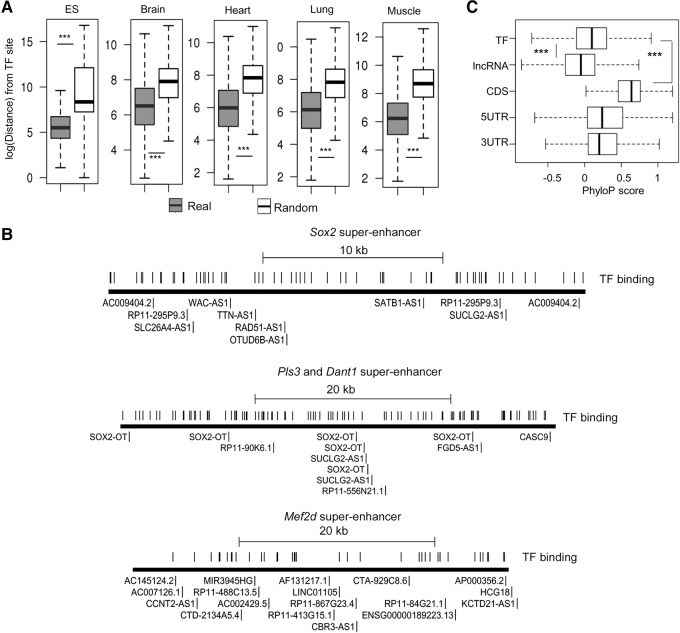
It has been proposed that a protein complex may interact with a repeat element in an lncRNA sequence (such as Firre) (Hacisuleyman et al. 2014); the repeat locus, with the complex bound to it, assists the lncRNA to stably localize at specific DNA regions. Super-enhancers host binding sites for multiple master transcription factors. If super-lncRNAs are transporting these factors to super-enhancers, it is possible that anchor regions for super-lncRNAs coincide with binding sites of master transcription factors. To check this, we looked at five different human cell or tissue types (ESC, brain, heart, lung, and skeletal muscle) and their respective master factors (TFs) as presented in a previous study (Hnisz et al. 2013). Binding sites of the master transcription factors within the respective super-enhancers were determined by using FIMO (P-value < 10−4). In all the five cell or tissue types, the master TF binding sites were preferably located farther from the anchor regions (mean distance of 3 kb) compared to random intervals (mean distance of 400 bp) (P-value < 0.0001) (Fig. 4A). Our analysis indicates that more than 75% of the anchor sites were located at least 500 bp away from the nearest TF binding site. This suggests that the master transcription factors and lncRNAs do not share a common binding locus within the super-enhancers; in fact they tend to locate further away from each other. If the lncRNAs are transporting these master factors to the super-enhancer sites, the TFs should be bound to a different region of the lncRNA than the triplex-forming domain. To illustrate this point we show three super-enhancers associated with Sox2, Pls3/Dant1, and Mef2d genes (Fig. 4B). Super-lncRNA anchor sites are not localized at one part of the super-enhancer and are more sparsely distributed compared to the master transcription factor binding sites, indicating the high likelihood of multiple factors interacting with one single super-lncRNA. Master transcription factor binding sites were significantly less conserved compared to protein-coding genes but were significantly more conserved than the binding sites for the super-lncRNA (Fig. 4C). This means the binding sites “appeared” at a later stage in evolutionary history compared to the TF binding sites within the super-enhancers.
FIGURE 4.
Super-lncRNAs and master transcription factors bind at different locations. (A) Distance between master transcription factor binding sites to their nearest super-lncRNA anchor sites. The y-axis represents the logarithm of the distance between a master transcription factor binding site to its nearest super-lncRNA anchor site. The boxplot marked “real” represents the actual sites, and the one marked as “random” represents the null model. The plots are for five different tissues. Amount of statistical difference is indicated by (***) (P-value < 0.0001). (B) Visual representation of binding sites of super-lncRNAs and master transcription factors in three example super-enhancers associated with Sox2, Pls3/Dant1, and Mef2d. Identification of super-lncRNAs binding to the super-enhancers is also indicated next to the anchor site. (C) PhyloP conservation score at master transcription factor binding site is greater than scores at super-lncRNA binding sites. (TF) Master transcription factor sites; (lncRNA) super-lncRNA binding sites; (CDS) coding regions of protein-coding genes; (5UTR and 3UTR) 5′UTR and 3′UTR regions of protein-coding genes.
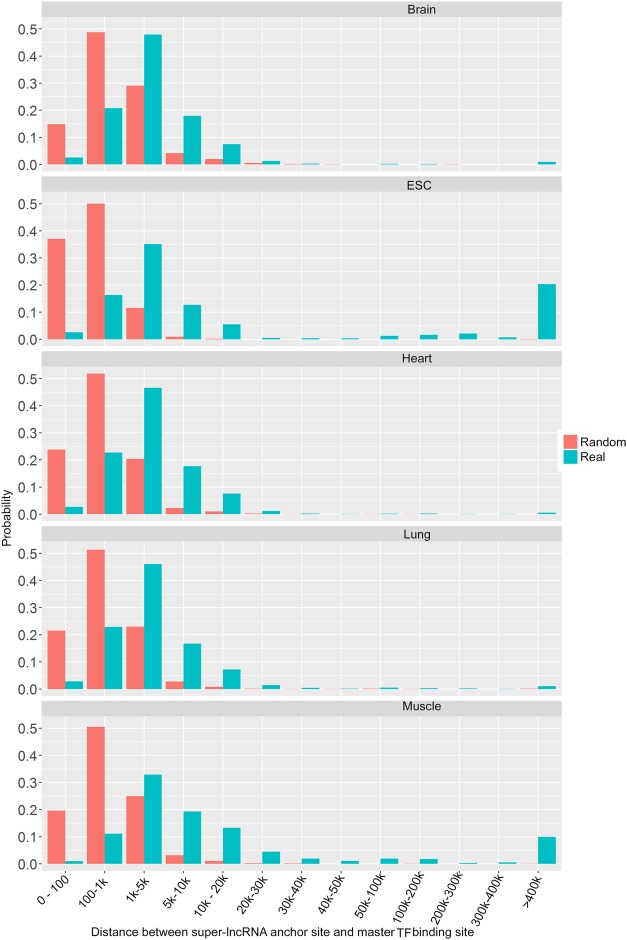
To further decipher the locations of the super-lncRNA anchor sites and binding sites of master TFs, we computed the distances for all pairs of the super-lncRNA anchor site and its nearest master TF binding site. We also created a null model where the intervals representing the actual super-lncRNA anchor sites were randomly positioned within the super-enhancer. In this way, the null model had the same number of sequences as the actual set of super-lncRNA anchor sites, and hence the overall length between the actual super-lncRNA anchor sites and the null model was also the same. We observed some significant differences between the probability distributions of the distances from the null model and from the actual binding sites (Fig. 5). This indicates that the spacing between super-lncRNA anchor sites and master TF sites do not coincide with the null model (Fig. 5). First, the distribution from actual sites is “shifted” to the right compared to the null model, indicating that the super-lncRNA anchor site is less likely to be present at close proximity to a TF binding site compared to the null model (Fig. 5). There is <5% probability of a TF binding site and a super-lncRNA anchor site to be within 100 bases compared to 20% on average in the null model (Fig. 5). The most preferred distance between the super-lncRNA anchor site and the TF binding site is centered on 3000 bases compared to 500 bases in the null model (Fig. 5). There are also instances (more than expected) of large distances (>5000 bases) between the super-lncRNA anchor site and the master TF binding (Fig. 5). Biologically, this may represent very long-range interactions within the super-enhancers via the super-lncRNAs. Such long-range loop interactions would not be possible by using a null model. If the triplex-forming domain of the super-lncRNA is bound by the master transcription factor, we would expect close proximity between the TF binding site and the super-lncRNA anchor site. Since we observe the opposite, the TF is most likely bound to a different domain in the super-lncRNA other than the triplex-forming domain. However, it is important to note that the linear distance may not really indicate the “real spatial distance” because of the complex chromosomal organization within the super-enhancers.
FIGURE 5.
Distance between super-lncRNAs anchor sites and master transcription factors binding sites. The five plots indicate the histograms of the distances between super-lncRNA anchor sites and master transcription factor binding sites in five different cells or tissues (indicated as “Real”). The histogram from the null model is also indicated (marked as “Random”). The x-axis indicates the distance and the y-axis indicates the probability.
Clusters of super-lncRNAs
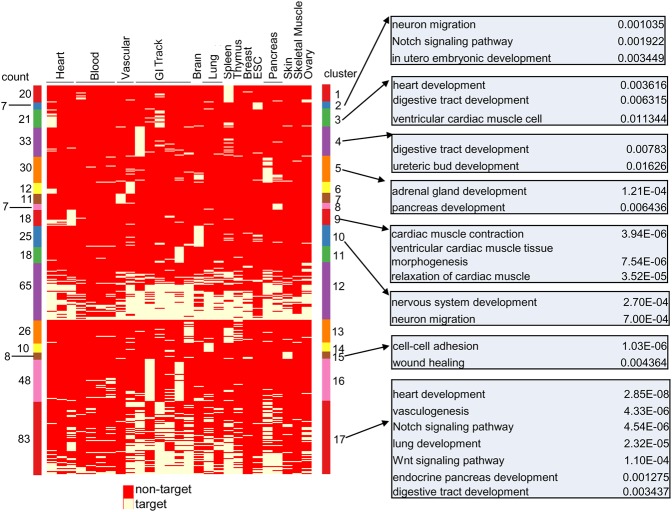
Next, we checked if super-lncRNAs can be clustered based on the cell or tissue types they target. For this, a binary matrix with rows represented by super-lncRNAs and columns represented by cell or tissue types was generated with entries 1 or 0; 1 indicating that super-lncRNA targets a super-enhancer and 0 otherwise. Using K-medoids clustering with Jaccard index as the dissimilarity metric, we obtained 17 optimal numbers of super-lncRNA clusters (Supplemental Table S3). Fifteen out of 17 clusters of super-lncRNAs were primarily restricted to a few tissues (Fig. 6). For instance, cluster 2 (seven super-lncRNAs), cluster 9 (18 super-lncRNAs), and cluster 15 (eight super-lncRNAs) were restricted to the human H1 (ESC) cell line, heart, and skin, respectively (Fig. 6). Interestingly, the two largest clusters of super-lncRNAs (clusters 12 and 17 with 65 and 83 super-lncRNAs, respectively) were ubiquitously enriched in the super-enhancers of almost all the cell or tissue types (Fig. 6). These two groups of super-lncRNAs may perform general functions required in super-enhancers of all cell or tissue types such as recruiting Mediator1 complexes.
FIGURE 6.
Clusters of super-lncRNAs based on targeted tissue and cell lines. Heatmap shows 17 clusters of super-lncRNAs (rows) targeting super-enhancers in 27 cell lines or tissues (columns). Cluster id is shown to the right of the heatmap against each cluster. The number of super-lncRNAs belonging to each cluster is indicated against each cluster to the left of the heatmap. The heatmap displays either “1” (green) or “0” (red), indicating that a particular super-lncRNA targets a super-enhancer or not, respectively. Gene ontology analysis of gene targets associated with super-lncRNAs from different clusters is shown for some clusters along with their P-values of enrichment.
To further explore the genes associated with the super-enhancers targeted by these different clusters of super-lncRNAs, we extracted super-enhancers associated with the 17 super-lncRNA clusters and were annotated with the closest gene as their targets. Gene ontology analysis of the target genes showed correspondence between the ontology terms and the types of the cell or tissue hosting the super-lncRNAs that were enriched in Figure 6. For example, cluster 17 super-lncRNAs, which target almost all the 27 cell or tissue types, targets super-enhancers that are associated with different tissue and pathways pertaining to genes such as heart development, lung development, Wnt and Notch signaling pathways, pancreas, and digestive tract development (Fig. 6), while super-enhancer genes targeted by clusters 9, 10, and 15 super-lncRNAs target super-enhancer genes associated with cardiac, nervous system, and skin related terms, respectively (Fig. 6)
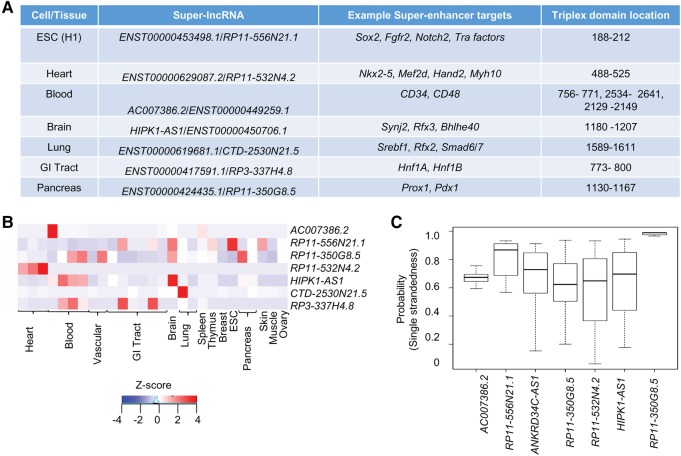
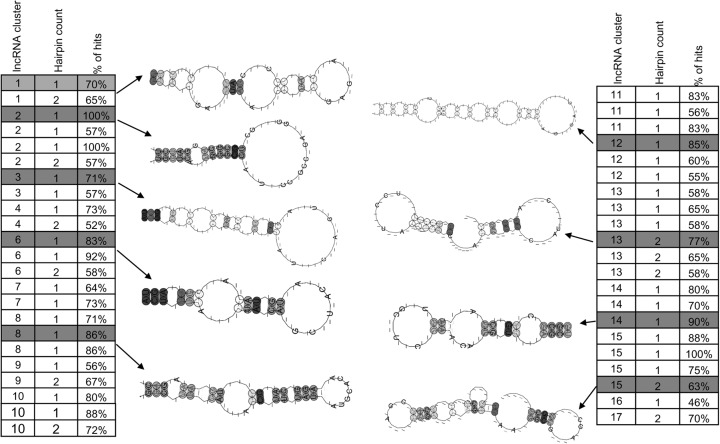
In Figure 7, seven example super-lncRNAs that were restricted to a specific cell or tissue type are shown. The expression profiles of these seven lncRNAs along with their binding loci and example target protein-coding genes are given (Fig. 7A,B). For example, super-lncRNA ENST00000453498.1 or RP11-556N21.1 is highly restricted to human ES (H1) cells (Fig. 7B) and targets 208 human super-enhancers that are associated with pluripotent genes, including Sox2, Notch2, Fgfr2, and Tra factors (Fig. 7B). This super-lncRNA has only one binding locus and is located at 188 to 212 positions along its spliced sequence. LncRNA HIPK1-AS1, which is antisense of protein-coding gene Hipk1, turns out to be brain specific (Fig. 7B) and targets super-enhancers in fetal brain. The targeted super-enhancers by HIPK1-AS1 were also found to be associated with key fetal brain transcription factors such as Rfx, Bhlhe, and Synj2 (Roadmap Epigenomics Consortium et al. 2015). For each of these super-lncRNAs, the probability of single-strandedness of a nucleotide within their respective triplex-forming domain was greater than 0.6 (Fig. 7C). It has been suggested that lncRNAs that contain transposable elements contribute to stable secondary structures of lncRNAs. It is possible that super-lncRNAs targeting super-enhancers in a particular cell or tissue type form share common secondary structural motifs that may interact with a common set of proteins and other factors. To test this, we first compiled lncRNA sequences belonging to each cluster in Figure 6. Then using cmprofile (Nawrocki and Eddy 2013), we searched for secondary structural motifs (of hairpins 1, 2, or 3) in each group separately. To obtain nonredundant and real motifs, we ran cmprofile with “remove redundant motifs” option and only considered motifs that were present in at least 50% of the sequences considered. Interestingly, several secondary structural motifs (either with one or two hairpins) were detected in each group of super-lncRNAS (Fig. 8). We also found that super-lncRNAs in a group shared not just one motif but multiple nonredundant structural motifs. These results suggest that super-lncRNAs may have modular structures where each local module potentially interacts with different protein complexes or other factors.
FIGURE 7.
Example super-lncRNAs. (A) List of example super-lncRNAs restricted to a single tissue or cell line. (B) Expression profiles (shown as z-score) of the example super-lncRNAs across 27 cell lines or tissues. (C) Boxplots of the probabilities of single-strandedness of each nucleotide in the triplex-forming domain of the super-lncRNAs shown in panel A.
FIGURE 8.
Secondary structural motifs enriched in super-lncRNA clusters. The first column indicates the super-lncRNA cluster in Figure 5, the second column indicates the number of hairpins in the structural motif, and the third column indicates the percentage of super-lncRNAs in the cluster that contains the structural motif. Some selected secondary structural motifs are also shown.
DISCUSSION
In this paper, we show that there is a group of lncRNAs, which we term “super-lncRNAs,” that target super-enhancers by forming triplex RNA:DNA:DNA at specific sites. These sites originate from the SINEs family of transposable elements and do not overlap with master transcription factor binding sites. Super-lncRNAs form a small 4% of the total expressed lncRNAs but they can target multiple super-enhancers in a single cell or tissue type. They can be grouped into different clusters based on whether they target or do not target super-enhancers in a particular cell or tissue type. Finally, each group of super-lncRNAs shares multiple common secondary structural motifs. Super-lncRNAs may use these motifs to recruit and transport necessary regulators (such as transcription factors and mediator complexes) to super-enhancers, influence chromatin organization, and act as spatial amplifiers for key tissue-specific genes associated with super-enhancers.
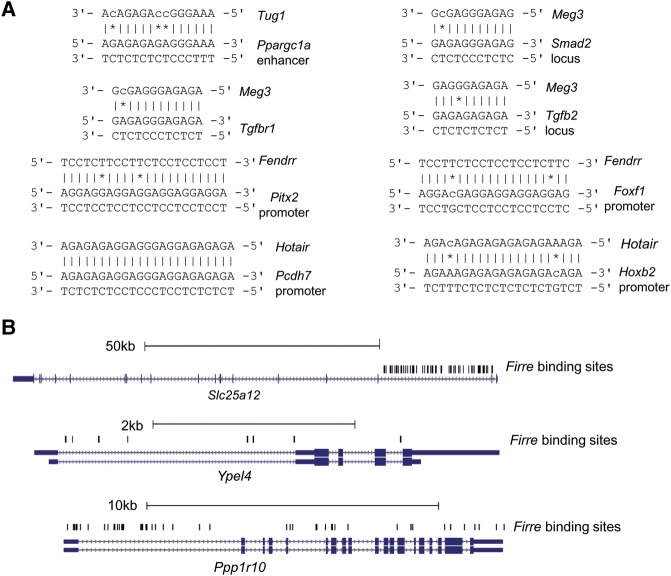
Previous lncRNA studies (lncRNAs such as Fendrr and Tug1) have shown that lncRNAs form an RNA:DNA:DNA triplex near protein-coding genes (Grote et al. 2013; Long et al. 2016) while transporting necessary regulatory complexes at specific locations. For example, Fendrr binds to the PRC2 complex and TrxG/MLL complexes to target promoters of Foxf1 and Pitx2. A genome-wide study on lncRNA HOTAIR found significant similarities between the actual ChIRP-seq peaks and the binding sites predicted by triplexator (Kalwa et al. 2016). Our prediction of super-lncRNAs binding sites is based on these preliminary studies that suggested that lncRNAs may bind to DNA via RNA:DNA:DNA triplex formation. To further cross-validate these claims, we first focused on studies where the interactions between lncRNA and DNA sites were experimentally validated (Hotair, Kalwa et al. 2016; Tug1, Long et al. 2016; Fendrr, Grote et al. 2013; Meg3, Mondal et al. 2015). We performed a prediction of the triplex-forming sites of the specific lncRNAs (Hotair, Fendrr, Meg3, and Tug1) involved in these previous studies following our strategy. Our analysis confirmed all the previously reported lncRNA:DNA interactions (Fig. 9A). We also found a study where the authors showed that the first intron of three genes (Ppp1r10, Ype14, and Slc25a12) colocalized with lncRNA Firre (Hacisuleyman et al. 2014). Following our strategy, we were able to find several binding sites of lncRNA Firre along the locus of these three genes (Fig. 9B). Next, we focused on some studies that performed genome-wide experiments of lncRNA interaction sites with DNA. We gathered the ChIRP-seq data of four long-noncoding RNAs—Hotair (human, 832 sites), Tug1 (mouse, 6878 sites), Rox2 (Drosophila, 307 sites), and Terc (mouse, 2198 sites). These sites can be accessed in the NCBI GEO database using accession numbers GSE31332 and GSE77493. Our strategy was able to predict 96%, 73%, 88%, and 87% of Hotair, Tug1, Rox2, and Terc sites, respectively (Supplemental Table S4). For significant testing, we also created nonbinding regions by generating random genomic regions of the same size as the actual ChIRP-seq sites. The binding sites of the lncRNA of interest were also predicted in these random genomic regions. We found that in all four cases, the binding predictions in the actual ChIRP-seq regions were significantly more compared to the nontarget random genomic regions (Fisher exact test: P-value < 2.2 × 10⁻¹⁶ for Hotair, Tug1, and Terc; P-value = 2.64 × 10⁻⁷ for Rox2). These results show that lncRNAs can interact with DNA sites through triplex formation, and it may be one of the important mechanisms through which lncRNAs exert their function. Because of this evidence, the RNA:DNA:DNA triplex formation rules adopted in our paper for super-lncRNA identification can be a valid mechanism for super-lncRNAs to interact with super-enhancer regions.
FIGURE 9.
Validation of triplex-forming sites of some lncRNAs. (A) LncRNAs and their interaction sites from studies that showed experimental interaction between them were collected. Panel A shows the predicted triplex interaction between those lncRNAs (Tug1, Meg3, Fendrr, and Hotair) and the corresponding DNA sites using our strategy. (B) Predicted binding sites of lncRNA Firre at the locus of Ppp1r10, Ype14, and Slc25a12.
Also, in our paper we used a logistic regression model based on the number of binding sites in a super-enhancer to obtain statistically meaningful super-lncRNAs. This eliminates lncRNAs that may have binding sites within the super-enhancers just by chance. For large-scale predictions and screening, this approach seems to be the appropriate initial step to adopt. Such an approach has also been adopted successfully to analyze ChIP-seq peak sequences for various transcription factors with good accuracy and 40 times faster than other methods (Yao et al. 2014). The P-value obtained from such a linear-regression model compared to a null model can be used as a valid measure of statistical enrichment. Besides statistical enrichment, lncRNAs that interact with at least 3% of the super-enhancer in the tissue of interest were treated as super-lncRNAs. This was to make sure that the super-lncRNAs target at least some fraction of the super-enhancers in the tissue of interest. For RNA:DNA:DNA triplex formation, RNA subsequence has to be single stranded and the DNA site has to be “available” to be bound. Super-enhancers are regions that exhibit H3K27ac chromatin modifications. Our analysis suggests that super-lncRNAs have a specific triplex formation domain (usually one locus), and since the triplex-forming locus has only one copy within the RNA sequence, the probability of base-pairings of bases in the locus of the super-lncRNA is very low. We used a set of example RNAs to illustrate this point.
Studies have shown that transposable elements are embedded at specific sites in super-enhancer regions. These sites, which mainly consist of SINEs, act as boundaries for spatially interacting regions, indicating their contribution to the chromatin organization at the super-enhancer loci. In this paper, we show that 50% of the sites (which mostly correspond to SINEs) within the super-enhancers are transposable elements and act as anchor regions for the embedded transposable elements within the super-lncRNAs. We find that 80% of the super-lncRNAs are tissue restricted, which makes sense because transposable elements have the characteristic to move in genomes in a lineage-specific fashion (Kapusta et al. 2013). In this paper, we explore the regulatory function of super-lncRNAs via the embedded transposable element. However, other potential functions of such element may also exist such as post-transcriptional regulation. For example, Alu elements in lncRNA can form complementary duplexes with 3′ UTR of several protein-coding genes. Because of the prevalence of Alu elements, a single lncRNA can affect several genes through this mechanism.
We also found that the binding sites of super-lncRNAs are mainly transposable elements and are significantly less conserved than the corresponding embedded transposable element within the lncRNA sequence. However, the repeat elements have similar conservation levels compared to random portions within the lncRNA sequences. This suggests that the insertions of TE within the super-enhancers occurred after the TE insertions with the super-lncRNAs. Strictly pertaining to super-lncRNAs, it is difficult to ascertain the evolutionary origins of super-lncRNAs. There could be two different possibilities: (i) Super-lncRNAs originated from previously evolving nontranscribed sequence containing TEs, or (ii) super-lncRNAs in humans evolve rapidly from lncRNAs in lower species via TE insertions. More definitive answers require additional analyses that include super-enhancers from many species across different cell or tissue types.
Transcription factors need to cooperate with each other as well as with other local genomic sites within the super-enhancers; this indicates that super-enhancers might act as one unit rather than a collection of smaller units. Our results that the anchor regions for the super-enhancers are uniformly distributed across the entire length of the super-enhancer show that the entire super-enhancer is involved in chromatin organization. Super-lncRNAs most likely play a role in structuring the spatial proximities between these different regulatory factors required for the transcription of the key protein-coding genes.
In our strategy, the first step was to pick lncRNAs that were expressed in a tissue of interest. This initial pool of lncRNAs is not necessarily tissue specific. This pool of lncRNAs goes through a logistic regression model that takes into account the number of binding sites in super-enhancers compared with the null model. Therefore, it is possible that some super-lncRNAs target multiple tissues. We performed the clustering to look for tissue-specific or ubiquitous targeting by super-lncRNAs. An interesting finding from this was two groups of super-lncRNAs targeting multiple tissues and 15 groups with restricted targeting. Methodologically, gene ontology enrichment is purely based on genes associated with only those super-enhancers targeted by super-lncRNAs. Super-lncRNAs can target multiple DNA sites that contribute to formation of super-enhancers that regulate key tissue-specific genes; therefore, from a biological perspective, the enrichment is a result of super-lncRNAs binding to super-enhancers.
Our analysis shows that super-lncRNAs that target similar super-enhancers share multiple short secondary structural motifs. These motifs are located at different locations that are different from triplex-forming repeat domains. This result resonates with previous findings, indicating the modular nature of lncRNA sequence. As noted before in lncRNAs, the motifs within the same super-lncRNA are independent from each other and may interact with different transcription factors or other regulators. The presence of multiple modules or motifs will allow super-lncRNAs to interact with multiple factors and transport them to the specific sites.
MATERIALS AND METHODS
Identification of lncRNAs that target super-enhancers
In human, we considered 27 cell or tissue types that have expression profiles of lncRNAs from the NIH epigenome roadmap (http://www.roadmapepigenomics.org/mapping) as well as identified super-enhancer coordinates from http://bioinfo.au.tsinghua.edu.cn/dbsuper/. LncRNA fasta sequences were obtained from GenCode (https://www.gencodegenes.org/). The super-enhancer locations and corresponding sequences were obtained from dbSUPER database (http://bioinfo.au.tsinghua.edu.cn/dbsuper/). For each cell or tissue type, we only considered the lncRNA sequences which were expressed with FPKM > 0.5. To check if the expressed lncRNAs bind to a region via RNA:DNA:DNA triplex within the super-enhancers, the expressed lncRNA sequences were aligned to super-enhancer sequences using triplexator (Buske et al. 2012). To test if the predicted target regions of an lncRNA are nonrandom, we generated a random set of sequences that were comparable in length to the super-enhancer sequences. The target regions for the same set of lncRNAs within the random sequences were also obtained using triplexator. Next, the nonrandomness of lncRNA binding to super-enhancers of a particular cell or tissue type was assessed using a log-linear regression model. We assumed that sequences or super-enhancers that have an equal number of target regions by lncRNA are most likely to have the same probability (P) of containing the binding site of that lncRNA. If x represents the number of unique target regions a lncRNA binds to a particular super-enhancer, the logarithm of the odds ratio is modeled as log[P/(1 − P)] = a + bx + cy, where a, b, and c are model parameters. Here, y indicates the percentage of GC content in the sequence. This term corrects the bias in GC content between the actual super-enhancer sequence and the background. The statistical significance was estimated using a Wald test on the Z-statistics (P-value <0.05). Only lncRNAs with P-value <0.05, z-score >0, and that target at least 3% of the super-enhancers in the cell or tissue type of interest were retained and identified as super-lncRNAs.
Binding patterns of super-lncRNAs
To get the distribution of the binding sites of super-lncRNAs across the super-enhancer sequence, each super-enhancer sequence was normalized to a length of one, and the original super-lncRNA binding sites were adjusted accordingly. Then the normalized length of one was divided into 20 bins of equal length. The number of binding sites in each bin was counted and a histogram was generated. To test if the binding sites of super-lncRNAs showed a clustered pattern, for each binding site the distance to the nearest site was calculated and the cumulative distribution was generated. Comparable random sites were also generated in super-enhancers, and cumulative distribution for the nearest distances was computed for these random sites and compared to the one generated from actual lncRNA binding sites using the Kolmogorov–Smirnov test.
Super-lncRNA anchor sites and master TF binding sites
To generate the null model, the intervals representing the actual super-lncRNA binding sites were randomly positioned within the super-enhancer. The null model consisted of these random intervals. Therefore, the null model had the same number of sequences as the actual set of super-lncRNA binding sites and hence the overall length of the actual super-lncRNA binding sites and the null model were also equal.
Clustering and gene ontology
A binary matrix with rows represented by lncRNAs and columns represented by tissue/cell type was generated with entries 1 or 0; 1 indicating that lncRNA targets a super-enhancer and 0 otherwise. K-medoids clustering was performed on this matrix along the rows using the Jaccard index as the dissimilarity metric. The optimal number of clusters was obtained based on the “elbow method” on the intra-cluster sum of errors. The gene targets were obtained by assigning the closest RefSeq gene TSS to the super-enhancer. Gene ontology was performed for target genes representative of each cluster (human genome was used as the background) using the DAVID web server (Huang et al. 2009).
Structural motifs
CMprofile (Nawrocki and Eddy 2013) was used to identify secondary structural motifs in a set of lncRNA sequences. CMprofile was not able to handle extremely long lncRNAs. For such lncRNAs, we extracted ∼200-bp long subsequences that formed locally stable structures. Such subsequences that form locally stable structures were determined using RNALfold (Lorenz et al. 2011). We allowed CMprofile to extract three candidate motifs for a hairpin count of 1, 2, and 3 after removing redundant motifs. We only retained those motifs that were present in 50% of the lncRNA sequences of interest. The consensus secondary structure visualization was using RNAlifold (Lorenz et al. 2011).
Transcription factor binding sites
The list of master regulators was obtained from a previous study (Hnisz et al. 2013) and position weight matrices were obtained from the JASPAR database (Mathelier et al. 2014). The transcription factor binding sites were generated by aligning the position weight matrices of the master TFs using FIMO (Grant et al. 2011) with a P-value threshold of 0.0001.
Conservation transposable element analysis
Whole-genome base-wise conservation PhyloP scores were downloaded from the UCSC Genome Browser. The conservation scores for intervals were extracted using bwtool (Pohl and Beato 2014). TE annotations used in this study are obtained from the outputs of the RepeatMasker (RM) software (http://www.repeatmasker.org/) produced for human, hg19 assembly.
SUPPLEMENTAL MATERIAL
Supplemental material is available for this article.
Supplementary Material
ACKNOWLEDGMENTS
The author acknowledges funding from the US Army Department of Defense (68847MAREP/W911NF1610480) and is grateful to the University of Houston-Downtown for organizing research and creative scholarly activities.
Footnotes
Article is online at http://www.rnajournal.org/cgi/doi/10.1261/rna.061317.117.
REFERENCES
- Buske FA, Bauer DC, Mattick JS, Bailey TL. 2012. Triplexator: detecting nucleic acid triple helices in genomic and transcriptomic data. Genome Res 22: 1372–1381. [DOI] [PMC free article] [PubMed] [Google Scholar]
- Chu C, Qu K, Zhong FL, Artandi SE, Chang HY. 2011. Genomic maps of long noncoding RNA occupancy reveal principles of RNA-chromatin interactions. Mol Cell 44: 667–678. [DOI] [PMC free article] [PubMed] [Google Scholar]
- Engreitz JM, Ollikainen N, Guttman M. 2016. Long non-coding RNAs: spatial amplifiers that control nuclear structure and gene expression. Nat Rev Mol Cell Biol 17: 756–770. [DOI] [PubMed] [Google Scholar]
- Grant CE, Bailey TL, Noble WS. 2011. FIMO: scanning for occurrences of a given motif. Bioinformatics 27: 1017–1018. [DOI] [PMC free article] [PubMed] [Google Scholar]
- Gröschel S, Sanders MA, Hoogenboezem R, De Wit E, Bouwman BAM, Erpelinck C, van der Velden VHJ, Havermans M, Avellino R, van Lom K, et al. 2014. A single oncogenic enhancer rearrangement causes concomitant EVI1 and GATA2 deregulation in Leukemia. Cell 157: 369–381. [DOI] [PubMed] [Google Scholar]
- Grote P, Herrmann BG. 2013. The long non-coding RNA Fendrr links epigenetic control mechanisms to gene regulatory networks in mammalian embryogenesis. RNA Biol 10: 1579–1585. [DOI] [PMC free article] [PubMed] [Google Scholar]
- Grote P, Wittler L, Hendrix D, Koch F, Währisch S, Beisaw A, Macura K, Bläss G, Kellis M, Werber M, et al. 2013. The tissue-specific lncRNA Fendrr is an essential regulator of heart and body wall development in the mouse. Dev Cell 24: 206–214. [DOI] [PMC free article] [PubMed] [Google Scholar]
- Hacisuleyman E, Goff LA, Trapnell C, Williams A, Henao-Mejia J, Sun L, McClanahan P, Hendrickson DG, Sauvageau M, Kelley DR. 2014. Topological organization of multichromosomal regions by the long intergenic noncoding RNA Firre. Nat Struct Mol Biol 21: 198–206. [DOI] [PMC free article] [PubMed] [Google Scholar]
- Hnisz D, Abraham BJ, Lee TI, Lau A, Saint-André V, Sigova AA, Hoke HA, Young RA. 2013. Super-enhancers in the control of cell identity and disease. Cell 155: 934–947. [DOI] [PMC free article] [PubMed] [Google Scholar]
- Huang DW, Sherman BT, Lempicki RA. 2009. Systematic and integrative analysis of large gene lists using DAVID Bioinformatics Resources. Nature Protoc 4: 44–57. [DOI] [PubMed] [Google Scholar]
- Kalwa M, Hänzelmann S, Otto S, Kuo CC, Franzen J, Joussen S, Fernandez-Rebollo E, Rath B, Koch C, Hofmann A, et al. 2016. The lncRNA HOTAIR impacts on mesenchymal stem cells via triple helix formation. Nucleic Acids Res 44: 10631–10643. [DOI] [PMC free article] [PubMed] [Google Scholar]
- Kapusta A, Kronenberg Z, Lynch VJ, Zhuo X, Ramsay LA, Bourque G, Yandell M, Feschotte C. 2013. Transposable elements are major contributors to the origin, diversification, and regulation of vertebrate long noncoding RNAs. PLoS Genet 9: e1003470. [DOI] [PMC free article] [PubMed] [Google Scholar]
- Khan A, Zhang X. 2016. dbSUPER: a database of super-enhancers in mouse and human genome. Nucleic Acids Res 44: D164–D171. [DOI] [PMC free article] [PubMed] [Google Scholar]
- Li Y, Rivera CM, Ishii H, Jin F, Selvaraj S, Lee AY, Dixon JR, Ren B. 2014. CRISPR reveals a distal super-enhancer required for Sox2 expression in mouse embryonic stem cells. PLoS One 9: e114485. [DOI] [PMC free article] [PubMed] [Google Scholar]
- Long J, Badal SS, Ye Z, Wang Y, Ayanga BA, Galvan DL, Green NH, Chang BH, Overbeek PA, Danesh FR. 2016. Long noncoding RNA Tug1 regulates mitochondrial bioenergetics in diabetic nephropathy. J Clin Invest 126: 4205–4218. [DOI] [PMC free article] [PubMed] [Google Scholar]
- Lorenz R, Bernhart SH, Höner zu Siederdissen C, Tafer H, Flamm C, Stadler PF, Hofacker IL. 2011. ViennaRNA Package 2.0. Algorithms Mol Biol 6: 26. [DOI] [PMC free article] [PubMed] [Google Scholar]
- Mathelier A, Zhao X, Zhang AW, Parcy F, Worsley-Hunt R, Arenillas DJ, Buchman S, Chen Cy, Chou A, Ienasescu H, et al. 2014. JASPAR 2014: an extensively expanded and updated open-access database of transcription factor binding profiles. Nucleic Acids Res 42: D142–D147. [DOI] [PMC free article] [PubMed] [Google Scholar]
- Mondal T, Subhash S, Vaid R, Enroth S, Uday S, Reinius B, Mitra S, Mohammed A, James AR, Hoberg E, et al. 2015. MEG3 long noncoding RNA regulates the TGF-β pathway genes through formation of RNA–DNA triplex structures. Nat Commun 6: 7743. [DOI] [PMC free article] [PubMed] [Google Scholar]
- Nawrocki EP, Eddy SR. 2013. Infernal 1.1: 100-fold faster RNA homology searches. Bioinformatics 29: 2933–2935. [DOI] [PMC free article] [PubMed] [Google Scholar]
- Ozcan A, Shen SS, Hamilton C, Anjana K, Coffey D, Krishnan B, Truong LD. 2011. PAX 8 expression in non-neoplastic tissues, primary tumors, and metastatic tumors: a comprehensive immunohistochemical study. Mod Pathol 24: 751–764. [DOI] [PubMed] [Google Scholar]
- Pohl A, Beato M. 2014. bwtool: a tool for bigWig files. Bioinformatics 30: 1618–1619. [DOI] [PMC free article] [PubMed] [Google Scholar]
- Pott S, Lieb JD. 2014. What are super-enhancers? Nat Genet 47: 8–12. [DOI] [PubMed] [Google Scholar]
- Roadmap Epigenomics Consortium, Kundaje A, Meuleman W, Ernst J, Bilenky M, Yen A, Heravi-Moussavi A, Kheradpour P, Zhang Z, Wang J, et al. 2015. Integrative analysis of 111 reference human epigenomes. Nature 518: 317–330. [DOI] [PMC free article] [PubMed] [Google Scholar]
- Siersbæk R, Rabiee A, Nielsen R, Sidoli S, Traynor S, Loft A, La Cour Poulsen L, Rogowska-Wrzesinska A, Jensen ON, Mandrup S. 2014. Transcription factor cooperativity in early adipogenic hotspots and super-enhancers. Cell Rep 7: 1443–1455. [DOI] [PubMed] [Google Scholar]
- Yao Z, Macquarrie KL, Fong AP, Tapscott SJ, Ruzzo WL, Gentleman RC. 2014. Discriminative motif analysis of high-throughput dataset. Bioinformatics 30: 775–783. [DOI] [PMC free article] [PubMed] [Google Scholar]
Associated Data
This section collects any data citations, data availability statements, or supplementary materials included in this article.


