Abstract
Programmed cell death ligand-1 (PD-L1) expression may predict the response to both programmed cell death-1 and PD-L1 inhibitors in lung cancer. However, the extent of intratumoral heterogeneity of PD-L1 expression, which may cause false negative results, is largely unexplored. We aimed to assess the intratumoral heterogeneity of PD-L1 expression in surgically resected lung cancer specimens by applying a novel method of tissue microarray, namely Spiral Arrays, which enables us to observe the heterogeneity in spiral-shaped tissue cores. Adenocarcinoma and squamous cell carcinoma specimens were obtained from consecutive patients with lung cancer who had undergone surgical resection at Nagasaki University Hospital (Nagasaki, Japan) since 2009. Small cell lung cancer and large cell carcinoma specimens were selected from patients in the same archive who had undergone resection since 1998. Spiral Arrays were constructed of spiral-shaped cores, prepared from representative blocks of each case, which were subjected to immunohistochemistry using an anti-PD-L1 antibody. Each core was divided into 8 segments and each segment was classified as either PD-L1-positive or PD-L1-negative using thresholds of 1.0%, 5.0%, 10.0%, and 50.0%, respectively. In total, 138 specimens were selected, including 60 adenocarcinomas, 59 squamous cell carcinomas, 12 small cell lung cancers, and 7 large cell carcinomas. The majority of specimens with PD-L1-positive segments exhibited heterogeneous expression (i.e., had a mixture of PD-L1-positive and PD-L1-negative segments within a core) irrespective of the threshold (1.0%, 66.7%; 5.0%, 74.4%; 10.0%, 75.8%; and 50.0%, 85.7%]. Large variations in the ratios of PD-L1-positive segments were observed. At least 50.0% of the segments within a core were negative in no fewer than 50.0% (range, 50.0–76.0%) of cases with heterogeneous PD-L1 expression. In conclusion, intratumoral heterogeneity of PD-L1 expression was frequently observed in cases of lung cancer. Thus, multiple tumor biopsy specimens may be needed to accurately determine the PD-L1 expression status.
Introduction
Lung cancer is the leading cause of cancer-related mortality. The 5-year relative survival rate is 10.0–15.0% worldwide [1] and is currently 29.7% in Japan [2]. Although, during the last few decades, patients with lung cancer have been treated with a variety of tailored therapeutic strategies (e.g., according to histological type or gene expression profiles) [3, 4], survival still remains poor. Recently, immunotherapy targeting immune checkpoint molecules, especially programmed cell death-1 and programmed cell death ligand-1 (PD-L1), have been approved by the United States Food and Drug Administration for the treatment of patients with advanced non-small cell lung cancer (NSCLC), and are changing the paradigm for therapy in lung cancer [5–7]. At the same time, the assessment of PD-L1 expression using immunohistochemistry (IHC) has become important as a biomarker for predicting response to these therapies [8, 9]. However, previous studies have reported a broad range of PD-L1 expression in NSCLC, ranging from 7.4% to 72.7% of cases [10, 11]. Furthermore, a therapeutic response has been observed not only in patients classified as PD-L1-positive from IHC, but also in some patients classified as PD-L1-negative from IHC, indicating the potential for insufficient sampling to have occurred from the PD-L1-positive region. Some studies have reported the presence of intratumoral heterogeneity of PD-L1 expression in lung cancer. However, the rate and characteristics of the heterogeneity remain largely unexplored [12–15].
In the present study, we aimed to assess the intratumoral heterogeneity of PD-L1 expression in surgically resected lung cancer specimens by employing a unique tissue microarray technique, Spiral Arrays, which enables us to observe the heterogeneity in spiral-shaped tissue cores [16–18].
Materials and methods
Ethical statement
The study protocol was approved by the Ethical Review Board Committee (approval number: 16072526) of Nagasaki University (Nagasaki, Japan) on July 26, 2016. Informed consent was obtained from each patient at the time of surgery.
Tissue specimens
Adenocarcinoma and squamous cell carcinoma specimens were prospectively obtained from consecutive patients with lung cancer who had undergone surgical resection at Nagasaki University Hospital (Nagasaki, Japan) since 2009. Small cell lung cancer and large cell carcinoma specimens were also selected from patients in our institutional archive, but who had undergone surgical resection since 1998, because of the low number of cases due to the infrequency of these histological types. Pathological reports were reviewed and patients with only one of these histological components were included. Hematoxylin and eosin (H&E)-stained slides were also reviewed, and patients with insufficient numbers of malignant cells to construct the Spiral Arrays were excluded. Patients lacking sufficient formalin-fixed, paraffin-embedded tissue were also excluded.
Spiral Array construction
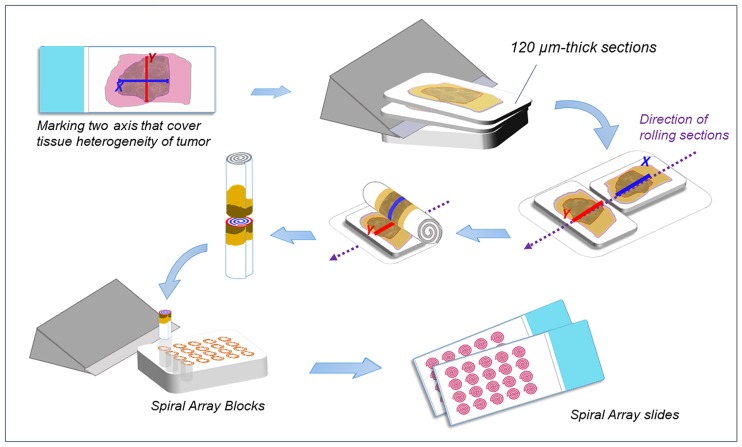
Spiral Arrays were constructed as described previously (Fig 1) [17]. Briefly, single blocks of tissue with the most representative tumor histology and of sufficient quantity was selected from each case. The corresponding H&E-stained slide was digitally scanned using a ScanScope® Aperio CS2 slide scanner (Leica Microsystems, Melbourne, Australia). The scanned whole-slide image of each H&E-stained slide was reviewed to select and mark two continuous straight regions of interest (X and Y axes) prior to constructing the Spiral Arrays. Two 120.0-μm-thick sections were subsequently cut from each block and arranged together on the Spiral Array Constructor (Sakura Finetek Japan Co., Ltd., Tokyo, Japan) as the X or Y axis on each section was aligned in the same direction. The aligned sections were rolled together into a cylindrical form and cut along the line reflecting the X and Y axes. One of the separated reels was embedded vertically into a recipient block to construct the Spiral Arrays. Finally, 4.0-μm-thick sections were prepared from the Spiral Array blocks for further histopathological evaluation using H&E staining and IHC.
Fig 1. Spiral Array construction.
A representative block was selected from each case, and two continuous straight regions of interest (X and Y axes) were selected and marked by reviewing hematoxylin and eosin-stained slides. Two 120.0-μm-thick sections were sliced from each block and aligned with the X and Y axes. The two sections were rolled together into a cylindrical form and cut along the line reflecting the X and Y axes. Spiral Array cores were embedded vertically into a recipient block. Four-μm-thick sections were prepared from the Spiral Array blocks for further histopathological evaluation.
Antibody selection and immunohistochemistry
Well-characterized anti-PD-L1 (clone 28–8; Abcam, Cambridge, MA, USA) and anti-cluster of differentiation 68 (CD68) (clone KP1; DAKO, Glostrup, Denmark) antibodies were selected. IHC was performed using an automated staining system (Leica Bond III; Leica Microsystems). The antibody dilutions were optimized to 1:100 for anti-PD-L1 and 1:400 for anti-CD68. The slides were dewaxed and rehydrated using distilled water, and were subsequently processed for PD-L1 (heat-induced antigen retrieval at pH 9.0) or CD68 (proteolytic treatment). After incubation with the primary antibodies (anti-PD-L1, 30 minutes; anti-CD68, 15 minutes), the tissue sections were rinsed, and the sections for PD-L1 staining were further incubated with EnVision FLEX+ Rabbit LINKER (DAKO) and EnVision+ HRP Labelled Polymer (DAKO). The sections for CD68 staining were incubated with the Bond Polymer Refine Detection Kit (Leica Microsystems). Staining was visualized using diaminobenzidine, and counterstaining was performed using hematoxylin. Formalin-fixed, paraffin-embedded tissue blocks of human placenta and tonsil were prepared as positive controls. The stained slides were scanned as whole-slide images using a ScanScope® Aperio CS2 slide scanner (Leica Microsystems).
PD-L1 immunohistochemistry scoring on the Spiral Array
PD-L1 expression was only evaluated in tumor cells. We attempted to exclude intratumoral immune cells, such as macrophages and lymphocytes. PD-L1 positivity was defined as any tumor cell that expressed PD-L1 on the cell membrane at any intensity. The tumor cells’ PD-L1 positivity was scored using four different positivity thresholds (≥1.0%, ≥5.0%, ≥10.0%, and ≥50.0%) in any tumor that included a minimum of 100 tumor cells.
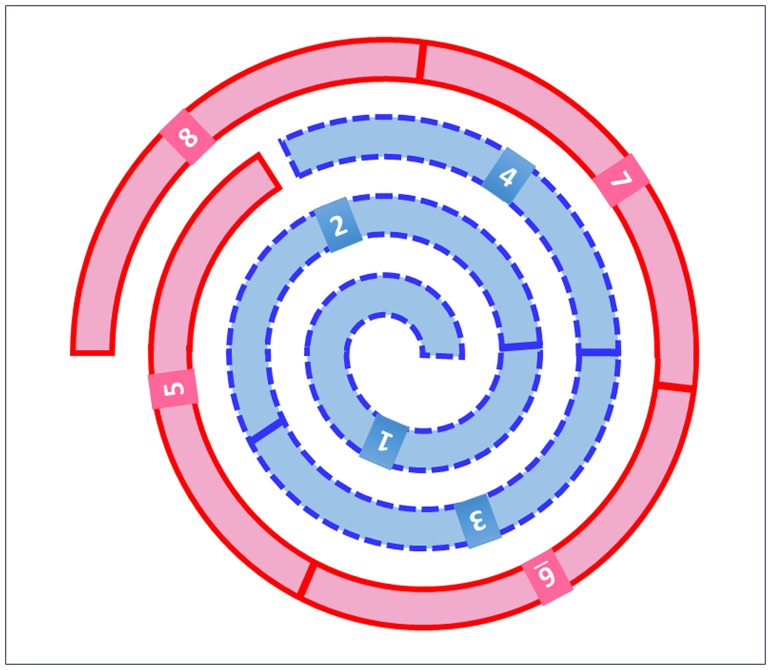
To evaluate tissue heterogeneity, each Spiral Array core was divided into 8 segments as shown in Fig 2, and positive or negative PD-L1 expression was scored for each segment. Scoring was performed by two or three independent observers. Segments with interobserver disagreement were subsequently evaluated at a meeting between the independent observers and a pulmonary expert, and the final classification was selected after a consensus was reached. Cases with both positive and negative segments within the Spiral Array core were defined as having heterogeneous PD-L1 expression, while cases with identical results for all 8 segments (positive/negative) were defined as having homogeneous PD-L1 expression.
Fig 2. Schematic of the 8 segments of a Spiral Array core.
Each core was divided into 8 segments for the scoring of PD-L1 expression.
Comparison between Spiral Arrays and whole tissue sections
Six cases were randomly selected from those with positive PD-L1 staining in the Spiral Array. The staining heterogeneity was compared between the Spiral Array core and the whole tissue section in each case.
Statistical analyses
The patients’ characteristics at diagnosis were presented as the frequency and percentage for categorical data, and as the median and interquartile range for continuous data. Interobserver agreement for PD-L1 IHC scoring was assessed using the kappa statistic for all possible pairs among the three observers. An average kappa statistic was also calculated for each value [19, 20].
Descriptive and comparative analyses were performed using Microsoft Excel 2010 (Microsoft Corporation, Redmond, WA, USA) and JMP software for the patients’ characteristics (version 11; SAS Institute Inc., Cary, NC, USA). The kappa statistics were calculated using Microsoft Excel 2010 (Microsoft Corporation) and Easy R software (Saitama Medical Center, Jichi Medical University, Saitama, Japan) [21], a graphical user interface for R (The R Foundation for Statistical Computing, Vienna, Austria).
Results
Patient characteristics
The patients’ clinicopathological characteristics are shown in Table 1. Among the 138 cases of lung cancer, we identified 60 cases of adenocarcinoma, 59 cases of squamous cell carcinoma, 12 cases of small cell lung cancer, and 7 cases of large cell carcinoma. The majority of patients were male (73.9% vs. 26.1%), and the median age was 70 (range, 41–90) years. The majority of patients were current or former smokers (18.1% and 57.3%, respectively). The median smoking index was 900 (range, 0–3,220). Almost all of the patients had Stage I, II, or IIIA disease (59.4%, 22.5%, and 13.8%, respectively).
Table 1. Patient characteristics.
| Characteristics | Patients (n = 138) |
|---|---|
| Sex, n (%) | |
| Male | 102 (73.9) |
| Female | 36 (26.1) |
| Age (years), median (range) | 70 (41–90) |
| Smoking status, n (%) | |
| Non-smoker | 33 (23.9) |
| Ex-smoker | 79 (57.3) |
| Smoker | 25 (18.1) |
| Unknown | 1 (0.7) |
| Smoking index, median (range) | 900 (0–3,220) |
| Histology, n (%) | |
| Adenocarcinoma | 60 (43.5) |
| Squamous cell carcinoma | 59 (42.7) |
| Small cell lung cancer | 12 (8.7) |
| Large cell carcinoma | 7 (5.1) |
| Stage, n (%) | |
| I | 82 (59.4) |
| II | 31 (22.5) |
| IIIA | 19 (13.8) |
| IIIB | 2 (1.4) |
| IV | 4 (2.9) |
| Tumor size (mm), median (range) | 25.0 (9.0–100.0) |
| Tumor status, n (%) | |
| T1 | 61 (44.2) |
| T2 | 60 (43.5) |
| T3 | 13 (9.4) |
| T4 | 4 (2.9) |
| Node status, n (%) | |
| N0 | 101 (73.2) |
| N1 | 19 (13.8) |
| N2 | 16 (11.6) |
| N3 | 2 (1.4) |
PD-L1 expression and heterogeneity
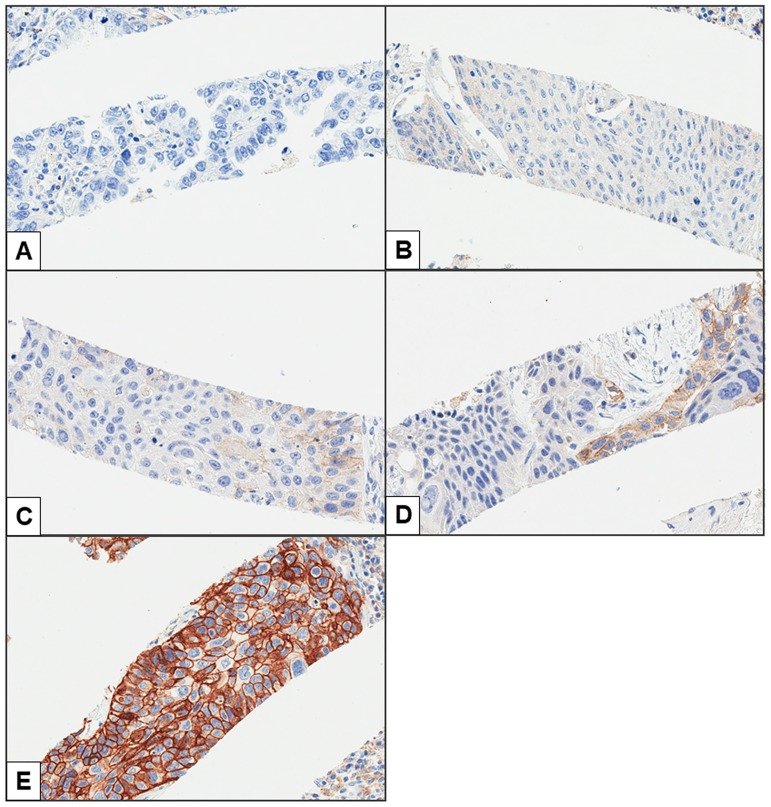
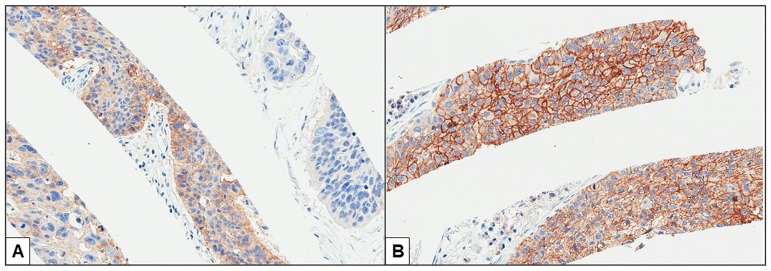
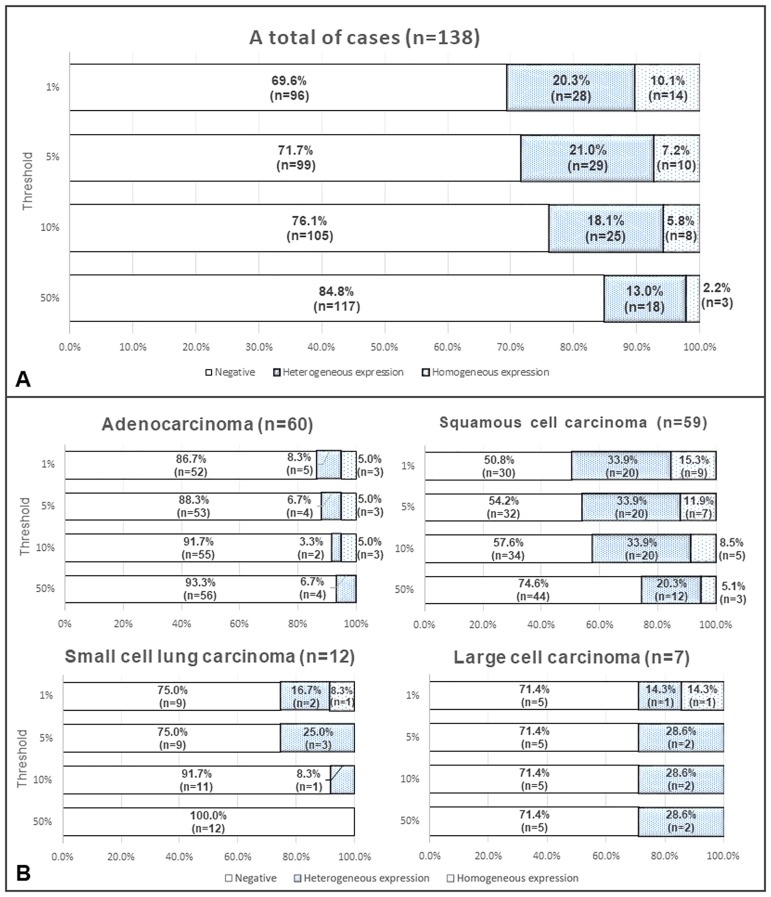
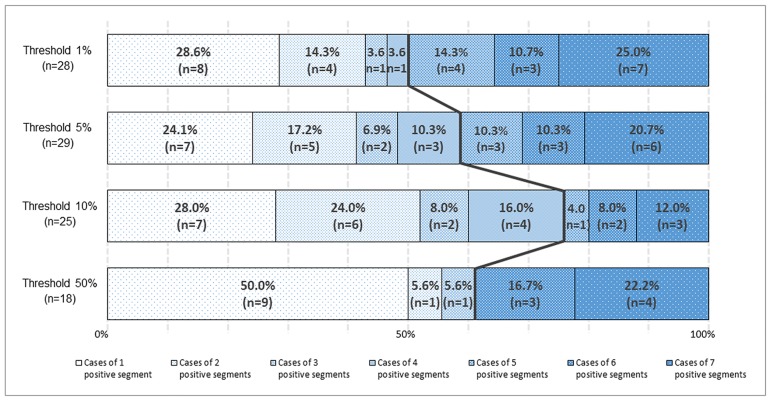
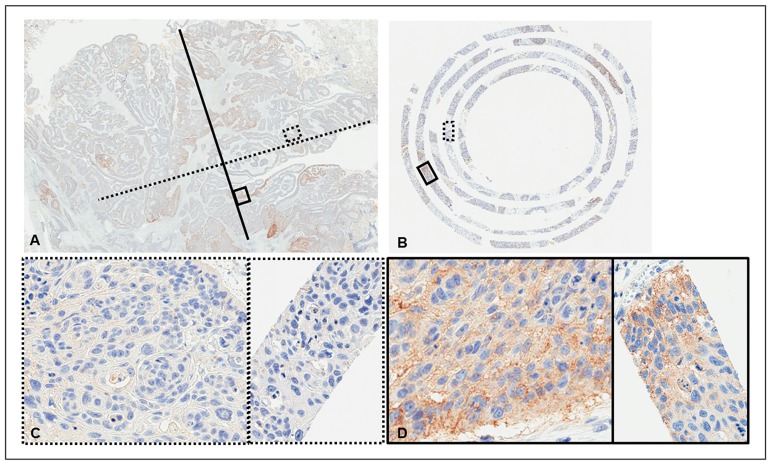
Representative images of PD-L1 expression for each criterion are shown in Fig 3A–3E. Representative cores with and without heterogeneous PD-L1 expression are shown in Fig 4A and 4B. The distributions of cases with negative, heterogeneous, and homogeneous PD-L1 expression are shown in Fig 5A and 5B. The threshold-specific number of cases with ≥1 PD-L1-positive segment was 42 (30.4%), 39 (28.3%), 33 (23.9%), and 21 (15.2%) for the 1.0%, 5.0%, 10.0%, and 50.0% thresholds, respectively. The majority of cases had heterogeneous PD-L1 expression irrespective of the threshold (1.0%: 66.7% [n = 28], 5.0%: 74.4% [n = 29], 10.0%: 75.8% [n = 25], and 50.0%: 85.7% [n = 18]) (Fig 5A). When cases were categorized according to their histological type, PD-L1-positive segments were observed in 6.7–13.3% of adenocarcinomas, 25.4–49.2% of squamous cell carcinomas, ≤25.0% of small cell lung cancers, and 28.6% of large cell carcinomas, depending on the threshold that was used (Fig 5B). At least 50.0% of the 8 segments within the cores were negative for PD-L1 expression in the majority of cases with heterogeneous PD-L1 expression irrespective of the threshold (range, 50.0–76.0%), although the ratio of PD-L1-positive segments varied considerably among the cases (Fig 6). The heterogeneous and homogenous staining patterns of PD-L1 expression were identical between the Spiral Arrays and whole tissue sections in all 6 randomly selected cases (Fig 7A–7D and S1 Fig). The heterogeneous expression pattern of PD-L1 on the Spiral Arrays was comparable to that of the original whole tissue sections (Fig 7A–7D).
Fig 3. Representative images of PD-L1 expression.
(A) <1.0%, (B) 1.0–4.9%, (C) 5.0–9.9%, (D) 10.0–49.9%, and (E) ≥50.0% PD-L1-positive cells (magnification, 200×).
Fig 4. Representative images of the heterogeneous and homogeneous expression of PD-L1.
(A) Heterogeneous and (B) homogeneous expression of PD-L1 (magnification, 150×).
Fig 5. Distributions of cases with negative, heterogeneous, and homogeneous PD-L1 expression.
(A) Distributions of all 138 cases and (B) distributions according to histological type.
Fig 6. Distributions of cases with heterogeneous PD-L1 expression and varying numbers of PD-L1-positive segments.
The left side of the black line indicates the proportions of cases where negative segments account for ≥50.0% of the total number of segments within the cores and the right side of the black line indicates the proportions of cases where positive segments account for >50.0% of the total number of segments within the cores. At any of the thresholds, ≥50.0% of the total number of segments within the cores were negative in no fewer than 50.0% (range, 50.0–76.0%) of cases with heterogeneous PD-L1 expression.
Fig 7. Representative images of PD-L1 expression in a case with heterogeneous PD-L1 expression.
(A) The whole section (magnification, 3×), (B) the corresponding Spiral Array core (magnification, 15×), (C) magnified images from the regions delineated by the dotted lines in A (left) and B (right) (magnification, 200×), and (D) magnified images from the regions delineated by the solid lines in A (left) and B (right) (magnification, 200×). Images of the other 5 cases are shown in S1 Fig.
Interobserver agreement of PD-L1 expression scores
The interobserver agreement for PD-L1 IHC scoring among the three observers is shown in Table 2. In total, 917 segments were scored by the three observers. The number of segments in agreement between the three observers (i.e., positive vs. negative) for each threshold (1.0%, 5.0%, 10.0%, and 50.0%) were 814, 824, 850, and 869, respectively. The average kappa statistics were 0.76, 0.75, 0.78, and 0.79 for the 1.0%, 5.0%, 10.0%, and 50.0% thresholds, respectively.
Table 2. The kappa statistics for the PD-L1 immunohistochemistry scores for segments (n = 917).
| Threshold | |||||
|---|---|---|---|---|---|
| 1% | 5% | 10% | 50% | ||
| Observer1 | Observer2 | 0.72 | 0.70 | 0.76 | 0.80 |
| Observer2 | Observer3 | 0.77 | 0.72 | 0.75 | 0.73 |
| Observer1 | Observer3 | 0.79 | 0.82 | 0.83 | 0.84 |
| Average | 0.76 | 0.75 | 0.78 | 0.79 | |
Discussion
In the present study, using a newly developed tissue microarray method, namely Spiral Arrays, we revealed that intratumoral heterogeneity of PD-L1 expression was common in lung cancer. In past studies, the intratumoral heterogeneity of PD-L1 expression has been reported in solid tumors, including lung cancer, breast cancer, melanoma, and renal cell carcinoma [10, 12–14, 22–29]. However, the majority of studies have evaluated the intratumoral heterogeneity between primary and metastatic sites [14, 26], and only a few studies have evaluated the intratumoral heterogeneity within tumors. McLaughlin et al. [12], for instance, have recently evaluated the intratumoral heterogeneity within surgically resected NSCLC tumor specimens using IHC and quantitative fluorescence, and have reported the presence of intratumoral heterogeneity of PD-L1 expression. Furthermore, an autopsy case report revealed that PD-L1 and associated immunogenetic profiles differed according to metastatic site in the same patient [15].
To our knowledge, this is the first study to evaluate the intratumoral heterogeneity of lung cancer using a segmental approach with several thresholds. We used a Spiral Array technique with 8 segmented cores to evaluate intratumoral heterogeneity. Specimens with both PD-L1-positive and PD-L1-negative segments within the cores were defined as having heterogeneous PD-L1 expression. Our findings suggest that PD-L1 frequently exhibits heterogeneity in its expression (Fig 5A). Interestingly, ≥50.0% of the 8 segments within the cores were negative for PD-L1 expression in no fewer than 50.0% of the cases with heterogeneous PD-L1 expression (range, 50.0–76.0%). Thus, cases with heterogeneous PD-L1 expression are more likely to return a false negative result during an assessment that uses small biopsy specimens. Recently, Ilie et al. [14] and Kitazono et al. [26] compared PD-L1 expression in surgically resected specimens and matched small biopsies from patients with NSCLC. A large difference in the discordant rate (48.0% vs. 7.6%) was observed between the two reports. Our findings were comparable to those of Ilie et al. [14], suggesting that the apparent PD-L1 status in diagnostic biopsies may not reflect that in resected specimens in many cases. Lung cancer is often only clinically detected in its advanced stages, and a small biopsy is a common primary method for diagnosis and molecular testing. PD-L1 expression is also usually assessed in the clinic using small biopsy specimens [30, 31]. Thus, a higher number of biopsy specimens should be obtained from a single site. However, few studies have evaluated the association between the number of biopsy specimens and biomarker sensitivity.
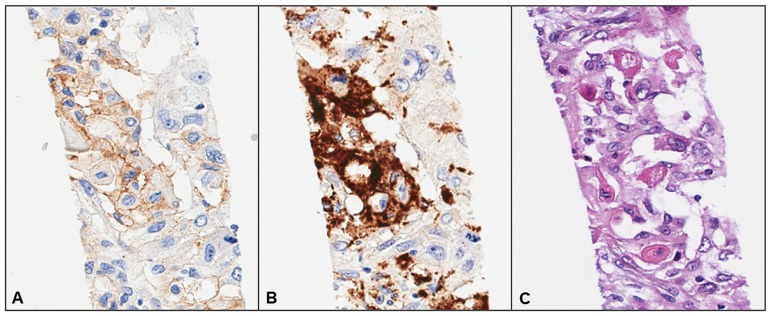
Interobserver agreement regarding PD-L1 expression scores slightly varies according to the thresholds. However, all the thresholds produced good [32]. Disagreement among the three observers may be related to the inadvertent inclusion of immune cells that stain positive for PD-L1 (e.g., dendritic cells or macrophages that infiltrate the tumor nests). Although CD68 IHC was performed to eliminate macrophages, in some instances, it was difficult to differentiate between tumor cells and macrophages (Fig 8A–8C). Thus, we propose that a minimum of two pathologists perform the PD-L1 scoring for each case, and also that CD68 IHC should be used for the assessment of PD-L1 expression in the clinic.
Fig 8. Representative images of a region containing macrophages that resemble tumor cells.
Immunohistochemical analysis of (A) PD-L1 and (B) CD68 expression, and (C) hematoxylin and eosin staining (magnification, 200×).
This study has several limitations. First, we retrospectively evaluated surgically resected specimens, and PD-L1 expression is usually assessed in the clinic using small biopsy specimens. Second, we used only one antibody (clone 28–8) against PD-L1 to limit the confusion caused by differences in antigen recognition between different clones. Clone 28–8 has been characterized by several investigators and is used in clinical trials of lung cancer [28, 33–37]. Finally, data were obtained using only the Spiral Array technique, since concordance between the findings from Spiral Arrays and whole tissue sections has been established in a previous study [17].
Conclusions
Intratumoral heterogeneity of PD-L1 expression was frequently observed in cases of lung cancer. Thus, our findings suggest that a relatively large number of tumor biopsy specimens may be needed to accurately determine PD-L1 expression status.
Supporting information
Identical staining patterns were observed in all 6 cases.
(PDF)
Data Availability
All relevant data are within the paper and its Supporting Information files.
Funding Statement
JF received support in the form of salary from Pathology Institute Corp. The funder did not have any additional role in the study design, data collection and analysis, decision to publish, or preparation of the manuscript. The specific roles of these authors are articulated in the ‘author contributions’ section.
References
- 1.Stewart BW, Wild C. International Agency for Research on Cancer, World Health Organization. World cancer report 2014. xiv, 630 pages p.
- 2.CANCER STATISTICS IN JAPAN '15. Foundation for Promotion of Cancer Research. 2016. http://ganjoho.jp/en/professional/statistics/brochure/2015_en.html.
- 3.Inoue A, Kobayashi K, Usui K, Maemondo M, Okinaga S, Mikami I, et al. First-line gefitinib for patients with advanced non-small-cell lung cancer harboring epidermal growth factor receptor mutations without indication for chemotherapy. J Clin Oncol. 2009;27: 1394–1400. doi: 10.1200/JCO.2008.18.7658 [DOI] [PubMed] [Google Scholar]
- 4.Katayama R, Lovly CM, Shaw AT. Therapeutic targeting of anaplastic lymphoma kinase in lung cancer: a paradigm for precision cancer medicine. Clin Cancer Res. 2015;21: 2227–2235. doi: 10.1158/1078-0432.CCR-14-2791 [DOI] [PMC free article] [PubMed] [Google Scholar]
- 5.Hamanishi J, Mandai M, Matsumura N, Abiko K, Baba T, Konishi I. PD-1/PD-L1 blockade in cancer treatment: perspectives and issues. Int J Clin Oncol. 2016;21: 462–473. doi: 10.1007/s10147-016-0959-z [DOI] [PMC free article] [PubMed] [Google Scholar]
- 6.Soria JC, Marabelle A, Brahmer JR, Gettinger S. Immune checkpoint modulation for non-small cell lung cancer. Clin Cancer Res. 2015;21: 2256–2262. doi: 10.1158/1078-0432.CCR-14-2959 [DOI] [PubMed] [Google Scholar]
- 7.Villaruz LC, Socinski MA. The clinical utility of PD-L1 testing in selecting non-small cell lung cancer patients for PD1/PD-L1-directed therapy. Clin Pharmacol Ther. 2016;100: 212–214. doi: 10.1002/cpt.385 [DOI] [PMC free article] [PubMed] [Google Scholar]
- 8.Patel SP, Kurzrock R. PD-L1 Expression as a Predictive Biomarker in Cancer Immunotherapy. Mol Cancer Ther. 2015;14: 847–856. doi: 10.1158/1535-7163.MCT-14-0983 [DOI] [PubMed] [Google Scholar]
- 9.Hirsch FR, McElhinny A, Stanforth D, Ranger-Moore J, Jansson M, Kulangara K, et al. PD-L1 Immunohistochemistry Assays for Lung Cancer: Results from Phase 1 of the Blueprint PD-L1 IHC Assay Comparison Project. J Thorac Oncol. 2017;12: 208–222. doi: 10.1016/j.jtho.2016.11.2228 [DOI] [PubMed] [Google Scholar]
- 10.Mino-Kenudson M. Programmed cell death ligand-1 (PD-L1) expression by immunohistochemistry: could it be predictive and/or prognostic in non-small cell lung cancer? Cancer Biol Med. 2016;13: 157–170. doi: 10.20892/j.issn.2095-3941.2016.0009 [DOI] [PMC free article] [PubMed] [Google Scholar]
- 11.Yu H, Boyle TA, Zhou C, Rimm DL, Hirsch FR. PD-L1 Expression in Lung Cancer. J Thorac Oncol. 2016;11: 964–975. doi: 10.1016/j.jtho.2016.04.014 [DOI] [PMC free article] [PubMed] [Google Scholar]
- 12.McLaughlin J, Han G, Schalper KA, Carvajal-Hausdorf D, Pelekanou V, Rehman J, et al. Quantitative Assessment of the Heterogeneity of PD-L1 Expression in Non-Small-Cell Lung Cancer. JAMA Oncol. 2016;2: 46–54. doi: 10.1001/jamaoncol.2015.3638 [DOI] [PMC free article] [PubMed] [Google Scholar]
- 13.Velcheti V, Schalper KA, Carvajal DE, Anagnostou VK, Syrigos KN, Sznol M, et al. Programmed death ligand-1 expression in non-small cell lung cancer. Lab Invest. 2014;94: 107–116. doi: 10.1038/labinvest.2013.130 [DOI] [PMC free article] [PubMed] [Google Scholar]
- 14.Ilie M, Long-Mira E, Bence C, Butori C, Lassalle S, Bouhlel L, et al. Comparative study of the PD-L1 status between surgically resected specimens and matched biopsies of NSCLC patients reveal major discordances: a potential issue for anti-PD-L1 therapeutic strategies. Ann Oncol. 2016;27: 147–153. doi: 10.1093/annonc/mdv489 [DOI] [PubMed] [Google Scholar]
- 15.Suda K, Murakami I, Yu H, Kim J, Ellison K, Rivard CJ, et al. Heterogeneity in Immune Marker Expression after Acquisition of Resistance to EGFR Kinase Inhibitors: Analysis of a Case with Small Cell Lung Cancer Transformation. J Thorac Oncol. 2017;12: 1015–1020. doi: 10.1016/j.jtho.2017.02.002 [DOI] [PubMed] [Google Scholar]
- 16.Fukuoka J, Hofer MD, Hori T, Tanaka T, Ishizawa S, Nomoto K, et al. Spiral array: a new high-throughput technology covers tissue heterogeneity. Arch Pathol Lab Med. 2012;136: 1377–1384. doi: 10.5858/arpa.2011-0393-OA [DOI] [PubMed] [Google Scholar]
- 17.Tabata K, Tanaka T, Hayashi T, Hori T, Nunomura S, Yonezawa S, et al. Ki-67 is a strong prognostic marker of non-small cell lung cancer when tissue heterogeneity is considered. BMC Clin Pathol. 2014;14: 23 doi: 10.1186/1472-6890-14-23 [DOI] [PMC free article] [PubMed] [Google Scholar]
- 18.Komiya A, Kato T, Hori T, Fukuoka J, Yasuda K, Fuse H. Application of a new technique, spiral tissue microarrays constructed using needle biopsy specimens, to prostate cancer research. Int J Oncol. 2014;44: 195–202. doi: 10.3892/ijo.2013.2173 [DOI] [PubMed] [Google Scholar]
- 19.Kundel HL, Polansky M. Measurement of observer agreement. Radiology. 2003;228: 303–308. doi: 10.1148/radiol.2282011860 [DOI] [PubMed] [Google Scholar]
- 20.Taplin SH, Rutter CM, Elmore JG, Seger D, White D, Brenner RJ. Accuracy of screening mammography using single versus independent double interpretation. AJR Am J Roentgenol. 2000;174: 1257–1262. doi: 10.2214/ajr.174.5.1741257 [DOI] [PubMed] [Google Scholar]
- 21.Kanda Y. Investigation of the freely available easy-to-use software 'EZR' for medical statistics. Bone Marrow Transplant. 2013;48: 452–458. doi: 10.1038/bmt.2012.244 [DOI] [PMC free article] [PubMed] [Google Scholar]
- 22.Callea M, Albiges L, Gupta M, Cheng SC, Genega EM, Fay AP, et al. Differential Expression of PD-L1 between Primary and Metastatic Sites in Clear-Cell Renal Cell Carcinoma. Cancer Immunol Res. 2015;3: 1158–1164. doi: 10.1158/2326-6066.CIR-15-0043 [DOI] [PMC free article] [PubMed] [Google Scholar]
- 23.Dill EA, Gru AA, Atkins KA, Friedman LA, Moore ME, Bullock TN, et al. PD-L1 Expression and Intratumoral Heterogeneity Across Breast Cancer Subtypes and Stages: An Assessment of 245 Primary and 40 Metastatic Tumors. Am J Surg Pathol. 2017;41: 334–342. doi: 10.1097/PAS.0000000000000780 [DOI] [PubMed] [Google Scholar]
- 24.Madore J, Vilain RE, Menzies AM, Kakavand H, Wilmott JS, Hyman J, et al. PD-L1 expression in melanoma shows marked heterogeneity within and between patients: implications for anti-PD-1/PD-L1 clinical trials. Pigment Cell Melanoma Res. 2015;28: 245–253. doi: 10.1111/pcmr.12340 [DOI] [PubMed] [Google Scholar]
- 25.Camp RL, Chung GG, Rimm DL. Automated subcellular localization and quantification of protein expression in tissue microarrays. Nat Med. 2002;8: 1323–1327. doi: 10.1038/nm791 [DOI] [PubMed] [Google Scholar]
- 26.Kitazono S, Fujiwara Y, Tsuta K, Utsumi H, Kanda S, Horinouchi H, et al. Reliability of Small Biopsy Samples Compared With Resected Specimens for the Determination of Programmed Death-Ligand 1 Expression in Non—Small-Cell Lung Cancer. Clin Lung Cancer. 2015;16: 385–390. doi: 10.1016/j.cllc.2015.03.008 [DOI] [PubMed] [Google Scholar]
- 27.Mansfield AS, Dong H. Implications of Programmed Cell Death 1 Ligand 1 Heterogeneity in the Selection of Patients With Non-Small Cell Lung Cancer to Receive Immunotherapy. Clin Pharmacol Ther. 2016;100: 220–222. doi: 10.1002/cpt.360 [DOI] [PubMed] [Google Scholar]
- 28.Phillips T, Simmons P, Inzunza HD, Cogswell J, Novotny J Jr, Taylor C, et al. Development of an automated PD-L1 immunohistochemistry (IHC) assay for non-small cell lung cancer. Appl Immunohistochem Mol Morphol. 2015;23: 541–549. [DOI] [PMC free article] [PubMed] [Google Scholar]
- 29.Kim MY, Koh J, Kim S, Go H, Jeon YK, Chung DH. Clinicopathological analysis of PD-L1 and PD-L2 expression in pulmonary squamous cell carcinoma: Comparison with tumor-infiltrating T cells and the status of oncogenic drivers. Lung Cancer. 2015;88: 24–33. doi: 10.1016/j.lungcan.2015.01.016 [DOI] [PubMed] [Google Scholar]
- 30.Travis WD, Brambilla E, Riely GJ. New pathologic classification of lung cancer: relevance for clinical practice and clinical trials. J Clin Oncol. 2013;31: 992–1001. doi: 10.1200/JCO.2012.46.9270 [DOI] [PubMed] [Google Scholar]
- 31.Rivera MP, Mehta AC, Wahidi MM. Establishing the diagnosis of lung cancer: Diagnosis and management of lung cancer, 3rd ed: American College of Chest Physicians evidence-based clinical practice guidelines. Chest. 2013;143: e142S–e165S. doi: 10.1378/chest.12-2353 [DOI] [PubMed] [Google Scholar]
- 32.Altman DG. Statistics in medical journals: developments in the 1980s. Stat Med. 1991;10: 1897–1913. [DOI] [PubMed] [Google Scholar]
- 33.Takada K, Toyokawa G, Okamoto T, Akamine T, Takamori S, Katsura M, et al. An Immunohistochemical Analysis of PD-L1 Protein Expression in Surgically Resected Small Cell Lung Cancer Using Different Antibodies and Criteria. Anticancer Res. 2016;36: 3409–3412 [PubMed] [Google Scholar]
- 34.Antonia SJ, López-Martin JA, Bendell J, Ott PA, Taylor M, Eder JP, et al. Nivolumab alone and nivolumab plus ipilimumab in recurrent small-cell lung cancer (CheckMate 032): a multicentre, open-label, phase 1/2 trial. Lancet Oncol. 2016;17: 883–895. doi: 10.1016/S1470-2045(16)30098-5 [DOI] [PubMed] [Google Scholar]
- 35.Borghaei H, Paz-Ares L, Horn L, Spigel DR, Steins M, Ready NE, et al. Nivolumab versus Docetaxel in Advanced Nonsquamous Non-Small-Cell Lung Cancer. N Engl J Med. 2015;373: 1627–1639. doi: 10.1056/NEJMoa1507643 [DOI] [PMC free article] [PubMed] [Google Scholar]
- 36.Brahmer J, Reckamp KL, Baas P, Crinò L, Eberhardt WE, Poddubskaya E, et al. Nivolumab versus Docetaxel in Advanced Squamous-Cell Non-Small-Cell Lung Cancer. N Engl J Med. 2015;373: 123–135. doi: 10.1056/NEJMoa1504627 [DOI] [PMC free article] [PubMed] [Google Scholar]
- 37.Rizvi NA, Mazières J, Planchard D, Stinchcombe TE, Dy GK, Antonia SJ, et al. Activity and safety of nivolumab, an anti-PD-1 immune checkpoint inhibitor, for patients with advanced, refractory squamous non-small-cell lung cancer (CheckMate 063): a phase 2, single-arm trial. Lancet Oncol. 2015;16: 257–265. doi: 10.1016/S1470-2045(15)70054-9 [DOI] [PMC free article] [PubMed] [Google Scholar]
Associated Data
This section collects any data citations, data availability statements, or supplementary materials included in this article.
Supplementary Materials
Identical staining patterns were observed in all 6 cases.
(PDF)
Data Availability Statement
All relevant data are within the paper and its Supporting Information files.


