

Abstract
High fetal hemoglobin (HbF, α2γ2) levels ameliorate the clinical manifestations of sickle cell disease and β thalassemia. The mechanisms that repress HbF expression and silence γ-globin genes in adults are incompletely characterized and only a single HbF inducer, hydroxyurea, is approved for treatment, and only in patients with sickle cell disease. We identified SIRT1, a protein deacetylase, as a new inducer of γ-globin. SIRT1 knockdown decreased, while SIRT1 ectopic expression upregulated γ-globin gene (HBG) expression in primary human erythroid cells and in K562 cells. The small molecule SIRT1 activators SRT2104 and SRT1720 enhanced HBG expression in cord blood human erythroblasts and reactivated silenced HBG in adult human erythroblasts. Furthermore, SIRT1 binds in the β-globin gene cluster locus control region (LCR) and HBG promoters, promotes the looping of the LCR to HBG promoter, and increases the binding of RNA polymerase II and H4K16Ac in the HBG promoter. SIRT1 suppressed the expression of the HBG suppressors BCL11A, KLF1, HDAC1 and HDAC2. Lastly, SIRT1 did not change the proliferation of human erythroid progenitor cells or the expression of differentiation marker CD235a. These data suggest that SIRT1 activates HBG expression through facilitating LCR looping to the HBG promoter, inhibiting the expression of transcriptional suppressors of HBG, and indirectly increasing histone acetylation in the HBG promoter. SIRT1 is a potential therapeutic target for γ-globin gene induction, and small molecule SIRT1 activators might serve as a lead compound for the development of new HbF inducers.
1 INTRODUCTION
Sickle cell anemia and β thalassemia, the β hemoglobinopathies, are caused by mutations that affect, respectively, the structure and expression of the adult hemoglobin β-globin chain (HbA; α2β2).1 Fetal hemoglobin (HbF; α2β2) is the major modulator of the phenotype of both diseases.2 In adults, HbF is replaced by HbA and HbF is normally constitutes less than 1% of total hemoglobin due to the silencing of the γ-globin genes (HBG).3 Reactivation of HBG expression in adults is a prime strategy for both cell-based and pharmacologic treatment of the β hemoglobinopathies.4,5 Hydroxyurea, a HbF inducer, was the first approved drug for treating sickle cell disease, but the HbF response to this treatment is variable and suboptimal, and additional agents would be useful.6–8
The β-like globin gene locus control region (LCR) composed of multiple DNase I hypersensitive sites (HS), is the upstream superenhancer of the β-globin gene cluster and has a pivotal role in regulating the expression of the downstream ε-(HBE), Gγ-(HBG2), Aγ-(HBG1), δ-(HBD), and β-globin (HBB) genes.9 The LCR physically interacts with the promoters of its target genes to form chromatin loops and regulate gene expression.10,11 Transcription factors recruit corepressors and co-activators to form multiprotein transcription complexes to bind the LCR or target gene promoters and silence or activate HBG transcription.12–14 Overall, HBG transcriptional regulation is a collaborative action of cis-acting elements with transcription factors along with co-activators and co-repressors.14–18 However, the complex mechanism of HBG expression and silencing is not totally understood.
SIRT1 encodes a nicotinamide adenosine dinucleotide (NAD)-dependent deacetylase that removes acetyl groups from many nonhistone and histone proteins,19 and therefore is involved in a broad range of physiological functions, including control of gene expression, cell growth, DNA repair, oxidative stress, metabolism and aging.20,21 SIRT1 plays a critical role in transcriptional regulation through several different mechanisms.22 It interacts with and deacetylates a broad range of transcription factors and co-regulators to control transcription complex formation, thereby regulating gene transcription both positively and negatively.21,23–25 SIRT1 can directly deacetylate histones and promote alterations in the methylation of histones and DNA, leading to the repression of gene transcription.22 In addition, SIRT1 is involved in the regulation of higher-order chromatin structure.26
Many efforts have been made to develop new γ-globin inducers.5 HDAC1 and HDAC2, the class I histone deacetylases suppress HBG transcription, and histone deacetylase inhibitors induce HBG expression.15,27 We therefore wanted to study whether SIRT1, a NAD-dependent class III histone deacetylase, also played a role in suppressing HBG expression. Unexpectedly, we found that SIRT1 induced HBG expression. Ectopic expression of SIRT1 increased, while SIRT1 knockdown decreased HBG expression. Small molecule SIRT1 activators increased HBG mRNA levels, the percentage of F-cells, and γ-globin protein levels in erythroid progenitor cells from both cord and adult blood. SIRT1 bound to the LCR and HBG promoter, and facilitated LCR looping to HBG promoter. It also increased the binding of RNA polymerase II (Pol II) and acetylated H4K16Ac in the HBG promoter. SIRT1 selectively suppressed expression of the HBG suppressors BCL11A, KLF1, HDAC1 and HDAC2. Our data suggest that SIRT1 regulated γ-globin production through a transcriptional reprogramming mechanism. SIRT1 and its activators are potential targets and reagents for γ-globin induction for treating β-hemoglobinopathies.
2 MATERIALS AND METHODS
2.1 Cell lines, plasmids, and antibodies
K562 cells were purchased from ATCC (American Type Culture Collection, Manassas, VA) and cultured in RPMI Medium 1640 (Life Technologies, Grand Island, NY) with 10% FBS (Life Technologies, Grand Island, NY).
The human SIRT1 knockdown vector pSUPER.retro.puro-shSIRT1 was acquired and generated as previously described.28 The human SIRT1 expression vector pBABE.puro-SIRT1 was generated by subcloning SIRT1 cDNA from pcDNA3.1-SIRT128 into a pBABE retroviral vector through BamHI and BstxI restriction sites. Antibodies to SIRT1 and γ-globin were purchased from Santa Cruz Biotechnology (Dallas, Texas). Antibody to β-actin was purchased from Sigma-Aldrich (Sigma A, St. Louis, MO).
2.2 Erythroid progenitor cultures and treatment with SIRT1 activators
De-identified peripheral blood samples from adults and cord blood were purchased from Research Blood Components, LLC (Boston, MA 02135) and New York Blood Center, Inc. (New York, NY 10065). Erythroid progenitors were cultured in a two-phase system, as previously described.29–31 Briefly, mononuclear cells from adult peripheral blood (PBMC) or cold blood were isolated on Ficoll-Paque (GE Healthcare, Piscataway, NJ), and cultured in a two-phase culture system.29 The first phase media utilized HyClone™ IMDM (Thermo Scientific, Waltham, MA) containing 30% charcoal treated fetal bovine serum (Life Technology, New York, NY) and rHuIL-3 (25 ng/mL), rHuSCF (50 ng/mL), and rHuEPO at (0.1 u/mL) (GenScript, Piscataway, NJ) for the first 7 days, followed by replacement second phase differentiation media, with 30% charcoal treated fetal bovine serum, rHuEPO at 3 U/mL, and rHuIL-3 (0.1 ng/mL). Test compounds SRT2104 (APExBIO, Houston, TX) and SRT1720 (EMD Millipore, Billerica, MA) were added 4 days after initiation of the Phase 2 erythroid differentiation cultures. Erythroid progenitors were confirmed by Giemsa stain.29 Cells were enumerated by hemocytometry and harvested on day 12 of phase 2 for mRNA and ChIP analysis, and on day 14 for F-cell analysis by flow cytometry and for γ-globin analysis by immunoblotting.
2.3 Knockdown of SIRT1 in erythroid progenitor cells
2.3.1 Knockdown of SIRT1 in erythroid progenitor cells
The Phoenix packaging cell line was transfected with shRNA expression plasmids pSUPER.retro.puro-SIRT1 (5′-GATGAAGTTGACCTCCTCA-3′), or pSUPER.retro.puro scrambled shRNA control separately, using Lipofectamine 2000 (Invitrogen). After 48 hours, the medium containing retrovirus was collected, filtered, treated with polybrene, and transferred to erythroid progenitor cells at day 1 of phase 2 cultures. On day 3, the cells were selected with puromycin (Sigma). The SIRT1 shRNA or scrambled shRNA expressing cells were harvested at day 12 for mRNA analysis and at day 14 for protein analysis.
2.3.2 Stable knockdown of SIRT1 in K562 cells
The SIRT1 shRNA or scrambled shRNA retrovirus described above was transferred to K562 cell cultures. Infected cells were selected with puromycin for 2 weeks, and the stably infected colonies were pooled for further analysis.
2.4 Ectopic expression of SIRT1 in erythroid progenitor cells
Erythroid progenitors from cord blood were used in this study. At day 1 of phase 2 culture, the cells were infected with retroviruses that contained either pBABE-SIRT1 or empty pBABE-vector control. At day 3, the cells were cultured in the presence of puromycin. The cells were collected at day 12 of phase 2 for mRNA analysis and at day 14 for γ-globin protein analysis by immunoblotting.
2.5 RNA preparation, cDNA synthesis, and RT-PCR
Total RNA was extracted from the 4 × 10⁵ cells using MagMaxTM-96 total RNA isolation kit (Ambion, Life Technologies) following directions of the manufacturer. First-strand cDNA was synthesized using HighCapacity RNA to cDNA kit (ThermoFisher Scientific). The qRT-PCR analysis of gene expression was performed using TaqMAN advanced PCR Master MIX (Applied Biosystems, Branchburg, New Jersey), and the ABI 7500 Real-Time PCR system (Applied Biosystems, Foster City, CA) was used by the AACt method. The abundance of HBG, HBB, SIRT1, BCL11A, KLF1, HDAC1, HDAC2 mRNA was determined with TaqMan® Gene Expression primers from Life Technology (Grand Island, NY).
2.6 F-cell analysis by flow cytometry
Cultured erythroid progenitor cells on day 14 of phase 2 were analyzed for the fraction of cell expressing HbF by immunofluorescent staining and flow cytometry. The cells were fixed with 3% formaldehyde (Sigma) in PBS/0.1% BSA for 20 minutes at room temperature. The cells were then permeabilized with 0.5% Saponin (Sigma) in PBS/0.1% BSA for 10 minutes. Following a wash, the cells were stained for 30 minutes with a PE-conjugated mouse anti-human HbF antibody or PE mouse Isotype Control (BD Biosciences, San Jose, CA). The samples were analyzed using a Flow Cytometer (FACScan, BD Biosciences, San Jose, CA) and CellQuest software (BD Biosciences, San Jose, CA). The fraction of F-cells was determined by setting gates based on unstained isotype and compared between untreated control cells and cells treated with the test compounds from the same subjects.
The cells were also stained with FITC mouse anti-human CD235a (glycophorin A) and FITC mouse Isotype Control (BD Biosciences, San Jose, CA) to determine the maturation of erythroid progenitor cells.
2.7 Immunoblotting
Cells were lysed in Laemmli sample buffer and subjected to SDS-PAGE, as previously described.29 Proteins were transferred to a nitrocellulose membrane and probed with antibodies to human γ-globin, SIRT1, p53 and Ac-p53 (Santa Cruz Biotechnology, Dallas, Texas) and β-actin (Sigma A, St. Louis, MO). Proteins were visualized with the GE Imaging System (Image Quant, LSD4010; GE Healthcare, Piscataway, NJ) and quantified with ImageJ software (NIH, Bethesda, MD).
2.8 Chromatin immunoprecipitation assays
Chromatin immunoprecipitation (ChIP) assays were performed as described previously, using 2 × 10⁶ cells for each assay.32 K562 cells with or without stable SIRT1 knockdown were sonicated and incubated with antibodies to SIRT1 or Pol II, H3K9Ac, H4K16Ac (EMD Millipore, Billerica, MA) or IgG antibody control for overnight at 4°C. Immunocomplexes were precipitated using protein A Sepharose beads (Sigma A, St. Louis, MO) for 4 hours at 4°C. The precipitated DNA was reverse cross-linked and quantified by real-time quantitative PCR assay with primer pairs for the human HBG promoter sequence (Forward: AACGGTCCCTGGCT-AAACTC; Reverse: GCTGAAGGGTGCTTCCTTTT), LCR (Forward: TCTCCCACTCAGC-AGCTATGA; reverse: TGC TGGGCCTTGGAGTGA), as well as a primer pair for an intergenic region between the HBE and HBG genes used as a negative control (forward: TCCCACTCT-GTGGGTTGTCTGTTT; reverse: CCCTTCTACACATTGGCTTAGGAAAGG). The abundance of DNA precipitated with anti-SIRT1, or Pol II, H3K9Ac, H4K16Ac antibody was normalized to that precipitated with IgG antibody control and input DNA.
2.9 Chromatin conformation capture analysis
Chromatin conformation capture (3C) analysis was performed as previously described using EcoRI cleavage.33,34 Briefly, stable SIRT1 knockdown and shRNA control K562 cells (2 × 10⁶) were cross-linked with 1% formaldehyde (Sigma) at room temperature for 10 min, followed by glycine quenching, cell lysis and nucleus isolation. The cross-linked DNA was digested by EcoRI (New England Biolabs, Ipswich, MA), intramolecularly ligated with T4 ligases (New England Biolabs) and then reverse cross-linked. Relative crosslinking between the anchor fragment LCR and HBG or HBD promoter were analyzed by SYBR Green real-time qPCR. Interaction between fragments within the α-tubulin gene was used as the internal normalization control for 3C signals. To eliminate variability between samples, interaction frequencies between the anchor fragment and the fragment encompassing the HBG gene from the scrambled shRNA control sample of each experiment were set to one. The primers were determined from the published sequences.33,35
2.10 Statistical analyses
Statistical analyses were performed using paired Student’s t-tests. P values < 0.05 were considered significant.
3 RESULTS
3.1 SIRT1 knockdown decreased while SIRT1 ectopic expression increased HBG expression
To investigate the possible role of SIRT1 in γ-globin gene expression, we examined the effect of SIRT1 knockdown and ectopic expression on HBG expression and γ-globin level in erythroid progenitor cells from cord blood.
We infected the cells with a retrovirus expressing either SIRT1 shRNA or the scrambled shRNA as a control. Infection of SIRT1 shRNA efficiently knocked-down SIRT1 mRNA and protein levels when compared with a scrambled shRNA control (Figure 1A,C). In cord blood CD34+ cells, SIRT1 knockdown decreased HBG mRNA 8-fold (Figure 1B) and γ-globin protein level 5-fold (Figure 1C) compared with scrambled shRNA control. Stable SIRT1 knockdown in K562 cells (Figure 1D), decreased HBG mRNA levels by 11-fold (Figure 1E).
FIGURE 1.
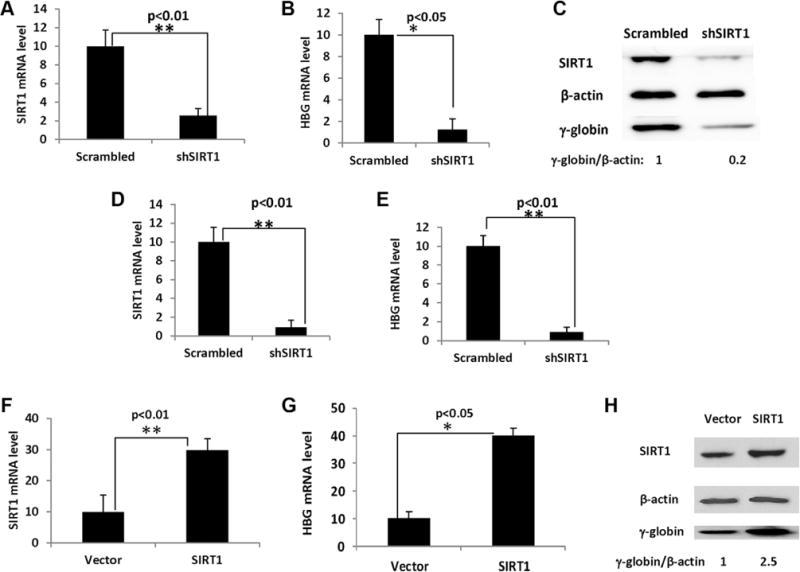
SIRT1 knockdown decreased while SIRT1 ectopic expression increased HBG expression. Erythroid progenitor cells from cord blood expressing either SIRT1 shRNA or scrambled shRNA were collected on day 12 of culture phase 2 for mRNA analysis and collected on day 14 for g-globin protein analysis (A-C). (A) SIRT1 mRNA level in erythroid cells expressing SIRT1 shRNA or scrambled shRNA. SIRT1 mRNA is normalized to 18S. **P < .01. Error bars indicate SD. N = 4. (B) SIRT1 knockdown in erythroid cells reduces HBG mRNA. HBG mRNA is normalized to HBG + HBB. **P < .01. Error bars indicate SD. N = 4. (C) Effects of SIRT1 knockdown on g-globin protein levels in erythroid cells. The ratio of γ-globin: β-actin protein is shown below the panel. (D) SIRT1 mRNA level in K562 cells expressing SIRT1 shRNA or scrambled shRNA. SIRT1 mRNA is normalized to 18S. **P < .01. Error bars indicate SD. N = 3. (E) SIRT1 knockdown in K562 cells reduces HBG mRNA. HBG mRNA is normalized to 18S. **P < .01. Error bars indicate SD. N = 3. Erythroid progenitors cells from cord blood infected with retrovirus containing either pBABE-SIRT1 or empty pBABE-vector control were collected on day 12 of phase 2 for mRNA analysis and collected on day 14 for γ-globin protein analysis (F-H). (F) SIRT1 mRNA level in erythroid cells expressing pBABE-SIRT1 or empty pBABE vector. SIRT1 mRNA is normalized to 18S. **P<.01. Error bars indicate SD. N = 4. (G) SIRT1 ectopic expression in erythroid cells increases HBG mRNA. The HBG mRNA is normalized to HBG + HBB. **P < .05. Error bars indicate SD. N = 4. (H) Effects of SIRT1 ectopic expression on γ-globin protein levels. The ratio of g-globin: β-actin protein is shown below the panel
Ectopic expression of a retrovirus expressing SIRT1 in cord blood CD34+ cells produced elevated SIRT1 expression at both the mRNA and protein level compared with empty vector controls (Figure 1F,H): SIRT1 mRNA levels were elevated 2.9-fold (Figure 1F), HBG mRNA levels increased 4-fold (Figure 1G). The γ-globin protein level increased 2.5-fold from SIRT1 ectopic expression (Figure 1H). Together, these results suggest that SIRT1 is an activator of HBG expression and γ-globin production.
3.2 SIRT1 activators induced HBG expression in cord blood erythroid progenitor cells
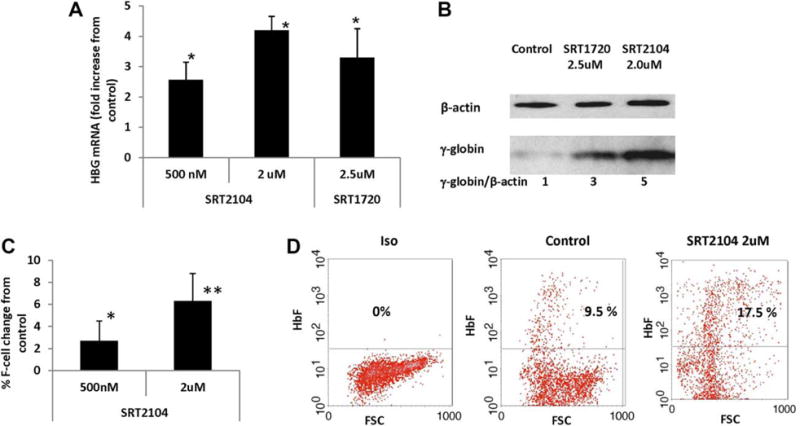
To determine whether small molecule SIRT1 activators might be useful as reagents for treating β-hemoglobinopathies, SIRT1 activators SRT2104 and SRT172036 were incubated with erythroid progenitor cells from cord blood. SRT2104 induced HBG transcription in a dose dependent manner (Figure 2A): Incubation at 100 nM, 500 nM, and 2 uM concentrations induced a mean increase of 2.4-fold, 3.4-fold, and 8.1-fold in HBG mRNA, respectively, compared with vehicle treated controls (P< .01). Treatment with hydroxyurea at 50 uM increased HBG mRNA 1.9-fold (P< .05) (Figure 2A). SRT1720 at 500 nM and 5 uM concentrations induced a mean increase of 2.1-fold and 4.4-fold in HBG mRNA levels above the controls, respectively (P< .05) (Figure 2B). Immunoblotting showed significant increases in γ-globin levels in cultures treated with SRT2104 and SRT1720 (Figure 2C).
FIGURE 2.

Small molecule SIRT1 activators induced HBG expression in erythroid progenitors from cord blood. Erythroid progenitors from cold blood were cultured in a two-phase system. On day 4 of erythroid differentiation phase (phase 2), the cells were treated with SRT2104 or SRT1720 at indicated concentration or vehicle control. The cells were collected on day 12 of phase 2 for mRNA analysis and on day 14 for F-cell and g-gloin protein analysis. (A) SIRT1 activator SRT2104 induces HBG mRNA. HBG mRNA is normalized to 18S. Error bars indicate SD. N = 4. (B) SIRT1 activator SRT1720 induces HBG mRNA. HBG mRNA is normalized to 18S. Error bars indicate SD. N = 4. (C) Effects of SIRT1 activators SRT2104 and SRT1720 on γ-globin protein levels. The ratio of γ-globin: β-actin protein is shown below the panel. (D) Mean change of F-cell in erythroid progenitor cells treated with SRT2104, compared with control cells from the same subject. Error bars indicate SD. N = 4. (E) Representative of Flow Cytometry profile showing SRT2104 increases F-cell proportions. (F) SIRT1 activators regulate SIRT1 deacetylase activity. The cells treated with SRT2104 at 2 uM or SRT1720 at 5 uM or vehicle control were collected on day 12 of phase 2, the cell lysates prepared and immunoblotted with anti-Ac-p53, p53 or β-actin antibodies [Color figure can be viewed at wileyonlinelibrary.com]
Using immunofluorescence staining and flow cytometry, we further determined the effect of SIRT1 activation on the change of number of HbF expressing cells (F-cells) in proportion to the erythroid progenitor cell population. All SRT2104-treated cultures contained a higher percentage of F-cells (Figure 2D,E). SRT2104 treatment at 100 nM, 500 nM, and 2 uM induced a mean absolute F-cell increase of 7.1%, 9.6% and 11.6% respectively (P < .01); hydroxyurea at 50 uM induced a 4.7% increase compared with controls from the same subject (P < .05) (Figure 2D,E).
Small molecule SIRT1 activators increased SIRT1 deacetylase activity rather than change SIRT1 mRNA or protein levels.36 We therefore further examined whether SRT2104 or SRT1720 regulated HBG expression through targeting SIRT1 deacetylase activity. It is well established that lysine 382 in p53 is a cellular substrate of SIRT1.37 We therefore assessed the levels of lysine 382-acetylated p53 in erythroid progenitor cells exposed to SRT2104 and SRT1720 in comparison with the vehicle control. Treatment with SRT2104 and SRT1720 decreased the acetylation levels of p53, a known biological substrate of SIRT1 (Figure 2F). This finding demonstrates on-target SIRT1 activation activity of SRT2104 and SRT1720, and SIRT1 activation increased HBG expression, γ-globin and F-cell production.
3.3 SIRT1 activators reactivated silenced HBG expression in adult peripheral blood erythroid progenitor cells
To determine the effect of SIRT1 activators on the reactivation of silenced HBG expression in adult erythroid progenitors, we isolated these cells from normal adult peripheral blood mononuclear cells and cultured them in a 2-phase culture system. Treatment with SRT2104 at 500 nM and 2 uM induced a mean increase of 2.6-fold and 4.1-fold HBG mRNA above controls (Figure 3A) (P< .05). SRT1720 at 2.5 uM induced a mean increase of 3.3-fold HBG mRNA above controls (Figure 3A). Western blot analysis showed that γ-globin was increased 3-fold and 5-fold from exposure to SRT1720 at 2.5 uM and SRT2104 at 2 uM, respectively (Figure 3B). SRT2104 treatment at 500 nM and 2 uM induced a mean absolute increase of 2.7% (P < .05) and 6.5% in F-cells (P< .01), compared with controls from the same subjects (Figure 3C,D). This suggested that small molecule SIRT1 activators can reactivate silenced HBG expression, γ-globin and F-cell production.
FIGURE 3.
Small molecule SIRT1 activators reactivated silenced HBG expression in adult erythroid progenitors. Erythroid progenitors from adult PBMC were cultured in a 2-phase culture system. On day 4 of erythroid differentiation phase (phase 2), the cells were treated with SRT 2104 or SRT1720 at indicated concentration or vehicle control. The cells were collected on day 12 of phase 2 for mRNA analysis and on day 14 for F-cell and γ-globin analysis. (A) SIRT1 activator SRT2104 and SRT1720 induced HBG mRNA in adult erythroid cells. HBG mRNA is normalized to HBG+HBB. *P < .05. Error bars indicate SD. N = 4. (B) Effects of SIRT1 activators SRT2104 and SRT1720 on γ-globin protein levels in adult erythroid cells. The ratio of γ-globin: β-actin protein is shown below the panel. (C) Mean change in proportions of cells expressing HbF in adult erythroid cells treated with SRT2104, compared with control cells from the same subject. Error bars indicate SD. N = 6. **P < .01 and *P < .05. (D) Representative of flow cytometric profiles showing SRT2104 increased F-cell proportions in adult erythroid cells [Color figure can be viewed at wileyonlinelibrary.com]
3.4 SIRT1 protein level is downregulated in adult compared with cord blood erythroid progenitor cells
While it is known that HBG is silenced in adult cells or decreased after erythroid progenitor cell differentiation, we sought to determine whether the level of SIRT1 was positively associated with the level of γ-globin chains. We performed an immunoblotting assay to compare SIRT1 levels in cord blood and adult erythroid progenitor cells and in undifferentiated and differentiated erythroid progenitor cells from cord blood. SIRT1 levels were decreased 6.5-fold in adult compared with cord blood progenitor cells (Supporting Information Figure S1A,B), and SIRT1 levels were decreased 5-fold when erythroid progenitor cells from cord blood were differentiated 12 days (Supporting Information Figure S1C). This result is consistent with the finding that SIRT1 levels are much higher in fetal than adult liver in both human38,39 and mouse,40,41 which suggested that SIRT1 downregulation in adults may play a physiological role in HBG silencing.
3.5 Effects of SIRT1 on cell proliferation and differentiation
Increased proliferation or delayed differentiation of erythroid progenitor cells can contribute to elevated HbF.42 As SIRT1 has been shown to be involved in cell growth and apoptosis we explored the mechanism by which SIRT1 regulates HBG expression by first determining whether SIRT1 played a role in erythroid progenitor cell proliferation.19 Cell numbers were counted in either the absence or presence of SIRT1 activators. As shown in Supporting Information Figure S1D, the cells exhibited comparable proliferation rates in control and SRT2104 treated cultures at 100 nM and 500 nM (Supporting Information Figure S1D). Cells treated with SRT2104 at 2 uM and 5 uM also trended toward increased proliferation, but differences were not significant (p = 0.07 at 2 uM and p = 0.19 at 5 uM) (Supporting Information Figure S1D). SRT2104 treatment at 10 uM, however, significantly reduced cell proliferation (P < .05) (Supporting Information Figure S1D). Given that SIRT1 activators were administered at concentrations that elevate HBG level (SRT2104 at 500 nM and 2 uM) (Figures 2 and 3) and did not affect cell proliferation, our results suggested that SIRT1 did not regulate HBG expression via an effect on cell proliferation.
We next determined whether the γ-globin induction by SIRT1 could be the result of a shift in erythroid progenitor and erythroblast differentiation and maturation. Glycophorin A (CD235a) is an established lineage specific marker for erythroid maturation and differentiation, and with erythroid progenitor differentiation, CD235a levels are increased. Erythroid progenitors from cord blood were differentiated with and without the SIRT1 activator SRT2104, and the resulting differentiated cells at day 7 and day 14 were examined by flow cytometry using marker CD235a.43 SRT2104 treatment did not change the cell populations expressing CD235a, compared with controls (Supporting Information Figure S1E). This suggested that SIRT1-mediated HBG upregulation most likely is not due to a change in erythroid progenitor cell differentiation or a shift in the erythroid progenitor and erythroblast cell populations.
3.6 SIRT1 binds in the LCR and to the HBG promoter, and facilitated LCR looping
SIRT1 can bind to multiple gene promoters or enhancers to regulate transcription by directly deacetylating histones, or interacting with and deacetylating transcription factors or co-regulators.21,22 To further understand the mechanism of SIRT1 activation of HBG transcription, we used ChIP to study SIRT1 binding to the LCR and HBG promoter in stable SIRT1 knockdown and shRNA control K562 cells. Specific SIRT1 binding in the LCR and HBG promoter was detected while no signal was found in the control sequences (Figure 4A). SIRT1 binding was greater in the LCR than in the HBG promoter; there was a 3.8-fold enrichment of SIRT1 in the LCR (P< .05) and 2-fold enrichment in the HBG promoter (P< .05) in shRNA control K562 cells (Figure 4A). Following SIRT1 knockdown, the enrichment of SIRT1 in both LCR and HBG promoter was decreased (Figure 4A). This suggested that SIRT1 might be involved in LCR- or HBG promoter-mediated gene transcriptional regulation. We further determined whether SIRT1 played a role in histone deacetylation in the HBG promoter. We analyzed the level of acetylated histones H3K9Ac and H4K16Ac, which are the targets of SIRT1, in the HBG promoter by ChIP analysis. The data show that there was no significant change in the acetylation level of histone H3K9 but decreased H4K16 acetylation by SIRT1 knockdown in the HBG promoter (Figure 4B). This suggested that SIRT1 did not directly deacetylate histones in the HBG promoter but instead indirectly increased histone acetylation. We also determined the effect of SIRT1 knockdown on the binding of Pol II protein, a marker for active gene transcription in the HBG promoter (Figure 4B). There was a positive correlation of SIRT1 binding with Pol II occupancy in the HBG promoter. These results suggested that SIRT1 might regulate transcription factors or/and co-regulators in the LCR or/and HBG promoter, thereby activating HBG transcription, however had little effect on HBG transcription through its histone deacetylase activity in the HBG promoter.
FIGURE 4.

SIRT1 binding in the LCR and the HBG promoter, activated the HBG promoter and regulated LCR looping to the HBG promoter. (A) ChIP assay examining SIRT1 binding to the LCR and HBG promoter in K562 cells. Sonicated DNA from SIRT1 knockdown (shSIRT1) or scrambled shRNA infected K562 cells (Scrambled) was precipitated with anti-SIRT1 antibody or control IgG. The abundance of DNA precipitated with anti-SIRT1 antibody was normalized to that precipitated with IgG. Cont: internal control sequence. Error bars indicate SD, N = 3. (B) ChIP assay examining histone acetylation and Pol II binding in HBG promoter in K562 cells. Sonicated DNA from SIRT1 knockdown (shSIRT1) or scrambled shRNA infected K562 cells (Scrambled) was precipitated with anti-H3K9Ac, anti-H4K16Ac, and Pol II antibody or control IgG. The abundance of DNA precipitated with antibodies was normalized to that precipitated with IgG. Error bars indicate SD, N = 3. (C) SIRT1 knockdown in K562 cells decreased the looping of LCR to HBG promoter. 3C assay measuring crosslinking frequencies between the LCR and HBG or HBD in K562 cells expressing SIRT1 (scrambled) or SIRT1 knockdown cells (shSIRT1). The EcoRI fragment containing HS of the LCR (black bar) was used as the anchor region. Its crosslinking frequency with EcoRI fragments that contain HBG or HBD was assessed. Each 3C value was normalized to tubulin; The interaction frequencies between the anchor fragment and the fragment encompassing the HBG from the scrambled control sample were set to one. HBG or HBD are depicted on the bottom of the graph, with chromosomal position coordinates. The EcoRI digestion sites are depicted as black triangles. Error bars indicate SEM (n = 3). (D) SIRT1 activators decreased HBG suppressor gene expression. Erythroid progenitor cells from cord blood were treated with SRT2104 at day 4 of phase 2 and harvested for mRNA purification at day 12 of erythroid differentiation (phase 2). cDNA was synthesized and qRT-PCR were performed with primers for BCL11A, HDAC1, HDAC2 and KLF1. mRNA was normalized to 18S. Error bars indicate SD. N = 3
We, next performed chromatin conformation capture (3C) analysis to study whether SIRT1 regulated LCR and HBG interaction (LCR looping), using stable SIRT1 knockdown and shRNA control K562 cells. SIRT1 knockdown resulted in a 3-fold (P < .05) decrease in the interaction of the LCR and HBG promoter (Figure 4C). SIRT1 did not appear to play a role in the interaction of the LCR with the HBD promoter (Figure 4C). These results suggested that SIRT1-mediated LCR looping to HBG promoter might be one of the mechanisms by which SIRT1 regulates HBG expression.
3.7 SIRT1 selectively regulated HBG co-suppressor gene expression
As SIRT1 can regulate transcription of many genes, we also determined whether SIRT1 might play a role in controlling expression of HBG corepressors. We used qRT-PCR analyses to determine the effect of SIRT1 activator treatment on the expression of the established HBG suppressors BCL11A, ZBTB7A, KLF1, LSD1, HDAC1, HDAC2, and HDAC3. BCL11A, KLF1, HDAC1, and HDAC2 mRNA levels were significantly down-regulated by SRT2104 (Figure 4D), whereas levels of ZBTB7A, LSD1 and HDAC3 transcripts were unaffected (data not shown). SRT2104 treatment at 2 uM decreased BCL11A 3.5-fold (P < .01), KLF1 3-fold (P < .05), HDAC1 2-fold (P < .05), and HDAC2 3fold (P < .01), respectively (Figure 4D). These data suggested that inhibiting HBG suppressors could be another mechanism by which SIRT1 activated HBG gene expression through transcription reprogramming mechanism.
4 DISCUSSION
SIRT1 is a novel inducer of HBG expression in both adult and cord blood erythroid cells. SIRT1 might activate HBG expression through transcriptional reprogramming. SIRT1 directly binds to the LCR and HBG promoter and enhanced the enrichment of Pol II and H4K16Ac in the HBG promoter. SIRT1 regulated LCR looping to the HBG promoter and suppressed the transcription of several HBG suppressors, including BCL11A, KLF1, HDAC1, and HDAC2. Decreased expression of SIRT1 in adults might result in reduced LCR looping to the HBG promoter, increased co-repressor gene expression and enhanced co-repressor complex formation at the LCR and HBG promoters, all of which contribute to HBG silencing.
The small molecule SIRT1 activators SRT2104 and SRT1720 induced γ-globin gene expression and are potential reagents for treating β-hemoglobinopathies. When tested alongside hydroxyurea, the effect of both SRT2104 and SRT1720 were superior at their optimal concentrations in primary human erythroid cells. Whether SIRT1 activators can augment γ-globin induction through combination with hydroxyurea or other γ-globin inducers is the subject of future studies.
SIRT1 did not change the erythroid cell proliferation (Supporting Information Figure S1D), suggesting that this is not a mechanism by which SIRT1 effects HBG expression. SIRT1 did not change the expression of CD235a (Supporting Information Figure S1E), suggesting that erythroid differentiation was not an element of SIRT1-mediated HBG expression in vitro. This data is consistent with the finding that SIRT1 deletion in adult mice had no effect on the production of mature blood cells and hematopoiesis.44–46 However, there is a report showing that SIRT1 knockout affects primitive but not definitive hematopoiesis.47 Whether SIRT1 regulates differentiation in different cell culture system and in vivo needs further study.
SIRT1 can deacetylate both nonhistone and histone proteins.19,21 Deacetylation of histones in gene promoters suppresses transcription.48 ChIP experiments showed that SIRT1 knockdown caused a decreased H4K16Ac level in the HBG promoter (Figure 4B) but had no effect on acetylated H3K9. This suggested that SIRT1 did not directly deacetylate histone in the HBG promoter, but rather indirectly regulated histone acetylation, perhaps by inhibiting HDAC1 and HDAC2 (Figure 4D). SIRT1 binds directly to the LCR and HBG promoter and favors LCR looping, suggesting that SIRT1 might also interact with and deacetylate transcription factors or co-regulators altering transcription complex formation to activate HBG transcription. BCL11A is a key transcription factors regulating LCR looping and HBG silencing.33,49–51 A direct interaction between SIRT1 and BCL11A has been previously reported.52 Whether SIRT1 and BCL11A form complexes involved in the interaction of the LCR with globin-gene promoters is under study. Our data showed that SIRT1 inhibited the expression of HBG repressors, including BLC11A, KLF1, HDAC1, and HDAC2. These data support the role of SIRT1 as an activator of HBG transcription through a transcription reprogramming mechanism.
Other mechanisms by which SIRT1 regulates HBG transcription are possible. For example, SIRT1 deacetylates and increases the transcription function of FOXO3a, which has been shown to regulate HBG transcription.53 SIRT1 was also involved in the stress response54 that upregulates HBG expression.55 In addition, more extensive studies in vitro and in vivo are needed to completely understand the role of SIRT1 in cell differentiation. A more complete understanding of the mechanisms by which SIRT1 regulates HBG transcription should precede the development of SIRT1 as a potential therapeutic target for γ-globin gene induction in β-hemoglobinopathies.
Supplementary Material
Acknowledgments
This work was supported by grants from the National Cancer Institute CA141036 (Y Dai), CA129046 (Y Dai), Clinical and Translational Science Institute award from NIH (1UL1TROO1430), Evans foundation (Y Dai), and a Department of Medicine Pilot Project Grant (Y. Dai).
Funding information
National Cancer Institute, Grant/Award Numbers: CA141036 (Y Dai), CA129046 (Y Dai); Clinical and Translational Science Institute award from NIH, Grant/Award Number: UL1TR001430; Evans foundation (Y Dai), and a Department of Medicine Pilot Project Grant (Y. Dai)
Footnotes
CONFLICT OF INTEREST
The authors declare no competing financial interests.
ORCID
SUPPORTING INFORMATION
Additional Supporting Information may be found online in the supporting information tab for this article.
References
- 1.Steinberg MH, Sebastiani P. Genetic modifiers of sickle cell disease. Am J Hematol. 2012;87:795–803. doi: 10.1002/ajh.23232. [DOI] [PMC free article] [PubMed] [Google Scholar]
- 2.Lettre G, Bauer DE. Fetal haemoglobin in sickle-cell disease: from genetic epidemiology to new therapeutic strategies. Lancet. 2016;387:2554–2564. doi: 10.1016/S0140-6736(15)01341-0. [DOI] [PubMed] [Google Scholar]
- 3.Noguchi CT, Rodgers GP, Serjeant G, Schechter AN. Levels of fetal hemoglobin necessary for treatment of sickle cell disease. N Engl J Med. 1988;318:96–99. doi: 10.1056/NEJM198801143180207. [DOI] [PubMed] [Google Scholar]
- 4.Sankaran VG. Targeted therapeutic strategies for fetal hemoglobin induction. Hematology/the Education Program of the American Society of. Hematology Am Soc Hematol Educ Program. 2011;2011:459–465. doi: 10.1182/asheducation-2011.1.459. [DOI] [PubMed] [Google Scholar]
- 5.Bauer DE, Kamran SC, Orkin SH. Reawakening fetal hemoglobin: prospects for new therapies for the beta-globin disorders. Blood. 2012;120:2945–2953. doi: 10.1182/blood-2012-06-292078. [DOI] [PMC free article] [PubMed] [Google Scholar]
- 6.Steinberg MH, McCarthy WF, Castro O, et al. The risks and benefits of long-term use of hydroxyurea in sickle cell anemia: a 17.5 year follow-up. Am J Hematol. 2010;85:403–408. doi: 10.1002/ajh.21699. [DOI] [PMC free article] [PubMed] [Google Scholar]
- 7.Sclafani S, Pecoraro A, Agrigento V, et al. Study on hydroxyurea response in hemoglobinopathies patients using genetic markers and liquid erythroid cultures. Hematol Rep. 2016;8:6678. doi: 10.4081/hr.2016.6678. [DOI] [PMC free article] [PubMed] [Google Scholar]
- 8.Rakotoson MG, Di Liberto G, Audureau E, et al. Biological parameters predictive of percent dense red blood cell decrease under hydroxyurea. Orphanet J Rare Dis. 2015;10:57. doi: 10.1186/s13023-015-0272-3. [DOI] [PMC free article] [PubMed] [Google Scholar]
- 9.Koenig SC, Becirevic E, Hellberg MS, et al. Sickle cell disease caused by heterozygosity for Hb S and novel LCR deletion: report of two patients. Am J Hematol. 2009;84:603–606. doi: 10.1002/ajh.21480. [DOI] [PubMed] [Google Scholar]
- 10.Breda L, Motta I, Lourenco S, et al. Forced chromatin looping raises fetal hemoglobin in adult sickle cells to higher levels than pharmacologic inducers. Blood. 2016;128:1139–1143. doi: 10.1182/blood-2016-01-691089. [DOI] [PMC free article] [PubMed] [Google Scholar]
- 11.Deng W, Rupon JW, Krivega I, et al. Reactivation of developmentally silenced globin genes by forced chromatin looping. Cell. 2014;158:849–860. doi: 10.1016/j.cell.2014.05.050. [DOI] [PMC free article] [PubMed] [Google Scholar]
- 12.Masuda T, Wang X, Maeda M, et al. Transcription factors LRF and BCL11A independently repress expression of fetal hemoglobin. Science (New York, NY) 2016;351:285–289. doi: 10.1126/science.aad3312. [DOI] [PMC free article] [PubMed] [Google Scholar]
- 13.Sankaran VG, Menne TF, Xu J, et al. Human fetal hemoglobin expression is regulated by the developmental stage-specific repressor BCL11A. Science (New York, NY) 2008;322:1839–1842. doi: 10.1126/science.1165409. [DOI] [PubMed] [Google Scholar]
- 14.Shi L, Cui S, Engel JD, Tanabe O. Lysine-specific demethylase 1 is a therapeutic target for fetal hemoglobin induction. Nat Med. 2013;19:291–294. doi: 10.1038/nm.3101. [DOI] [PMC free article] [PubMed] [Google Scholar]
- 15.Bradner JE, Mak R, Tanguturi SK, et al. Chemical genetic strategy identifies histone deacetylase 1 (HDAC1) and HDAC2 as therapeutic targets in sickle cell disease. Proc Natl Acad Sci U S A. 2010;107:12617–12622. doi: 10.1073/pnas.1006774107. [DOI] [PMC free article] [PubMed] [Google Scholar]
- 16.Aerbajinai W, Zhu J, Kumkhaek C, Chin K, Rodgers GP. SCF induces gamma-globin gene expression by regulating downstream transcription factor COUP-TFII. Blood. 2009;114:187–194. doi: 10.1182/blood-2008-07-170712. [DOI] [PMC free article] [PubMed] [Google Scholar]
- 17.Thein SL, Menzel S, Lathrop M, Garner C. Control of fetal hemoglobin: new insights emerging from genomics and clinical implications. Hum Mol Genet. 2009;18:R216–R223. doi: 10.1093/hmg/ddp401. [DOI] [PMC free article] [PubMed] [Google Scholar]
- 18.Rivers A, Vaitkus K, Ibanez V, et al. The LSD1 inhibitor RN-1 recapitulates the fetal pattern of hemoglobin synthesis in baboons (P. anubis) Haematologica. 2016;101:688–697. doi: 10.3324/haematol.2015.140749. [DOI] [PMC free article] [PubMed] [Google Scholar]
- 19.Haigis MC, Guarente LP. Mammalian sirtuins-emerging roles in physiology, aging, and calorie restriction. Gene Dev. 2006;20:2913–2921. doi: 10.1101/gad.1467506. [DOI] [PubMed] [Google Scholar]
- 20.Brooks CL, Gu W. How does SIRT1 affect metabolism, senescence and cancer? Nat Rev Cancer. 2009;9:123–128. doi: 10.1038/nrc2562. [DOI] [PMC free article] [PubMed] [Google Scholar]
- 21.Dai Y, Faller DV. Transcription Regulation by Class III Histone Deacetylases (HDACs)-Sirtuins. Transl Oncogenomics. 2008;3:53–65. doi: 10.4137/tog.s483. [DOI] [PMC free article] [PubMed] [Google Scholar]
- 22.Zhang T, Kraus WL. SIRT1-dependent regulation of chromatin and transcription: linking NAD(+) metabolism and signaling to the control of cellular functions. Biochim Biophys Acta. 2010;1804:1666–1675. doi: 10.1016/j.bbapap.2009.10.022. [DOI] [PMC free article] [PubMed] [Google Scholar]
- 23.Brunet A, Sweeney LB, Sturgill JF, et al. Stress-dependent regulation of FOXO transcription factors by the SIRT1 deacetylase. Science (New York, NY) 2004;303:2011–2015. doi: 10.1126/science.1094637. [DOI] [PubMed] [Google Scholar]
- 24.Donmez G, Wang D, Cohen DE, Guarente L. SIRT1 suppresses beta-amyloid production by activating the alpha-secretase gene ADAM10. Cell. 2010;142:320–332. doi: 10.1016/j.cell.2010.06.020. [DOI] [PMC free article] [PubMed] [Google Scholar] [Retracted]
- 25.Rajendran R, Garva R, Krstic-Demonacos M, Demonacos C. Sirtuins: molecular traffic lights in the crossroad of oxidative stress, chromatin remodeling, and transcription. J Biomed Biotechnol. 2011;2011:368276. doi: 10.1155/2011/368276. [DOI] [PMC free article] [PubMed] [Google Scholar]
- 26.Xue Z, Lv X, Song W, et al. SIRT1 deacetylates SATB1 to facilitate MAR HS2-MAR epsilon interaction and promote epsilon-globin expression. Nucleic Acids Res. 2012;40:4804–4815. doi: 10.1093/nar/gks064. [DOI] [PMC free article] [PubMed] [Google Scholar]
- 27.Okam MM, Ebert BL. Novel approaches to the treatment of sickle cell disease: the potential of histone deacetylase inhibitors. Expert Rev Hematol. 2012;5:303–311. doi: 10.1586/ehm.12.20. [DOI] [PubMed] [Google Scholar]
- 28.Zhu L, Chiao CY, Enzer KG, Stankiewicz AJ, Faller DV, Dai Y. SIRT1 inactivation evokes antitumor activities in NSCLC through the tumor suppressor p27. Mol Cancer Res. 2015;13:41–49. doi: 10.1158/1541-7786.MCR-14-0239. [DOI] [PMC free article] [PubMed] [Google Scholar]
- 29.Dai Y, Sangerman J, Luo HY, et al. Therapeutic fetal-globin inducers reduce transcriptional repression in hemoglobinopathy erythroid progenitors through distinct mechanisms. Blood Cell Mol Dis. 2016;56:62–69. doi: 10.1016/j.bcmd.2015.10.004. [DOI] [PMC free article] [PubMed] [Google Scholar]
- 30.van den Akker E, Satchwell TJ, Pellegrin S, Daniels G, Toye AM. The majority of the in vitro erythroid expansion potential resides in CD34((2212)) cells, outweighing the contribution of CD34(+) cells and significantly increasing the erythroblast yield from peripheral blood samples. Haematologica. 2010;95:1594–1598. doi: 10.3324/haematol.2009.019828. [DOI] [PMC free article] [PubMed] [Google Scholar]
- 31.Mabaera R, Richardson CA, Johnson K, Hsu M, Fiering S, Lowrey CH. Developmental- and differentiation-specific patterns of human gamma- and beta-globin promoter DNA methylation. Blood. 2007;110:1343–1352. doi: 10.1182/blood-2007-01-068635. [DOI] [PMC free article] [PubMed] [Google Scholar]
- 32.Byles V, Zhu L, Lovaas JD, et al. SIRT1 induces EMT by cooperating with EMT transcription factors and enhances prostate cancer cell migration and metastasis. Oncogene. 31:4619–4629. doi: 10.1038/onc.2011.612. [DOI] [PMC free article] [PubMed] [Google Scholar]
- 33.Kiefer CM, Lee J, Hou C, et al. Distinct Ldb1/NLI complexes orchestrate gamma-globin repression and reactivation through ETO2 in human adult erythroid cells. Blood. 2011;118:6200–6208. doi: 10.1182/blood-2011-06-363101. [DOI] [PMC free article] [PubMed] [Google Scholar]
- 34.van Steensel B, Dekker J. Genomics tools for unraveling chromosome architecture. Nat Biotechnol. 2010;28:1089–1095. doi: 10.1038/nbt.1680. [DOI] [PMC free article] [PubMed] [Google Scholar]
- 35.Hou C, Dale R, Dean A. Cell type specificity of chromatin organization mediated by CTCF and cohesin. Proc Natl Acad Sci U S A. 107:3651–3656. doi: 10.1073/pnas.0912087107. [DOI] [PMC free article] [PubMed] [Google Scholar]
- 36.Hoffmann E, Wald J, Lavu S, et al. Pharmacokinetics and tolerability of SRT2104, a first-in-class small molecule activator of SIRT1, after single and repeated oral administration in man. Brit J Clin Pharmacol. 2013;75:186–196. doi: 10.1111/j.1365-2125.2012.04340.x. [DOI] [PMC free article] [PubMed] [Google Scholar]
- 37.Vaziri H, Dessain SK, Ng Eaton E, et al. hSIR2(SIRT1) functions as an NAD-dependent p53 deacetylase. Cell. 2001;107:149–159. doi: 10.1016/s0092-8674(01)00527-x. [DOI] [PubMed] [Google Scholar]
- 38.Sakamoto J, Miura T, Shimamoto K, Horio Y. Predominant expression of Sir2alpha, an NAD-dependent histone deacetylase, in the embryonic mouse heart and brain. FEBS Lett. 2004;556:281–286. doi: 10.1016/s0014-5793(03)01444-3. [DOI] [PubMed] [Google Scholar]
- 39.Tobita T, Guzman-Lepe J, Takeishi K, et al. SIRT1 disruption in human fetal hepatocytes leads to increased accumulation of glucose and lipids. PloS One. 2016;11:e0149344. doi: 10.1371/journal.pone.0149344. [DOI] [PMC free article] [PubMed] [Google Scholar]
- 40.Ogawa T, Wakai C, Saito T, et al. Distribution of the longevity gene product, SIRT1, in developing mouse organs. Congenit Anom (Kyoto) 2011;51:70–79. doi: 10.1111/j.1741-4520.2010.00304.x. [DOI] [PubMed] [Google Scholar]
- 41.McBurney MW, Yang X, Jardine K, Bieman M, Th’ng J, Lemieux M. The absence of SIR2alpha protein has no effect on global gene silencing in mouse embryonic stem cells. Mol Cancer Res. 2003;1:402–409. [PubMed] [Google Scholar]
- 42.Pace BS, Liu L, Li B, Makala LH. Cell signaling pathways involved in drug-mediated fetal hemoglobin induction: strategies to treat sickle cell disease. Exp Biol Med (Maywood) 2015;240:1050–1064. doi: 10.1177/1535370215596859. [DOI] [PMC free article] [PubMed] [Google Scholar]
- 43.Leberbauer C, Boulme F, Unfried G, Huber J, Beug H, Mullner EW. Different steroids co-regulate long-term expansion versus terminal differentiation in primary human erythroid progenitors. Blood. 2005;105:85–94. doi: 10.1182/blood-2004-03-1002. [DOI] [PubMed] [Google Scholar]
- 44.Yuan H, Wang Z, Li L, et al. Activation of stress response gene SIRT1 by BCR-ABL promotes leukemogenesis. Blood. 2012;119:1904–1914. doi: 10.1182/blood-2011-06-361691. [DOI] [PMC free article] [PubMed] [Google Scholar]
- 45.Leko V, Varnum-Finney B, Li H, et al. SIRT1 is dispensable for function of hematopoietic stem cells in adult mice. Blood. 2011;119:1856–1860. doi: 10.1182/blood-2011-09-377077. [DOI] [PMC free article] [PubMed] [Google Scholar]
- 46.Narala SR, Allsopp RC, Wells TB, et al. SIRT1 acts as a nutrient-sensitive growth suppressor and its loss is associated with increased AMPK and telomerase activity. Mol Biol Cell. 2008;19:1210–1219. doi: 10.1091/mbc.E07-09-0965. [DOI] [PMC free article] [PubMed] [Google Scholar]
- 47.Ou X, Chae HD, Wang RH, et al. SIRT1 deficiency compromises mouse embryonic stem cell hematopoietic differentiation, and embryonic and adult hematopoiesis in the mouse. Blood. 2011;117:440–450. doi: 10.1182/blood-2010-03-273011. [DOI] [PMC free article] [PubMed] [Google Scholar]
- 48.Gallinari PD, Marco S, Jones P, Pallaoro M, Steinkuhler C. HDACs, histone deacetylation and gene transcription: from molecular biology to cancer therapeutics. Cell Res. 2007;17:195–211. doi: 10.1038/sj.cr.7310149. [DOI] [PubMed] [Google Scholar]
- 49.Song SH, Hou C, Dean A. A positive role for NLI/Ldb1 in long-range beta-globin locus control region function. Mol Cell. 2007;28:810–822. doi: 10.1016/j.molcel.2007.09.025. [DOI] [PMC free article] [PubMed] [Google Scholar]
- 50.Deng W, Lee J, Wang H, et al. Controlling long-range genomic interactions at a native locus by targeted tethering of a looping factor. Cell. 2012;149:1233–1244. doi: 10.1016/j.cell.2012.03.051. [DOI] [PMC free article] [PubMed] [Google Scholar]
- 51.Xu J, Sankaran VG, Ni M, et al. Transcriptional silencing of {gamma}-globin by BCL11A involves long-range interactions and cooperation with SOX6. Genes Dev. 2010;24:783–798. doi: 10.1101/gad.1897310. [DOI] [PMC free article] [PubMed] [Google Scholar]
- 52.Senawong T, Peterson VJ, Leid M. BCL11A-dependent recruitment of SIRT1 to a promoter template in mammalian cells results in histone deacetylation and transcriptional repression. Arch Biochem Biophys. 2005;434:316–325. doi: 10.1016/j.abb.2004.10.028. [DOI] [PMC free article] [PubMed] [Google Scholar]
- 53.Rahim F, Allahmoradi H, Salari F, et al. Evaluation of signaling pathways involved in gamma-globin gene induction using fetal hemoglobin inducer drugs. Int J Hematol Oncol Stem Cell Res. 2013;7:41–46. [PMC free article] [PubMed] [Google Scholar]
- 54.Salminen A, Kaarniranta K, Kauppinen A. Crosstalk between Oxidative Stress and SIRT1: impact on the aging process. Int J Mol Sci. 2013;14:3834–3859. doi: 10.3390/ijms14023834. [DOI] [PMC free article] [PubMed] [Google Scholar]
- 55.Schaeffer EK, West RJ, Conine SJ, Lowrey CH. Multiple physical stresses induce gamma-globin gene expression and fetal hemoglobin production in erythroid cells. Blood Cells, Mol Dis. 2014;52:214–224. doi: 10.1016/j.bcmd.2013.10.007. [DOI] [PubMed] [Google Scholar]
Associated Data
This section collects any data citations, data availability statements, or supplementary materials included in this article.