

Abstract
Background:
India is a populous country of about 1.3 billion. Non communicable diseases (NCDs) contribute to around 5.87 million (60%) of all deaths in India. Hence, the objectives of this paper are to find baseline information on different NCD risk factors coverage and to determine their trends in India.
Methods:
For this systematic review, PubMed, Google and different surveillance systems were searched. Of the search results, 41 papers/survey reports were eventually assessed for eligibility. National and state representative data on NCD risk factors (for the major NCDs like cardiovascular diseases, chronic respiratory disease, cancer and diabetes) having World Health Organization(WHO) indicator definitions, covering rural and urban population, were included in the study. Thereafter, state-wise population proportion was added and divided by the total Indian population to determine the percentage of population coverage for each risk factor by the surveys. Also, the old and current data of the periodic surveys were compared to assess prevalence trends.
Results:
Various national/state level surveys in India include single or multiple risk factors. Nationwide coverage is available for tobacco use, alcohol drinking, raised blood pressure and overweight and obesity. Periodic National Family Health Surveys provide information on selected risk factors during 2005-16 among adults aged 15-49 years. An overall significant increase was noted in overweight and obesity while decline was noted in tobacco and alcohol use during the same period. From GATS 1 (2009-10) to 2 (2016-17) also, the prevalence of tobacco consumption decreased in India.
Conclusion:
India has a much delayed response on NCD risk factors surveillance and information of the same are sporadic and incomplete. In order to increase information comprehensiveness, standard WHO NCD risk factors questions must be incorporated in the ongoing surveys. India should also plan for cost and time effective NCD surveillance system.
Keywords: Chronic disease, India, risk factors
Introduction
Non-communicable diseases (NCDs) encompass a vast group of diseases such as cardiovascular diseases, cancer, diabetes and chronic respiratory diseases. NCDs contribute to around 38 million (68%) of all the deaths globally and to about 5.87 million (60%) of all deaths in India. Four NCDs mainly responsible for the total NCD mortality and morbidity are cardiovascular diseases, chronic respiratory disease, cancers and diabetes, contributing to about 82% of all NCD deaths (World Health Organization - WHO, 2014).
The majority of NCD deaths occur in low and middle-income countries such as India, which is undergoing an epidemiological health transition owing to rapid urbanization, which in turn has led to an overall economic rise, but with certain associated flipsides (risk factors) (Chakma and Gupta, 2014). A risk factor is defined as “An aspect of personal behavior or lifestyle, an environmental exposure, or a hereditary characteristic that is associated with an increase in the occurrence of a particular disease, injury, or other health condition” (Centers for Disease Control and Prevention, 2006). These behavioral and biological risk factors, with a predisposition to the development of NCDs, are use of tobacco and alcohol, physical inactivity, overweight and obesity, increased fat and sodium intake, low fruit and vegetable intake, raised blood pressure (BP), blood glucose and cholesterol levels (WHO, 2013).
India being a populous country of about 1.3 billion, contributes to more than 2/3rd of the total deaths due to NCDs in the South-East Asia Region (SEAR) of WHO (WHO, 2014; United Nations Statistics Division). As per the 2011 report on NCD status in SEAR, raised BP, raised blood glucose and tobacco use were the three major risk factors responsible for majority of deaths annually in this region. The prevalence of raised BP was greater in Myanmar (highest – 42%), Indonesia, Sri Lanka, Bhutan and Thailand as compared to that in India (about 35%); however, Nepal, Maldives, Bangladesh and Democratic Republic of Korea (lowest -19%) showed a relatively lesser prevalence of the same. For raised blood glucose (diabetes), Bhutan showed the highest prevalence i.e. 12-13% and India, second highest i.e. 11%, among the SEAR countries. The prevalence of smoked tobacco products use was slightly lesser in Sri Lanka (14.1%) while it was much higher in Thailand (24%), Bangladesh (24%), Myanmar (24%), Maldives (27%), Nepal (32%) and Indonesia (highest - 33%), as compared to in India (15%). The prevalence of smokeless tobacco (SLT) products usagewas higher in India (25.9%) as compared to that in Thailand (1.3%), Sri Lanka (15.8%), Nepal (18.6%) and Bhutan (19.4%); however, Bangladesh (27.2%) and Myanmar (51.4%) showed relatively higher SLT consumption than in India (WHO, 2011).
WHO in its World Health Assembly in May 2008 put forth an Action Plan of Global Strategy for the Prevention and Control of NCDs. India also, as a WHO member state, is committed to implementing the same and taking the required steps and initiative to meet the objectives . As part of this plan, India has developed and is gradually developing a wide number of national public health programs. It has also performed various periodic surveys, both at the national and subnational/state levels, which directly or indirectly target NCDs (Chakma and Gupta, 2014). Few examples of these surveys are the National Family Health Survey (NFHS), Global Adult Tobacco Survey (GATS) etc. However, these are associated with a number of shortcomings, which need to be addressed in order to improvise NCD control in India. A similar study demonstrating the availability of data regarding NCD risk factors in India was published in 2012 by Raban et al, however without the representation and/or analysis of the same. Various authors have also published systematic reviews demonstrating trends in these surveys (which have been discussed subsequently) however only for one or few more risk factors, thereby rendering them non-comprehensive and incomplete. Also, these details regarding trends of NCD risk factors prevalence are available only upto 2012 (example: trend analysis of National Sample Survey Organization - NSSO surveys held between 1999-2012, for tobacco use prevalence by Bhan et al., 2016). For NFHS, previously, prevalence trends for tobacco consumption and overweight and obesity have been determined through data from 1998 to 2006; however, here this information has been updated till 2016. Thus, this paper examines the epidemiology and data availability of all the NCD risk factors.
Materials and Methods
For this systematic review on the NCD risk factors in India, national or state-level (subnational) surveys, which collected information on at least one NCD risk factor (for the major NCDs such as like cardiovascular diseases, chronic respiratory disease, cancer and diabetes), irrespective of the period of data collection or reporting or the sample size, were searched for and evaluated, between October 2016 to January 2017.
The online literature search strategy performed is shown in Figure 1:
Figure 1.
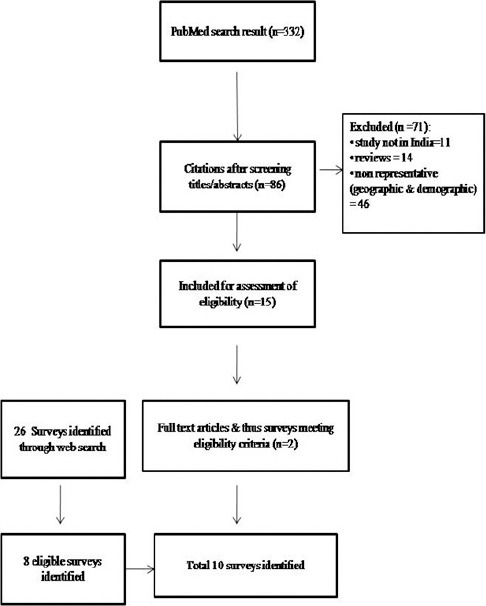
Search Strategy to Identify Surveys Documenting Non Communicable Disease Risk Factors in India
- Extensive PubMed literature search was performed using a combination of keywords such as noncommunicable diseases, NCD, risk factors, India, prevalence, tobacco, alcohol, fruit intake, vegetable intake, salt intake, physical activity, BMI, overweight, obesity, blood pressure, hypertension, blood glucose, diabetes, saturated fat, cholesterol. This search produced 332 results, the titles and abstracts of which were assessed and those clearly not relevant were excluded. Abstracts of the remaining publications and full papers were reviewed to identify those that fulfilled the inclusion criteria. Among these, 2 articles were found to be of potential interest and were thereby included.
- Also, Google and some of the known surveillance systems, known to conduct routine household surveys across various States and Union Territories (UTs) of India, were searched, like the NFHS, GATS, District Level Household and Facility Survey (DLHS), Integrated Disease Surveillance Program (IDSP) and Indian Council of Medical Research (ICMR), which revealed 5 eligible survey systems with 8 reports, performed between 1998-2016.
- The criteria for data selection, obtained from the search above, was as follows:
» Inclusion Criteria – studies/surveys which are national (representative of states or nationally representative), multiple-state representative or single state representative; surveys following the WHO indicator definitions for each risk factor; surveys covering both rural and urban population; manuscripts in English language:
1. Tobacco use - of any tobacco form in last 30 days (WHO, 2008).
2. Alcohol use - at least once previously in 30 days (WHO, 2008).
3. Physical inactivity - adults aged 18+ years not meeting any of these criteria: 150 minutes of moderate-or 75 minutes of vigorous or an equivalent combination of both types of physical activity accumulating atleast 600 MET (Metabolic Equivalent - ratio of a person’s working metabolic rate relative to the resting metabolic rate) minutes per week (WHO, 2013)
4. Salt Intake – >5 gm (2 gm sodium) (WHO, 2012).
5. Low fruit and/or vegetables consumption - <5 servings (400 grams) per day (WHO, 2013).
6. Raised blood pressure - Systolic blood pressure ≥140 and/or diastolic blood pressure ≥90 among persons aged 18+ years (WHO, 2013).
7. Raised blood glucose - an adult aged 18+ years with fasting plasma glucose value ≥7.0 mmol/L (126 mg/dl) or on medication for it (WHO, 2013).
8. Overweight and Obesity- Body mass index (BMI) ≥25 kg/m2 denotes overweight and ≥ 30 kg/m2 denotes obesity in adults aged 18+ years (WHO, 2013).
9. Increased saturated fat consumption - intake >150 mg/dL (WHO, 2013).
10. Raised cholesterol - if >5.0 mmol/L (190 mg/dl) (WHO, 2013).
» Exclusion Criteria – studies not set in India; surveys which are multiple or single state non-representative; surveys not following the WHO indicator definitions; surveys not covering both the rural and urban population; documents in languages other than English.
In total, 10 eligible surveys were identified through the aforementioned literature search.
Thereafter, state-wise population proportion was added and divided by the total Indian population to determine the percentage of population coverage for each risk factor by the surveys. The population count for all the Indian states and UTs are available in the Population Projection Report 2006 by the Office of the Registrar Generaland Census Commissioner, India – RGI (RGI, 2006). Also, the old and current data of the periodic surveys were compared to assess prevalence trends.
Results
The details of the various surveys have been summarized in Table 1. Of all the NCD risk factors, assessment by surveys for the prevalence of tobacco use, alcohol use, raised blood pressure and overweight and obesity, has been done almost nationwide. Specific details for each risk factor have been mentioned henceforth.
Table 1.
Survey Systems Representing Data on Non Communicable Disease Risk Factors in India that Met the Inclusion Criteria
| Name Of Survey | Period Of Survey | Total No. Of States/Union Territories Covered | Age Group (In Years) | Rural/Urban/Both | Number Of Risk Factors Covered | N | Periodic Survey |
|---|---|---|---|---|---|---|---|
| National, Representative Of States/Regions | |||||||
| National Family Health Survey | 1998-2016 | 36 | Women = 15-49, Men = 15-54 | Both | Tobacco Use, Alcohol Use, Raised Blood Pressure, Overweight and Obesity | 803,211 | Yes |
| Global Adult Tobacco Survey | 2009-2016 | 31 | 15 and Above | Both | Tobacco Use | 69,296 | Yes |
| District Level Household And Facility Survey | 2012-13 | 21 | 15-49 | Both | Raised Blood Pressure | Yes | |
| Multi State Representative | |||||||
| Integrated Disease Surveillance Program | 2007-08 | 7 | 15 – 64 | Both | Tobacco Use, Alcohol Use, Physical Inactivity, Raised Blood Pressure, Overweight and Obesity, Low Fruits and Vegetables Intake | 38,054 | No |
| Indian Council Of Medical Research India Diabetes Study | 2008-11 | 4 | 20 And Above | Both | Physical Inactivity, Raised Blood Pressure, Overweight & Obesity, Raised Blood Glucose | 14,277 | No |
| Single State Representative | |||||||
| Punjab Survey | 2014-15 | 1 | 18 – 69 | Both | Tobacco use, Salt use, Physical Inactivity, Raised Blood Pressure, Overweight and Obesity, Low Fruits & Vegetables Intake, Saturated Fat intake, Total Cholestrol | 5,127 | No |
| Kerala Survey | 2003-04 | 1 | 30-74 | Both | Tobacco use, Overweight and Obesity | 6,579 | No |
Behavioral Risk Factors for NCDs
1. Tobacco Use
Tobacco consumption has been recorded extensively for 100% (12,62,940,000)of the population in all Indian states and UTs, by NFHS (International Institute for Population Sciences- IIPS, 2007, 2015-16) and GATS (IIPS, 2009; Tata Institute of Social Sciences- TISS, 2017). Other surveys which have also recorded the prevalence of tobacco use among adults are IDSP (National Institute of Medical Statistics - NIMS, ICMR, 2009), the Punjab (Thakur et al., 2016) and Kerala (Sugathan et al., 2008) state surveys (Figure 2).
Figure 2.
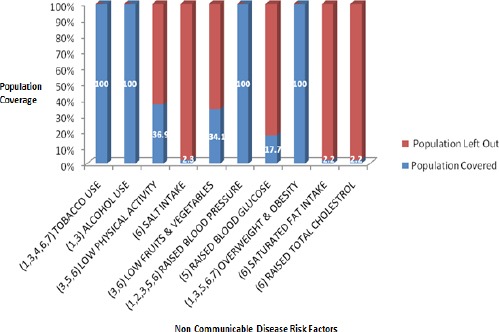
Percentage of Population Coverage for Each Non Communicable Disease Risk Factor by the Various Surveys. 1, National Family Health Survey; 2, District Level Household and Facility Survey; 3, Integrated Disease Surveillance Program; 4, Global Adult Tobacco Survey; 5, Indian Council of Medical Research India Diabetes Study; 6, Punjab State Survey; 7, Kerala State Survey
In NFHS, between 2005-16, a significant decline in tobacco use was noted among both males and females in India (Figure 3)(IIPS, 2007; 2015-16).
Figure 3.
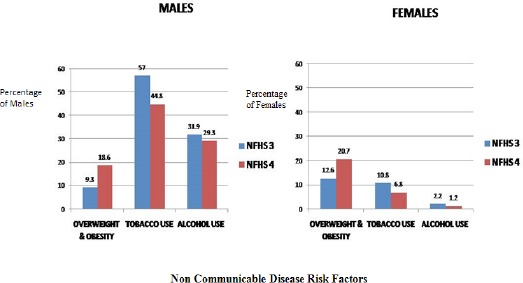
Pan-India Prevalence Trends Observed Among Males and Females During the National Family Health Surveys 3 (2005-06) and 4 (2015-16)
From GATS 1 (2009-10) (IIPS, 2009) to GATS 2 (2016-17) (TISS, 2017), the prevalence of tobacco consumption has decreased from 34.6 to 28.6% in India.
2. Alcohol Use
Alcohol usage has also been recorded by NFHS for 100% (12,62,940,000)of the Indian states and UTs (IIPS, 2007; 2015-16). Other survey which has recorded the prevalence of alcohol consumption is the IDSP (NIMS, ICMR, 2009) (Figure 2).
In NFHS, between 2005-16, an overall decline was seen in alcohol consumption among both males and females (Figure 3)(IIPS 2007; 2015-16).
3. Physical Inactivity
Physical inactivity has been recorded for a maximum of 36.9% of the total Indian population i.e. in 7 states by IDSP (NIMS, ICMR, 2009), followed by the ICMR India Diabetes (INDIAB) study (4 states/UTs) (ICMR, 2016) and the Punjab survey (single state) (Thakur et al., 2016) (Figure 2).
4. Salt Intake
The Punjab state survey documented salt intake by the residents of the state, constituting about 2.3% (290,10,000) of the Indian population (Figure 2) (Thakur et al., 2016).
5. Low Fruit and Vegetable Consumption
The IDSP (NIMS, ICMR, 2009) and Punjab state survey (Thakur et al., 2016) together recorded information for about 34.1% (4,30,501,000) of the Indian population, in a total of 8 states (Figure 2).
6. Saturated Fat Intake
Prevalence of increased saturated fat intake has been documented by the Punjab state survey for about 2.2% (290,10,000) of the Indian population (Figure 2) (Thakur et al., 2016).
Biological Risk Factors for NCDs
1. Raised Blood Pressure
Data regarding this NCD risk factor is available for population residing in 100% (12,62,940,000)of the Indian statesand UTs, through surveys like NFHS 4 (IIPS, 2015-16), DLHS (IIPS, 2012-13), IDSP (NIMS, ICMR, 2009), ICMR INDIAB (ICMR, 2016) and Punjab state survey (Thakur et al., 2016) (Figure 2). Although NFHS 4 follows the WHO indicator definition for raised blood pressure levels, it categorized the same as slightly above normal, moderately high and very high (IIPS, 2015-16).
2. Raised Blood Glucose
Raised blood glucose levels have been documented for about 17.7% (223,986,000) of the Indian population by the ICMR INDIAB (ICMR, 2016) survey (Figure 2).
3. Overweight and Obesity
Information regarding raised BMI has been documented for 100% (12,62,940,000) of the Indian population, mainly by NFHS (IIPS, 1998-99; 2007; 2015-16), along with IDSP (NIMS, ICMR, 2009), ICMR INDIAB (ICMR, 2016), Punjab (Thakur et al., 2016) and Kerala (Sugathan et al., 2008) state surveys (Figure 2).
In NFHS 2 and 3 (1998-2006), 6% increase in prevalence was seen in all states except Delhi (Sengupta et al., 2015); Garg et al. (2010) and Balarajan and Villamor (2009) also showed increased prevalence of obesity among Indian women from 10.6% to 12.6% and 10.6 to 14.8% respectively. In NFHS 3 and 4 (2005-16), an overall significant increase was noted both among males and females (Figure 3) (IIPS, 2007; 2015-16).
4. Raised Total Cholestrol
The Punjab state survey (2014-15) documented information regarding raised cholesterol levels from 2.2% (290,10,000) of the Indian population residing there (Figure 2) (Thakur et al., 2016).
Discussion
NCDs are a leading global public health problem, as established by the United Nations Summit on NCDs in September 2011 (Samuels et al., 2014). Regulating the increasing burden of NCDs in low and middle-income countries involves establishing adequate systems for monitoring the same and using the data obtained to upgrade or implement control strategies. In this paper we examined the availability of data measuring the NCD risk factor indicators as collected by household based surveys in India since 1998 till 2016. Based on the aforementioned observations among the various national and subnational surveys, the involved pitfalls have been elicited and discussed below:
1. Inadequate Coverage of the NCD Risk Factors –
Most surveys, national or sub-national, do not report data pertaining to every NCD risk factor. Only the survey performed in Punjab between 2014-15 has covered all of them (Thakur et al., 2016). Other surveys such as IDSP (NIMS, ICMR, 2009), NFHS 4 (2015-16) (IIPS, 2015-16), NFHS 3 (2005-06) (IIPS, 2007) etc. have recorded fewer number of risk factors, in the descending order.
2. Incomplete Geographical Coverage –
Inspite of being national level surveys, some have reported data only for a limited number of Indian states; the IDSP (NIMS, ICMR, 2009) and the ICMR INDIAB study (ICMR, 2016) have covered 7 and 4 Indian states respectively. NFHS (IIPS, 1998-99; 2007; 2015-16) and GATS (IIPS, 2009; TISS, 2017) covered most of the Indian states, along with the UTs but have information on limited risk factors.
Also, very few states have performed similar independent surveys till now, for example Punjab (Thakur et al., 2016) and Kerala (Sugathan et al., 2008).
3. Periodicity of Surveying –
The NFHS and GATS surveys have been held periodically till date i.e. NFHS from 1998 -2016 (IIPS, 1998-99; 2007; 2015-16), GATS in 2009 (IIPS, 2009) and 2016 (TISS, 2017). However, examples of other surveys which haven’t followed the same continuum are the IDSP performed only once in 2007-08 (NIMS, ICMR, 2009), the ICMR INDIAB study in 2008-11 (ICMR, 2016), the Punjab state survey in 2014-15 (Thakur et al., 2016) and the Kerala state survey in 2003-04 (Sugathan et al., 2008).
4. Lack of a Standardised Methodology –
Many surveys measured the WHO recommended core indicators incompletely or were missed because of the use of different indicator definitions, which have been elaborated upon below. Also, the variables covered differed amongst most surveys, i.e. some surveys accounted for data coverage based on gender, some based on the type of residence of the population while few surveys represented data with regard to both. Thus, a standardized approach should be employed while NCD risk factor data collection. Considering that large scale collection of blood samples is not an easy task, some of the biological risk factors requiring the same (example: blood cholesterol) were covered mostly by surveys of smaller geographic representativeness. However, as has been seen in NFHS (IIPS, 1998-99; 2007; 2015-16) and DLHS (IIPS, 2012-13), wherein blood samples were collected for testing for anaemia and Human Immunodeficiency Virus infection, the task does not seem impossible. Other easier or feasible alternatives for sample collection can be tried, for example, blood spots on filter paper instead of venous blood for measuring blood cholesterol in large surveys (Raban et al., 2015).
In addition to enumerating the various lacunae in the surveys, the current trends in the prevalence of the NCD risk factors have been demonstrated in this paper. The disparities or additional observations in other published data have been discussed below.
Bhan et al., (2016), in their analysis of the NSSO surveys (1999-2012) showed decline in bidi (from 24.9% to 14.9%) and increase in cigarette use (from 3.4% to 3.8%), especially among lower socioeconomic status (SES) groups; increased use of SLT (from 18.5% to 24%) across all SES groups was also noted. Mishra et al., (2016) compared the Special Fertility and Mortality Survey (1998), Sample Registration System Baseline Survey (2004) and GATS, wherein, despite decrease in the smoking prevalence, an increased number of male smokers, aged 15–69 years, was noted between 1998-2015. Sinha et al., (2015) showed a significantly increasing trend of SLT consumption among men (27.1% to 33.4%) and women (10.1% to 15.7%) in NFHS 2, 3 and GATS.
An increase in the prevalence of overweight and obese individuals from 7 % in 1975-79 to 24% in 2011-12 in National Nutrition Monitoring Board Surveys was noted by Meshram et al., (2016) and from 10.6% and 1.6% in 1998–99 to 12.6% and 1.5% in 2005-06, in women and pre-school children respectively, in NFHS by Wang et al., (2009).
In terms of alcohol intake, the Organization for Economic Co-operation and Development report, 2015 (Sassi, 2015) showed a major rise between 1992 and 2002. The WHO Global status report on Alcohol and Health, 2014 (WHO, 2014) also showed the same from 2003-05 to 2008-10.
Anjana et al., (2014) showed, that of the total sample in the ICMR INDIAB study (2008-11), 54.4% individuals were inactive, inactivity was more prevalent in the urban than rural areas and among females than males.
Bhansali et al., (2014) showed a higher prevalence of hypertension among the urban (31.5, 28.9, 30.7 and 28.1%) than the rural (26.2, 21.7, 19.8 and 24.0%) residents of Tamil Nadu, Jharkhand, Chandigarh and Maharashtra respectively, in the ICMR INDIAB study (2008-11).
In conclusion, surveillance and procurement of details regarding NCD risk factors is essential for health programs/policy planning and implementation, particularly in a country like India with a rapidly increasing burden of NCDs. Currently, a relative lack of adequate risk factor data in its entirety, inadequate coverage (geographically and demographically) and absence of a standardized methodology are the major deficiencies which need to be overcome for a superior and more effective NCD control in the country, which in turn would facilitate reduction of the overall NCD burden by 2025.
References
- Anjana RM, Pradeepa R, Das AK, et al. Physical activity and inactivity patterns in India –results from the ICMR-INDIAB study (Phase-1) [ICMR-INDIAB-5] Int J Behav Nutr Phys Act. 2014;11:1–11. doi: 10.1186/1479-5868-11-26. [DOI] [PMC free article] [PubMed] [Google Scholar]
- Balarajan Y, Villamor E. Nationally representative surveys show recent increases in the prevalence of overweight and obesity among women of reproductive age in Bangladesh, Nepal, and India. J Nutr. 2009;139:2139–44. doi: 10.3945/jn.109.112029. [DOI] [PubMed] [Google Scholar]
- Bhan N, Karan A, Srivastava S, et al. Have socioeconomic inequalities in Tobacco use in India increased over time?Trends from the national sample surveys (2000–2012) Nicotine Tob Res. 2016;18:1711–8. doi: 10.1093/ntr/ntw092. [DOI] [PMC free article] [PubMed] [Google Scholar]
- Bhansali A, Dhandania VK, Deepa M, et al. Prevalence of and risk factors for hypertension in urban and rural India: the ICMR–INDIAB study. J Hum Hypertens. 2015;29:204–9. doi: 10.1038/jhh.2014.57. [DOI] [PubMed] [Google Scholar]
- Centers for disease control and prevention. In ‘Glossary’. U.S. department of health and human services. Atlanta: Centers for disease control and prevention (CDC); 2006. Principles of epidemiology in public health practice third edition, An introduction to applied epidemiology and biostatistics. [Google Scholar]
- Chakma JK, Gupta S. Lifestyle and non-communicable diseases: A double edged sword for future India. Indian J Comm Health. 2014;26:325–32. [Google Scholar]
- Garg C, Khan SA, Ansari SH, Garg M. Prevalence of obesity in Indian women. Obes Rev. 2010;11:105–8. doi: 10.1111/j.1467-789X.2009.00666.x. [DOI] [PubMed] [Google Scholar]
- Indian council of medical research (ICMR) India diabetes (INDIAB) Study phase I, 2008-11. New Delhi, India: ICMR; 2016. [Google Scholar]
- International institute for population sciences (IIPS) and Macro international. National family health survey (NFHS-2), 1998-99. Mumbai, India: IIPS; 1998-99. [Google Scholar]
- International institute for population sciences (IIPS) and Macro international. National family health survey (NFHS-3), 2005–06: India: volume I. Mumbai, India: IIPS; 2007. [Google Scholar]
- International institute for population sciences (IIPS) Global adult Tobacco survey GATS India report 2009-10. Mumbai, India: IIPS; 2009. [Google Scholar]
- International institute for population sciences (IIPS) District level household and facility survey-4, 2012-13. Mumbai, India: IIPS; 2012-13. [Google Scholar]
- International institute for population sciences (IIPS) and Macro international. National family health survey (NFHS-4), State data fact sheets. Mumbai, India: IIPS; 2015-16. [Google Scholar]
- Meshram II, Balakrishna N, Sreeramakrishna N, et al. Trends in nutritional status and nutrient intakes and correlates of overweight/obesity among rural adult women (≥18–60 years) in India: National nutrition monitoring Bureau (NNMB) national surveys. Public Health Nutr. 2015;19:767–76. doi: 10.1017/S1368980015002268. [DOI] [PMC free article] [PubMed] [Google Scholar]
- Mishra S, Joseph RA, Gupta PC, et al. Trends in bidi and cigarette smoking in India from 1998 to 2015, by age, gender and education. BMJ Glob Health. 2016;1:e000005. doi: 10.1136/bmjgh-2015-000005. [DOI] [PMC free article] [PubMed] [Google Scholar]
- National institute of medical statistics, Indian council of medical research (ICMR) IDSP non-communicable disease risk factors survey, Phase-I states of India, 2007-08. New Delhi, India: National institute of medical statistics and division of non-communicable diseases, Indian council of medical research; 2009. [Google Scholar]
- Office of the registrar generaland census commissioner, India (RGI) Population projections for India and states 2001-2026. New Delhi, India: RGI; 2006. [Google Scholar]
- Raban MZ, Dandona R, Dandona L. Availability of data for monitoring noncommunicable disease risk factors in India. Bull World Health Organ. 2012;90:20–9. doi: 10.2471/BLT.11.091041. [DOI] [PMC free article] [PubMed] [Google Scholar]
- Rai RK. Factors associated with nutritional status among adult women in urban India, 1998-2006. Asia Pac J Public Health. 2015;27:NP1241–52. doi: 10.1177/1010539512450606. [DOI] [PubMed] [Google Scholar]
- Samuels TA, Kirton J, Guebert J. Monitoring compliance with high-level commitments in health: the case of the CARICOM Summit on chronic non-communicable diseases. Bull World Health Organ. 2014;92:270–6. doi: 10.2471/BLT.13.126128. [DOI] [PMC free article] [PubMed] [Google Scholar]
- Sassi F. Tackling harmful alcohol use: Economics and public health policy. Paris: OECD Publishing; 2015. [Google Scholar]
- Sengupta A, Angeli F, Syamala TS, et al. Overweight and obesity prevalence among Indian women by place of residence and socio-economic status: Contrasting patterns from 'underweight states'and 'overweight states'of India. Soc Sci Med. 2015;138:161–9. doi: 10.1016/j.socscimed.2015.06.004. [DOI] [PubMed] [Google Scholar]
- Sinha DN, Rizwan SA, Aryal KK, et al. Trends of smokeless tobacco use among adults (aged 15-49 years) in Bangladesh, India and Nepal. Asian Pac J Cancer Prev. 2015;16:6561–8. doi: 10.7314/apjcp.2015.16.15.6561. [DOI] [PubMed] [Google Scholar]
- Sugathan TN, Soman CR, Sankaranarayan K. Behavioural risk factors for noncommunicable diseases among adults in Kerala, India. Indian J Med Res. 2008;127:555–63. [PubMed] [Google Scholar]
- Tata institute of social sciences (TISS) Global adult tobacco survey GATS-2 India 2016-17. Mumbai, India: TISS; 2017. [Google Scholar]
- Thakur JS, Jeet G, Pal A, et al. Profile of risk factors for non-communicable diseases in Punjab, Northern India: Results of a state-wide STEPS survey. PLoS One. 2016;11:e0157705. doi: 10.1371/journal.pone.0157705. [DOI] [PMC free article] [PubMed] [Google Scholar]
- United nations statistics division. World statistics pocket book. 2017. [[Accessed 12 January 2017]]. Available at: http://data.un.org/CountryProfile.aspx?crName=INDIA .
- Wang Y, Chen HJ, Shaikh S, Mathur P. Is obesity becoming a public health problem in India?Examine the shift from under- to overnutrition problems over time. Obes Rev. 2009;10:456–74. doi: 10.1111/j.1467-789X.2009.00568.x. [DOI] [PubMed] [Google Scholar]
- World health organization. WHO STEPS surveillance manual: the WHO STEPwise approach to chronic disease risk factor surveillance. Geneva, Switzerland: WHO; 2008. [Google Scholar]
- World health organization. Noncommunicable diseases in the South-East Asia region: Situation and response 2011. New Delhi, India: World health organization regional office for South-East Asia; 2011. [Google Scholar]
- World health organization. Guideline: Sodium intake for adults and children. Geneva, Switzerland: World health organization; 2012. [PubMed] [Google Scholar]
- World health organization. Noncommunicable diseases global monitoring framework: Indicator definitions and specifications. Geneva, Switzerland: World health organization; 2013. [Google Scholar]
- World health organization. Global status report on alcohol and health 2014. Geneva, Switzerland: World health organization; 2014. [Google Scholar]
- World health organization. Global status report on noncommunicable diseases 2014. Geneva, Switzerland: World health organization; 2014. [Google Scholar]