Abstract
Pancreatic cancer is a lethal disease with a dreadful 5-year survival rate of only 5%. In spite of several treatment options, the prognosis still remains extremely poor. Therefore, novel therapy strategies with combinations of drugs are urgently required to combat this fatal disease. Tripto-lide (TPL) and celastrol (CL), two main compounds in traditional Chinese medicine isolated from Thunder God Vine, have a broad range of bioactivities including anticancer activity. Silk fibroin (SF), a naturally occurring protein with several unique properties, is an ideal carrier mate-rial. In this study, we prepared TPL and CL loaded silk fibroin nanoparticles (TPL-SFNPs and CL-SFNPs) by a modified desolvation method and evaluated their synergistic effects against human pancreatic cancer cells. Both SFNPs were characterized for particle size and zeta poten-tial. The entrapment efficiency, drug loading, and drug release profiles were evaluated by HPLC. The cytotoxicity and synergistic effect of SFNPs were investigated in MIA PaCa-2 and PANC-1 human pancreatic cells. The results showed that the particle sizes of TPL-SFNPs and CL-SFNPs were 166.4 ± 4.6 nm and 170.4 ± 2.3 nm, with a mean zeta potential −27.2 ± 2.0 mV and −25.5 ± 2.57 mV, respectively. TPL-SFNPs and CL-SFNPs have a drug loading of 57.0 ± 4.7 μg/mg and 63.5 ± 3.8 μg/mg along with an encapsulation efficiency of 81.8 ± 2.8% and 87.0 ± 5.1%, respectively. Drug release studies revealed that a rapid release of the drugs from SFNPs was observed at pH 4.5 (lysosomal pH) and a delayed release was observed at pH 7.4 (plasma pH). TPL-SFNPs (IC50 3.80 and 4.75 nM) and CL-SFNPs (IC50 0.38 and 0.64 μM) were 2–3 fold more potent against MIA PaCa-2 and PANC-1 cells than free TPL (IC50 11.25 and 11.58 nM) and CL (IC50 0.84 and 1.23 μM). Furthermore, co-treatment with TPL-SFNPs and CL-SFNPs increased the growth inhibition of the same cells significantly in comparison with TPL-SFNPs or CL-SFNPs alone. Almost all combination index (CI) values, calculated using the Compusyn software, were < 1, suggesting that the growth inhibition effect of TPL-SFNPs in combination with CL-SFNPs was synergistic rather than additive, further suggesting that this novel combination may offer a potential treatment for pancreatic cancer.
Keywords: Pancreatic cancer, triptolide, celastrol, silk fibroin nanoparticles, synergistic effect
Graphical Abstract
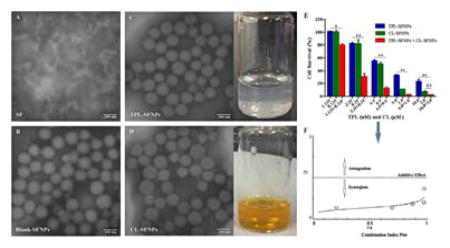
Novel combination of triptolide and celastrol loaded silk fibroin nanoparticles show synergistic anti-pancreatic cancer effect in vitro
1. Introduction
Pancreatic cancer is one of the most aggressive human malignancies with a 5-year survival rate of only 5%, which has a rather low morbidity of 2% among all cancers diagnosed but 6% of cancer deaths worldwide.1, 2 Pancreatic cancer is mainly treated with chemotherapeutic drugs, which may result in side effects and potential drug resistance that can further lead to the unfortunate demise of the patient.3–5 The current standard drug for chemotherapy to treat pancreatic cancer is gemcitabine; however, its efficacy is far from satisfactory. To date, there is no other agent that has promoted a clinically meaningful prolongation of overall survival. Studies have indicated that a single inhibition of signaling pathway or single chemotherapy is not sufficient to effectively kill pancreatic cancer cells, while the combination of two or more signaling pathways and chemotherapy can reduce the number of pancreatic cancer cells to almost undetectable levels.3, 6–8 Thus, novel therapy strategies to treat pancreatic cancer are still to be proposed, and there is a critical need for the development of novel therapeutic agents to improve the treatment of this disease.
Triptolide (TPL, Fig. S1A in the Supporting Information) and celastrol (CL, Fig. S1B in the Supporting Information), two principal bioactive compounds derived from traditional Chinese herb Thunder God Vine, have attracted immense attention due to their unique chemical structures and broad range of bioactivities, particularly their anticancer activities.9–11 TPL has been shown to effectively induce cell cycle arrest and apoptosis in various types of cancers including pancreatic cancer, breast cancer, melanoma and lung cancer.12–15 It could effectively decrease the viability of pancreatic cancer cells in vitro and reduce the growth and metastases of tumors in vivo.9, 12, 16 Celastrol can suppress the invasion of pancreatic cancer cells by downregulating the expression of CXCR4 chemokine receptor.17 However, owing to their poor water solubility and severe toxicity, TPL and CL cannot be used systemically in the clinic. Therefore, there is an urgent need to develop alternative TPL and CL formulations for clinical use.
Combination therapy is the routine strategy of cancer chemotherapy with significant advantages including lower treatment failure rate and slower development of drug resistance. TPL can sensitize cancer cell lines to several chemotherapeutic drugs, such as cisplatin, adriamycin, temozolomide, and TRAIL in both in vivo and in vitro settings.13–16 CL also shows synergistic anticancer effects in combination with several chemotherapeutic agents on suppressing the proliferation of various cancers including pancreatic cancer, melanoma, lung cancer and breast cancer. 17–20 Combination of low doses of TPL and CL can induce significant pancreatic cancer cell death compared to treatment with either drug alone.21 Therefore, TPL and CL combination is a viable strategy to enable effective treatment of pancreatic cancer. However, there are still some critical issues that remain to be solved during combination treatment. There is a lack of defined optimal dose and schedule of administration. Administration of multiple drugs in free solution at normal therapeutic doses often results in increased normal tissue toxicity.22
Nanocarrier-based drug delivery systems, nanoparticles in particular, have generated great excitement in the field of drug delivery since they provide advantages over the administration of free drugs, including targeting ability to enhance accumulation at tumor sites, overcoming resistance by intracellular drug delivery, and realizing controlled and sustained release to enhance drug bioavailability.23–26 Well-designed nanoparticles can also alter the pharmacokinetics and toxicity profiles of the free drug combination, enable drug accumulation in the tumor and release the drugs at a synchronized rate, thereby maintaining synergistic drug ratios to achieve enhanced anticancer effects. Silk fibroin (SF) protein, a natural product regenerated from silkworm cocoons, possesses several unique properties including biocompatibility, tunable biodegradation, stabilizing effects, water-based processing and diverse material formats, making it a potential material for incorporation into a variety of drug delivery vehicles capable of delivering a range of therapeutic agents.27–29 SF-based nanoparticles (SFNPs) have been shown to successfully deliver anticancer drugs, including small molecules and biomolecules.29–32
In this study, we developed and characterized TPL-loaded silk fibroin nanoparticles (TPL-SFNPs) and CL-loaded silk fibroin nanoparticles (CL-SFNPs) separately, which not only over-came the pitfall of hydrophobicity, but also facilitated passive accumulation of TPL and CL in cancerous tissues based on the enhanced permeability and retention (EPR) effect as well as optimal dose and schedule of administration. Formulation and characterization of TPL-SFNPs and CL-SFNPs followed by optimization of the process of drug loaded SFNPs in terms of particle size, encapsulation efficiency and drug loading were evaluated. Shape and dispersity were evaluated using TEM. The time dependent cumulative drug release of CL in different pH media from SF nanoparticles using HPLC was performed. Evaluation of the biocompatibility of the silk fibroin nanoparticles (SFNPs) using hemolytic assay was conducted using mice blood in vitro. The cellular uptake behavior of SF nanoparticles was investigated in MIA PaCA-2 and PANC-1 cells with Rhodamine-B-Isothiocyanate (RITC) as the fluorescent probe confirmed by confocal microscopy and flow cytometer. The superiority of the combined regimen of CL-SFNPs mixed with TPL-SFNPs was demonstrated by anti-proliferation and cell apoptosis detection in human pancreatic cancer cell lines, MIA PaCA-2 and PANC-1.
2. Materials and methods
2.1 Materials
TPL and CL were purchased from Chengdu Biopurify Phytochemicals Ltd. (Chengdu, China). Cocoons were kindly supplied by Tongxiang mulberry silk base of Zhejiang Province (Tongxiang, China). Dialysis membrane with a cut off of 7,000 Da (MWCO) was obtained from Viskase Companies, Inc. (Chicago, USA). Hoechst 33342 and 3-[4, 5-dimethylthiazol-2-yl]-2, 5-diphenyltetrazolium bromide (MTT) were obtained from Sigma-Aldrich (St. Louis, MO, USA). RITC and Annexin V-FITC apoptosis detection kits were supplied by Sigma Chemicals (St. Louis, MO, USA). HPLC grade acetonitrile and methanol were obtained from BDH Chemicals (Gibbstown, NJ, USA). Other chemicals used in this study were all analytical pure grade and used as received. Ethanol, acetone and other chemicals used in this study were acquired from VWR international (Darmstadt, Germany) unless specified otherwise.
Dulbecco’s modified Eagle’s medium (DMEM) and fetal bovine serum (FBS) were purchased from Gibco BRL (Carlsbad, CA, USA). Penicillin–streptomycin, 0.25% trypsin-EDTA and non-essential amino acids were obtained from Invitrogen Co. (Carlsbad, CA, USA). Human pancreatic cancer cells MIA PaCa-2 and Panc-1 cells were generous gifts from Dr. Prabhu’s lab, originally obtained from American Type Culture Collection (Rockville, MD, USA).
2.2 Regenerated silk fibroin preparation, purification and molecular weight
The regenerated SF protein solution was prepared as previously reported with minor modification33. Briefly, the purchased B. mori cocoons were cut into small pieces and degummed twice in 0.02 M Na2CO3 for 30 min each and thoroughly rinsed with deionized water. After air-drying, the degummed SF was dissolved in a ternary system, CaCl2-CH3CH2OH-H2O (1:2:8, mole ratio), under constant stirring at 75 °C for 2 h, 4 h and 8 h. Furthermore, the resulting SF solution was centrifuged at 4000 rpm for 5 min. The supernatant was collected carefully and dialyzed in Viskase dialysis membrane (MWCO 7 000 Da) against deionized water for 3 days to remove salts and ethanol. After centrifugation at 14000 rpm for 15 min, the concentration of prepared silk fibroin solution was determined using NanoDrop™ 2000/2000c spectrophotometers. The molecular weight range of SF extracted was investigated by SDS-PAGE with 8% separation gel and 5% condensing gel, followed by staining with Coomassie brilliant blue R-250.34 The silk fibroin solution was stored at 4 °C for further use.
2.3 Silk fibroin protein nanoparticles
2.3.1 Fabrication of silk fibroin protein nanoparticles
TPL-SFNPs and CL-SFNPs were formulated using a modified desolvation technique. 35, 36 Typically, TPL and CL were dissolved in a mixture of acetone:ethanol (3:2, v/v) individually at a certain concentration, and the prepared TPL or CL solution was added into SF solution dropwise under gentle constant stirring. The resulting suspension was incubated in a refrigerator at −20 °C for 16 h and defrosted quickly in warm water (40 °C). The suspension was subsequently centrifuged at 14000 rpm for 15 min and washed three times with deionized water to collect the nanoparticles. Finally, the purified nanoparticles were suspended in deionized water using an ultrasound processor at 10% amplitude for 2 min with an ultrasonic cell disruptor to disperse the clustered silk spheres, followed by lyophilization with 5% (w/v) trehalose as the cryoprotectant. The prepared freeze-dried nanoparticle formulations are stored at 2–8 °C.
The Rhodamine-B-Isothiocyanate (RTIC)-loaded SFNPs (RITC-SFNPs) were prepared by the same method, and blank SFNPs (Blank-SFNPs) were prepared according to the above mentioned method but omitting the TPL and CL.
2.3.2 Experimental design for formulation optimization
Taguchi’s L9 orthogonal array experimental design was used to optimize the formulation parameters of TPL-SFNPs and CL-SFNPs. A 3-factor, 3-level design was employed for studying the interaction and quadratic effects of the formulation variables. The initial concentrations of SF, TPL and CL and volume ratio of organic/SF solution for formulation optimization were selected based on preliminary experiments (data not shown). The three factors and their levels selected for formulation optimization are shown in Table S1. A Design-Expert® (Version 10.1, Stat-Ease Inc., USA) software was used for analyzing the results.
2.4 Nanoparticle characterization
2.4.1 Particle size, zeta potential and morphology
Freeze-dried SFNPs (Blank-SFNPs, TPL-SFNPs, CL-SFNPs) were dispersed in deionized water (pH 7.0). Average size and zeta potential of SFNPs were measured by a dynamic light-scattering detector (Nanobrook Omni, Brookhaven Instrument Corp, USA). All measurements were performed at room temperature in triplicate. The morphological examination of SF and SFNPs was conducted via transmission electron microscopy (TEM, JEOL JEM-1230, Japan).
2.4.2 Infrared spectra IR absorption and β-sheet content
The FTIR spectra of Blank-SFNPs, drug-loaded SFNPs, as well as free drug were obtained via a Fourier transform infrared spectrophotometer (FTIR, Varian, USA). Lyophilized, regenerated SF was also examined. For each measurement, the spectra were generated from 32 scans with a resolution of 4 cm−1. The β-sheet content of SF in SFNPs or regenerated SF was obtained by deconvolution of amide I band using PeakFit 4.12 software.36, 37
2.4.3 Drug loading capacity and encapsulation efficiency
The encapsulation efficiency and drug loading capacity of TPL-SFNPs and CL-SFNPs were analyzed by Agilent 1050 HPLC (Agilent Technologies, Palo Alto, CA, USA). Analyses were performed at 25 °C using a C18 column (250 mm × 4.6 mm, 5 μm, Agilent Technologies, USA). Methanol:water (58:42, v/v) and methanol:water (90:10, v/v) were used as mobile phases for TPL and CL, respectively, at a flow rate of 1 mL/min. The detection wavelengths were 218 nm and 430 nm, respectively.
Encapsulation efficiency (EE) and drug loading (DL) of nanoparticles were calculated according to equations (1) and (2):
| (1) |
| (2) |
2.4.4 In vitro drug release
The cumulative release kinetics of TPL and CL from SFNPs were determined in phosphate buffered saline (PBS), at pH 7.4 and pH 5, respectively. Equal amount of SFNPs was suspended in PBS and separated in capped glass bottles, followed by an incubator at 37 °C with a shaking speed of 120 strokes/min. At predetermined time intervals (1, 4, 8, 24, 48, 72, 120 and 168 h), three glass bottles of each formulation were withdrawn and drug release was monitored by separating nanoparticles and release media via centrifugation (14000 rpm, 15 min) repeated three times. The amounts of residual TPL or CL in the nanoparticles were determined by HPLC using the same procedure as described above. The profile that shows the cumulative drug release as a function of time was plotted.
2.5 In vitro hemolysis assay
The hemolysis assay was performed on SFNPs in vitro. In brief, 0.2 mL of 3.8% sodium citrate was mixed with 4 mL of fresh mouse blood, followed by gentle centrifugation at 3,000 rpm for 10 min; the sediment was collected and washed 3 times by suspending it in PBS (pH 7.4) at 37 °C to get the final 5% (v/v) RCBs suspension. Furthermore, 10 mg/mL of suspended NPs (Blank-SFNPs, TPL-SFNPs and CL-SFNPs) in PBS were incubated with RBCs for 2 h at room temperature. Moreover, 0.1% Triton X-100 and PBS in RBCs solution were used as positive and negative control, respectively. Subsequently, samples were centrifuged for 5 min, and 100 μL supernatants were collected carefully and transferred to a 96-well plate to enable the quantification of hemoglobin by a micro plate reader (μQuant™, BioTek® Instruments, Inc.). The percentage of hemolysis was calculated according to the following equation:
2.6 Cell culture
The pancreatic cancer cells PACA-2, PANC-1, HEK 293 and HGF-1 were cultivated in monolayers to 70–80% confluence in DMEM or EMEM medium supplemented with 10% fetal bovine serum at 37 °C in a humidified environment of 5% CO2. The medium was replenished every other day, and the cells were sub cultured after reaching confluence.
2.7 In vitro cellular uptake
2.7.1 Intracellular localization imaging by confocal microscopy
To investigate cellular uptake of SFNPs, 5×10⁴ cells/well MIA PaCa-2 and PANC-1 cells were seeded onto sterilized microscope cover slips placed in 6-well plates and incubated overnight in DMEM medium supplemented with 10% fetal bovine serum at 37°C with 5% CO2. Seeded cells were then treated with free RTIC and RTIC-SFNPs (equaled to 0.5 μM in medium) and incubated for 5 min, 30 min and 60 min (untreated cells were used as control). Subsequently, the cells were washed three times with PBS, followed by fixation with 4% p-formaldehyde for 15 min and washed three times again with PBS. Hoechst 33342 was used to stain the nuclei of the cells; furthermore, the cells were washed three times with PBS and imaged using Leica TCS SP2 confocal microscopy, and the images were analyzed by Leica confocal software.
2.7.2 Cellular uptake determined by flow cytometry
Flow cytometry analysis was performed to quantify the cellular uptake of SFNPs in MIA PACA-2 and PANC-1. Briefly, 5 × 10⁴ cells/well were seeded in 12-well plates and incubated for 24 h. The culture medium was then replaced by free RTIC and RTIC-SFNPs (equaled to 0.5 μM in medium), incubated for 5 min, 30 min and 60 min and washed twice with warm (37 °C) Dulbecco’s Phosphate-Buffered Saline (D-PBS). Thereafter, cells were detached using trypsin and washed with ice-cold D-PBS. Finally, cells were re-suspended in 500 μL of ice-cold D-PBS and kept on ice in dark for 10 min. The samples were analyzed by BD Accuri™ C6 flow cytometer (BD Biosciences, San Jose, CA, USA).
2.8 Cell cytotoxicity studies by MTS assay
To evaluate the cytotoxicity of Blank-SFNPs in vitro, 5×10³ cells/well of MIA PaCa-2 and PANC-1 cells, 6×10³ cells/well of HEK 293 and HGF-1 cells were seeded in 96-well plates and incubated for 24 h before being treated with Blank-SFNPs. To evaluate the cell viability, MIA PaCa-2 and PANC-1 cells were treated with various concentrations of TPL, CL, TPL-SFNPs and CL-SFNPs.
After incubation for 72 h, the growth medium was removed, followed by addition of 100 μl serum-free culture medium containing 20% MTS and 1% of phenazine methosulfate (PMS) and further incubated for 1 h. The absorbance of each well was measured by micro plate reader at 490 nm. Viability of untreated cells was set at 100%, and absorbance of wells with medium and without cells was set as zero. IC50 values were analyzed by Prism software (San Diego, CA). Each experiment was performed at least three times.
2.9 Clonogenic assay
Clonogenic assay was used to determine the growth inhibition of pancreatic cancer cells by TPL-SFNPs and CL-SFNPs. Furthermore, 1×10³ MIA PaCa-2 and PANC-1 cells/well were seeded in 6-well plates. On the third day, cells were treated with different concentrations of CL and CL-SFNPs (CCL: 0.05–0.45 μM) and TPL and TPL-SFNPs (CTPL: 0.3–3.0 nM) and incubated for 4 days. The media was then replaced with fresh media and maintained for another 7 days. Cells were fixed with ice-cold mixture of methanol and acetic acid (3:1, v/v) and incubated for 15 min. Furthermore, colonies were stained with 0.5% crystal violet. Colonies with more than 50 cells were counted manually under a microscope and the data were analyzed using Graph Pad Prism software. Untreated cells were considered as controls.
2.10 Determination of combination index value
To evaluate the combination effect of TPL and CL and TPL-SFNPs and CL-SFNPs, pre-incubated MIA PaCa-2 and PANC-1 cells were co-treated with various concentrations of drug and drug-loaded SFNPs for 72 h. The experiment was designed as constant combination ratio based on the suggestion of CompuSyn software and the IC50 values obtained in section 2.8 (Table S2). In addition, the cell viability was determined by the same MTS assay method described in section 2.8 and analyzed by CompuSyn software, which follows the median effect principle to identify the combination index (CI) value. The equation to calculate the combination index is CI = (D)1/(Dx)1 + (D)2/(Dx)2, where (Dx)1 and (Dx)2 indicate the individual dose of either free drugs or drug loaded SFNPs required to inhibit a given level of cell growth, and (D)1and (D)2 are the doses of free drugs and drug loaded SFNPs necessary to produce the equal effect in combination, respectively.38–40 Combination index (CI) value <1, =1 and >1 indicate synergism, additive effect and antagonism, respectively.
2.11 Apoptosis assay
Apoptosis assay was performed using the Annexin V-FITC Apoptosis Detection Kit according to the manufacturer’s protocol supplied by Sigma Chemicals (St. Louis, MO, USA). 5×10⁴ MIA PaCa-2 and PANC-1 cells were pre-incubated in 24 well plates and incubated for 24 h, and treated with TPL (4.5 nM), CL (0.5 μM), TPL+CL, and TPL-SFNPs, CL-SFNPs, TPL-SFNPs + CL-SFNPs loading the same amount of TPL and CL for 48 h. Afterwards, the cells were washed twice with ice-cold PBS, trypsinized, centrifuged and then re-suspended in cold binding buffer. A total of 500 μl of this cell suspension was then subjected to the addition of 5 μl of Annexin V FITC and 10 μl of propidium iodide solution, followed by incubation on ice in the dark for 10 min. After incubation, the cell samples were analyzed by flow cytometer immediately. The tests were carried out in triplicate.
2.12 Statistical analysis
GraphPad Prism software (La Jolla, CA) was used for statistical analysis and plotting. The data were presented as mean ± standard deviation. Statistical significance was determined using the one-way ANOVA or two-way ANOVA, followed by Tukey’s test, where p-value of ≤0.05 was considered statistically significant.
3. Results
3.1 Regenerated silk fibroin
SF is a biomacromolecule consisting of 5509 amino acids and composed of a heavy chain (391 kDa) and a light chain (26 kDa). It has been reported that SF molecules undergo hydrolysis during degumming procedure.41 Similarly, in our study, SDS-PAGE showed that the regenerated SF was a mixture of polypeptides with a wide molecular distribution (Fig. 2S).
3.2 Experimental design for formulation optimization
The formulation parameters of TPL-SFNPs and CL-SFNPs were optimized using Taguchi’s L9 orthogonal array experimental design (three-factor, three-level). The responses selected for experimental design are shown in Table S3. A numerical desirability function was used to select the optimized formuation from the experimental design.42 The significance of the experimental model used in formulation optimization of TPL-SFNPs and CL-SFNPs was validated by comparing the predicted values with experimental values (Table S4). The results from the optimization study indicate that the particle size, EE and DL of TPL-SFNPs and CL-SFNPs are comparable to the predicted values demonstrating the accuracy and validity of the model used in the experimental design.
3.3 Nanoparticle characterization
3.3.1 Particle size, zeta potential and morphology
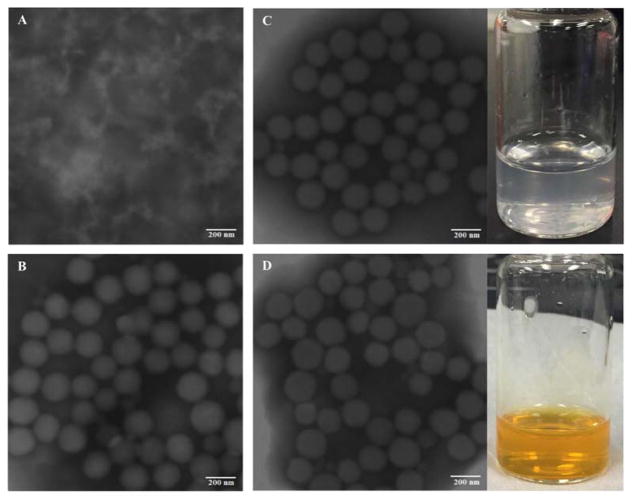
As shown in the TEM images in Fig. 1, the SFNPs are spherical in shape and monodisperse. The observed particle sizes of SFNPs were around 100 nm, smaller than those measured by DLS, which indicated that the particle sizes of TPL-SFNPs and CL-SFNPs were 166.4 ± 4.6 nm ((PDI<0.3) and 170.4 ± 2.3 nm (PDI<0.3)), respectively (Table 1). This was mainly due to the dehydration process that led to the shrinkage of the particles in the preparation of TEM samples. TPL-SFNPs and CL-SFNPs have a mean zeta potential of −27.2 ± 2.0 mV and −25.5 ± 2.57, respectively (Table 1).
Fig. 1. Characterization of SF and SFNPs.
A. TEM image of SF. B. TEM image of Blank-SFNPs. C. TEM image and photograph of TPL-SFNPs formulation. D. TEM image and photograph of CL-SFNPs formulation. Scale bar 200 nm.
Table 1.
Particle size, zeta potential, encapsulation efficiency, drug loading and β-sheet content of SF, SFNPs, TPL-SFNPs, CL-SFNPs (n=3)
| Sample | Particle size (nm ± s.d) | Zeta Potential (mV ± s.d) | EE (% ± s.d) | DL (μg/mg ± s.d) | β-sheet content |
|---|---|---|---|---|---|
| SF | - | - | - | - | 16.8 |
| SFNPs | 201.0 ± 5.1 | −21.1 ± 3.3 | - | - | 35.3 |
| TPL-SFNPs | 166.4 ± 4.6 | −27.2 ± 2.0 | 81.8 ± 2.8 | 57.7 ± 4.7 | 57.7 |
| CL-SFNPs | 170.4 ± 2.3 | −25.5 ± 2.6 | 87.0 ± 1.1 | 63.5 ± 3.8 | 77.6 |
Novel combination of triptolide and celastrol loaded silk fibroin nanoparticles show synergistic anti-pancreatic cancer effect in vitro
3.3.2 IR absorption and β-sheet content
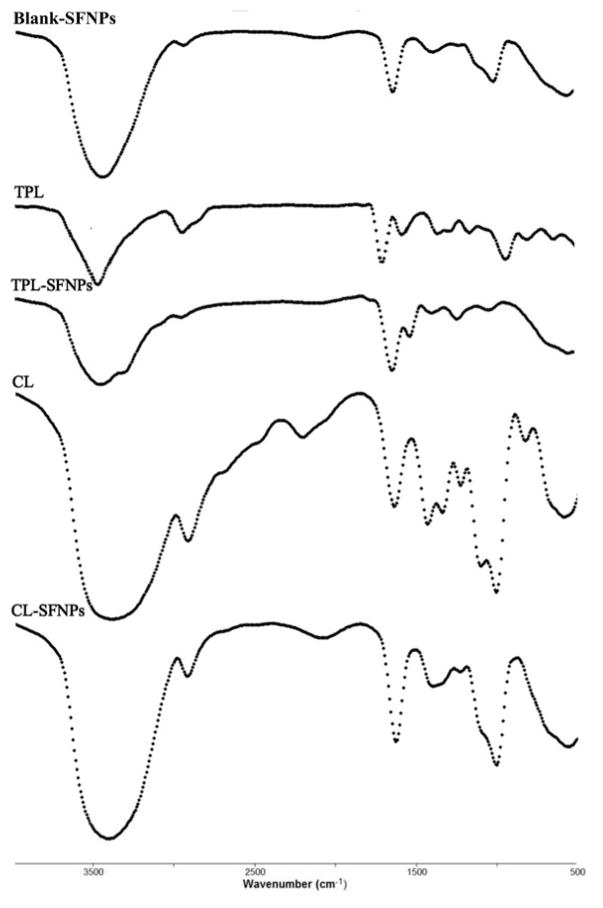
FTIR spectra of TPL, CL, TPL-SFNPs, CL-SFNPs, SF and SFNPs, are shown in Fig. 2. TPL-SFNPs and CL-SFNPs exhibit characteristic absorption peaks at 1735 cm−1 and 1500 cm−1 of TPL and CL which confirms the successful encapsulation of drug into SFNPs. 36, 43, 44 It is found that the β-sheet content in SF is about 16.8%, but it increases to 35.3% in the SFNPs. Moreover, the β-sheet content in TPL-SFNPs and CL-SFNPs increases to 57.7% and 77.6% in the presence of TPL and CL (Table 1, Fig. S3). This means that TPL and CL addition is also favorable for the conformation transition of SF from random coil/helix to β-sheet probably because of the hydrophobic interactions between TPL, CL and SF macromolecules. Furthermore, the increased β-sheet formation induced by TPL or CL may benefit their encapsulation in the SFNPs leading to slow drug release in later applications.40
Fig. 2.
FTIR spectra of Blank-SFNPs, TPL, TPL-SFNPs, CL and CL-SFNPs
3.3.3 Drug loading capacity and encapsulation efficiency
Drug loading capacity (DL) and encapsulation efficiency (EE) play a critical role in drug delivery. To obtain high drug loading and meet the therapeutic needs, we used the optimized formulations to prepare SFNPs. The prepared TPL-SFNPs and CL-SFNPs have a satisfactory DL of 57.0 ± 4.7 μg/mg and 63.5 ± 3.8 μg/mg, along with an EE of 81.8 ± 2.8% and 87.0 ± 5.1%, respectively (Table 1).
3.4 In vitro drug release profile
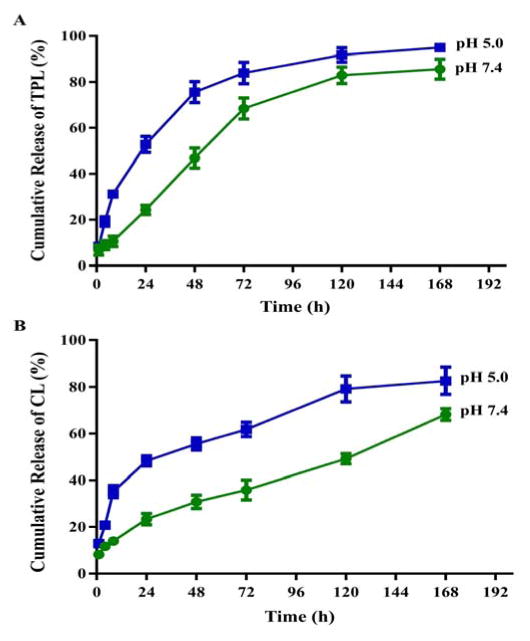
Cumulative drug release from TPL-SFNPs and CL-SFNPs were studied at two different pH conditions; at pH 7.4, which is comparable to the extracellular physiological pH of normal cells and pH 5, the lysosomal pH of cancer cells. As shown in Fig. 3A & 3B, both drugs were gradually released from the nanoparticles at pH 7.4 indicating that encapsulation of the drug in SFNPs may significantly prolong the release in plasma. However, at pH 5, the release was significantly faster throughout the early time points (1 to 24 h) and the 7-day release period. The cumulative TPL and CL release was approximately 53% and 55% within 24 h and a total 95% and 80% in 7 days at pH 5 which showed significantly faster release pattern in comparison to 82% and 65% in pH 7.4 in 7 days, indicating that SFNPs could serve as a lysosomotropic delivery platform for drugs.
Fig. 3.
The cumulative release profiles of TPL from TPL-SFNPs (A) and CL from CL-SFNPs (B) in PBS of pH=7.4 and pH=5.0 at 37 °C.
3.5 Safety evaluation of Blank-SFNPs and drug loaded SFNPs
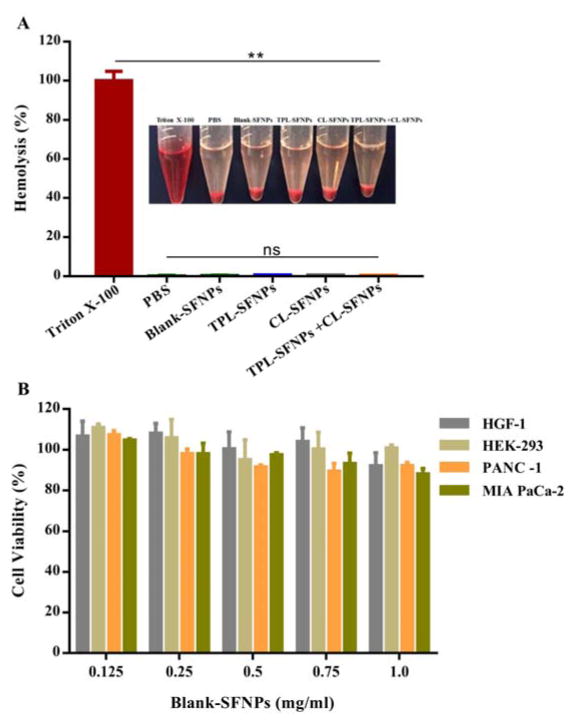
Hemolytic test was performed on Blank-SFNPs and drug loaded SFNPs. As shown in Fig. 4A, compared to positive control Triton X-100 that showed the highest toxicity, breaking 100% of RBCs present in solution, almost no hemolysis was observed when treated with PBS as negative control. Similar to PBS, Blank-SFNPs and drug loaded SFNPs at the high concentrations of 10 mg/mL did not cause any hemolysis on mouse erythrocytes.
Fig. 4. Safety evaluation of Blank-SFNPs, TPL-SFNPs and CL-SFNPs.
A. Biocompatibility of TPL-SFNPs, CL-SFNPs and their combination in fresh mouse blood. Triton X-100 and PBS were used as positive control and negative control, respectively. B. Cytotoxicity of Blank-SFNPs in MIA PaCa-2, PANC-1, HEK-293 and HGF-1 cell line using MTS assay. (Mean ± SD, n = 5; ns: no significance, *: P<0.05, **: P<0.01)
To study the cytotoxicity, Blank-SFNPs at a concentration of 0.125 to 1 mg/mL were used to detect aggregation and sedimentation that could potentially result in cell toxicity. The study results showed no significant inhibition of pancreatic cancer cells, MIA PaCa-2, PANC-1, normal cells, HEK293 and HGF-1 (Fig. 4B), indicating that Blank-SFNPs alone do not contribute to any quantifiable toxicity in the studied concentration. The study demonstrates high safety and biocompatibility of the Blank-SFNPs in vitro.
3.6 In vitro cellular uptake
3.6.1 Intracellular localization of nanoparticles
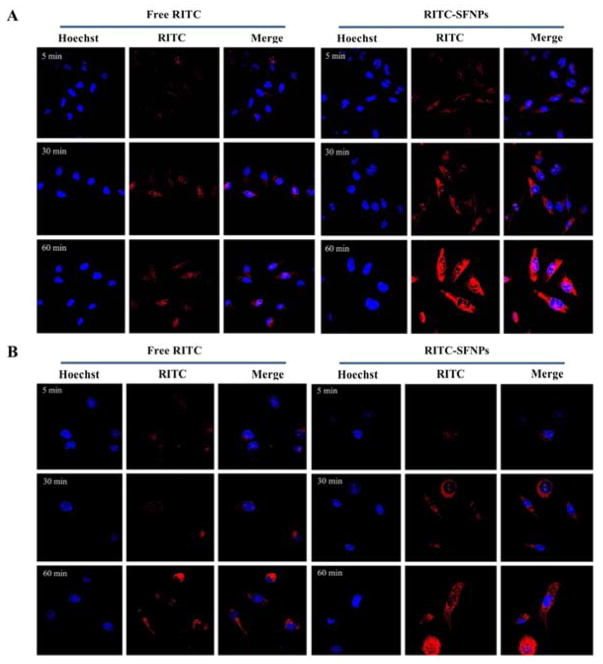
To study the uptake, PANC-1 and MIA PaCa-2 cancer cells were exposed to RITC-SFNPs for 5, 30 and 60 min. RITC-SFNPs are efficiently taken up by both cell lines in a time dependent manner and are predominately distributed in the cytoplasm or perinuclear region following 60 min of incubation (Fig 5A & 5B). The RITC-SFNPs internalized more rapidly and significantly compared to free RITC at 30 and 60 min, indicating that drug encapsulated in SFNPs could be efficiently taken up by cancer cells enabling consistent intracellular release of the loaded drug. The nanoparticle internalization process into the cells can be considered as a binding (adsorbing) process, wherein the formed nanoparticles are internalized by endocytosis.41, 43 Once the nanoparticles were endocytosed, they were found preliminarily in the cytoplasm around the nuclear membrane. We found that a large fraction of the incubated nanoparticles was internalized by the cells and remained stable during vesicular transport despite their negative surface. We also observed that both cell lines remain viable during the study, supporting our previous results that silk fibroin nanoparticle alone did not result in any measurable toxicity.44
Fig. 5. Cellular uptake analysis of RITC-SFNPs using confocal laser scanning microscopy, free RITC was used as control.
A. MIA PaCa-2, with an incubation time of 5 min, 30 min and 60 min. B. PANC-1, with an incubation time of 5 min, 30 min and 60 min. Original magnification: ×40.
3.6.2 Cellular uptake determined by flow cytometry (FCM)
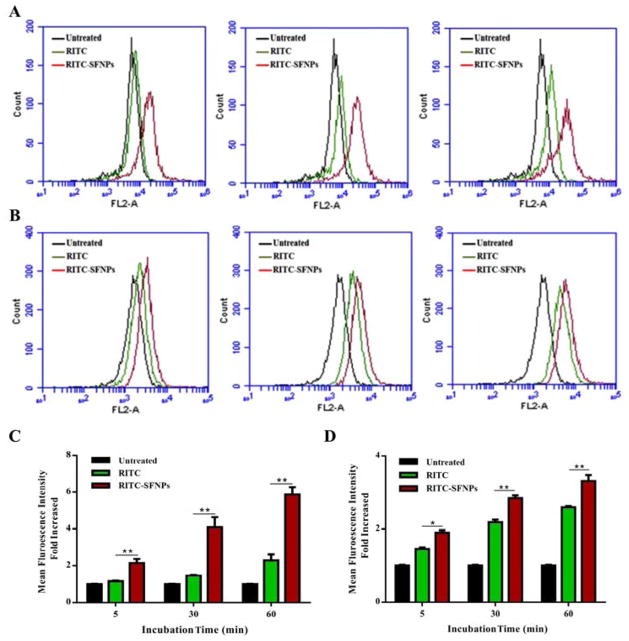
The cellular uptake of RITC-SFNPs is quantitatively evaluated and depicted in Fig. 6A & 6B. The results show that RITC-SFNPs exhibited significantly high fluorescence intensity compared to the free RITC following incubation with PANC-1 cells for 5, 30 and 60 min, and about two-fold increase of fluorescence intensity was observed with RITC-SFNPs compared to free RITC (Fig. 6B). On the contrary, RITC-SFNPs incubated with MIA PaCa-2 cells also indicated significant difference in fluorescence intensity compared to free RITC treatment cells (Fig. 6A). However, the intensity was not as prominent as seen in PANC-1 cell line.
Fig. 6. Quantification of cellular uptake of SFNPs. Uptake analysis of RITC-SFNPs using flow cytometry. Untreated cells and the cells treated with free RITC were used as negative control and positive controls respectively.
A. MIA PaCa-2, with an incubation time of 5 min, 30 min, and 60 min. B. PANC-1, with an incubation time of 5 min, 30 min and 60 min. (Mean ± SD, n = 5; *: P<0.05, **: P<0.01)
3.7 Cytotoxicity of drug-loaded SFNPs
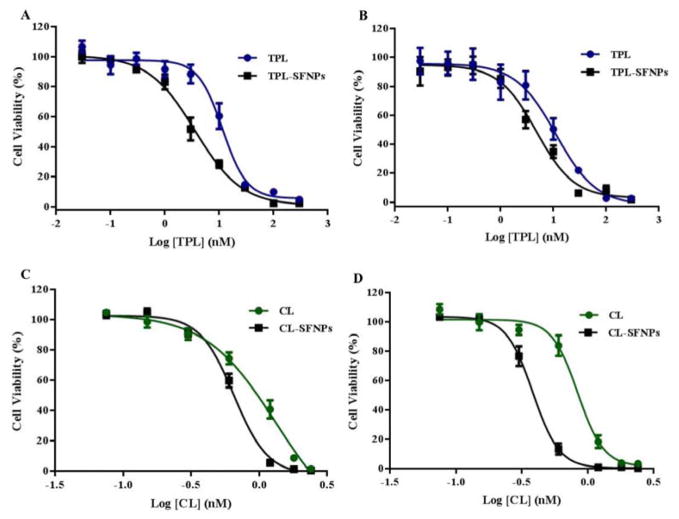
To study the efficacy of CL-SFNPs and TPL-SFNPs on cancer cells, the inhibitory concentration (IC50) values of the free drug and SFNPs were compared by MTS assay. The cell viability studies of CL-SFNPs and TPL-SFNPs are presented in Fig. 7A–7D, respectively. Both free drug and SFNPs exhibited dose dependent decrease in the proliferation of pancreatic cancer cells. However, it was observed that the SFNPs exhibited lower IC50 values in comparison to the free drug for both TPC and CL drugs, demonstrating higher efficacy with SFNPs. In case of MIA PaCa-2 cells, free TPL exhibited IC50 value of 11.58 μM. However, for TPL-SFNPs, the IC50 value was significantly reduced to 3.8 μM, showing approximately three-fold reduction compared to the free drug (Fig. 7A). Similarly, for PANC-1 cells, the IC50 values obtained for free TPL and TPL-SFNPs were 11.25 μM and 4.57 μM, respectively (Fig. 7B). Similar trend was observed with CL-SFNPs. The viability study for free CL with MIA PaCa-2 cells, exhibited IC50 value of 1.32 μM and for CL-SFNPs, the IC50 value was reduced to 0.65 μM, showing approximately two-fold reduction compared to the free form of the drug (Fig. 7C). Similarly, for PANC-1 cells, the IC50 values obtained for free CL and CL-SFNPs were 0.83 μM and 0.38 μM, respectively (Fig. 7D). Therefore, our results demonstrate that the drugs, when encapsulated in SFNPs, exhibited cytotoxicity at lower concentrations compared to the free drug.
Fig. 7. Dose dependent inhibition of cell viability and IC50 determination in MIA PaCa-2 and PANC-1 cell line treated with TPL, TPL-SFNPs, CL & CL-SFNPs using MTS assay.
A. IC50 profile of TPL and TPL-SFNPs in MIA PaCa-2 cell line. B. IC50 profile of TPL and TPL-SFNPs in PANC-1 cell line. C. IC50 profile of CL and CL-SFNPs in MIA PaCa-2 cell line. D. IC50 profile of CL and CL-SFNPs in PANC-1 cell line.
3.8 Inhibition of colony formation
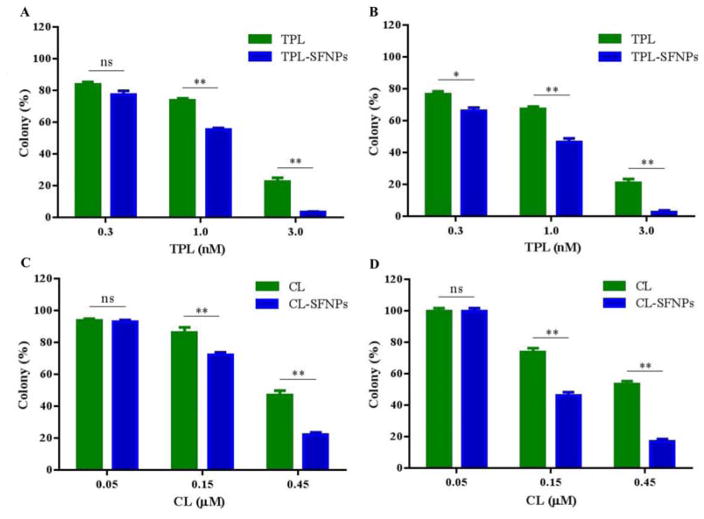
Clonogenic assay or colony formation assay is an in vitro cell survival assay based on the ability of a single cell to grow into a colony. Clonogenic assay was performed to determine the anti-cancer activity of the free drug, SFNPs of TPL and CL through cell growth inhibition. In this study, the untreated MIA PaCa-2 and PANC-1 cell lines produced large colonies while the treated cells with free drug and SFNPs showed a dose dependent inhibition of colony formation. The SFNP formulations of TPL and CL showed higher inhibition of colony formation at 0.15 and 0.45 μM concentrations, compared to free TPL and CL (Fig. 8A, 8C & 8B, 8D), respectively at equivalent doses. At 0.15 μM concentration, TPL-SFNPs and CL-SFNPs showed significant reduction in colony formation in MIA PaCa-2 and PANC-1 cancer cells compared to free TPL and CL. Similarly, TPL-SFNPs and CL-SFNPs are also more effective at the 0.45 μM concentrations compared to free TPL and CL, indicating superior anticancer activity after incorporation of TPL and CL into SFNPs. We also observed that PANC-1 cells are more sensitive to CL-SFNP. At a dose of 0.45 μM, colony formation is inhibited by 90% compared to 70% in MIA PaCa-2 cell line. However, both cell lines are sensitive to TPL-SFNPs, and about 95% colony formation is inhibited at 3.0 nM dose (Fig. 8B & 8D). In summary, the rapid internalization and sustained release of CL and TPL from nanoparticles may substantially improve anticancer effects of celastrol and triptolide at the same dose.
Fig. 8. Dose dependent colony formation inhibition of MIA PaCa-2 and PANC-1 cell line treated with different drugs.
A. Colony formation inhibition of TPL and TPL-SFNPs in MIA PaCa-2 cell line. B. Colony formation inhibition of TPL and TPL-SFNPs in PANC-1 cell line. C. Colony formation inhibition of CL and CL-SFNPs in MIA PaCa-2 cell line. D. Colony formation inhibition of CL and CL-SFNPs in PANC-1 cell line. (Mean ± SD, n = 3; ns: no significance, *: P<0.05, **: P<0.01)
3.9 Synergistic effect of TPL-SFNPs and CL-SFNPs
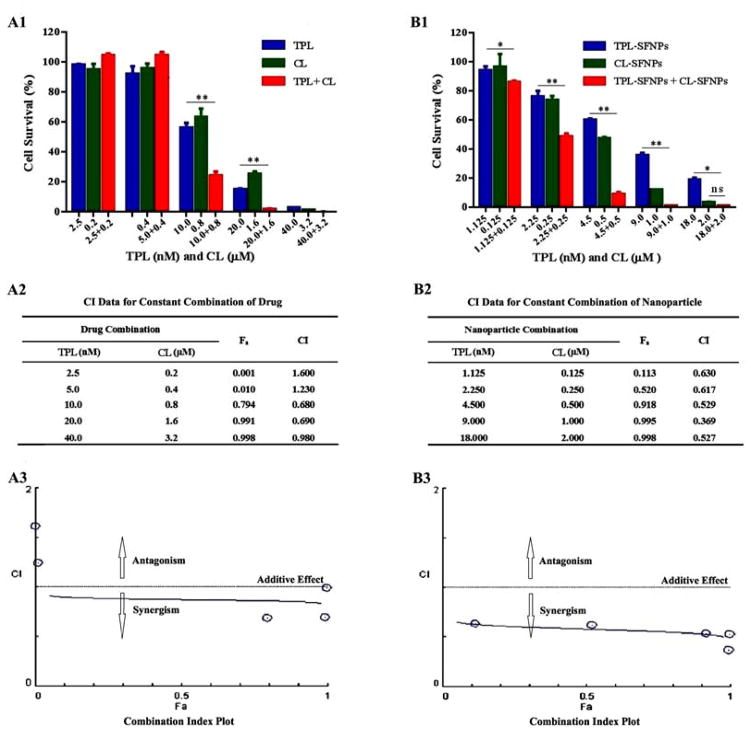
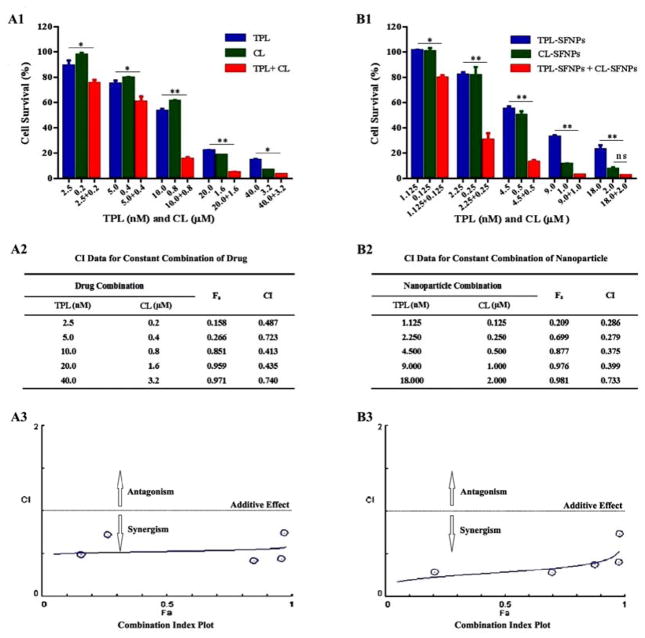
MTS assay was performed to study the combination effects of TPL and CL or TPL-SFNPs and CL-SFNPs on MIA PaCa-2 and PANC-1 cell lines. After determining the dose response curves individually and obtaining the IC50 value for each of them, a range of drug combination concentrations were selected to evaluate the inhibition of growth using the drug combination. We found that cell viability decreased significantly for both cell lines when co-treated with free TPL (10 and 20 nM) and CL (0.8 and 1.6 μM) in comparison with individual treatment (Fig. 9A1 & 9B1, Fig. 10A1 & 10B1). The CI value was found to be above 0.5 (Fig. 9A2 & 9A3, Fig. 10A2 & 10A3) indicating that free drug combination of TPL and CL may inhibit the pancreatic cancer cell growth synergistically at certain concentrations. Further, we found that cell viability was reduced significantly when co-treated with different nanoparticle combination doses for both cell lines. After being co-treated with TPL-SFNPs at TPL concentrations of 2.25, 4.5 and 9 nM and CL-SFNPs at CL concentrations of 0.25, 0.5 and 1 μM, respectively, the survival of MIA PaCa-2 cell lines reduced significantly as compared to individual treatment with TPL-SFNPs and CL-SFNPs (Fig. 9B1). The same combination nanoparticles effect was seen in PANC-1 cell line as well, even in low doses of TPL (1.125, 2.25, 4.5 and 9 nM) and CL (0.125, 0.25, 0.5 and 1μM) (Fig. 10B1). In summary, we observed that cytotoxicity increased significantly when treated with the CL-SFNPs and TPL-SFNPs combination compared to individual NPs and free drug and their combination tested against pancreatic cancer cells in vitro. Furthermore, we used the Compusyn software to identify the synergistic effect of the combination. The Compusyn software is widely used to predict the additive and synergistic effect arising from combinations of multiple drugs that have independent mechanism of action in vitro and in vivo using combination index theorem. After co-treatment with TPL-SFNPs and CL-SFNPs, the survival of cancer cells was significantly reduced in comparison with lone nanoparticle treatment. Almost all combination index values calculated by Compusyn software for nanoparticle combination study were <1 and in certain combination CI value is below 0.5, suggesting that the growth inhibition effect CL-SFNPs and TPL-SFNPs in the indicated cancer cells is synergistic rather than additive (Fig. 9B2 & 9B3, Fig. 10B2 & 10B3).
Fig. 9. Synergistic effect of TPL and CL, TPL-SFNPs and CL-SFNPs in MIA PaCa-2 cell line.
(A1) Cell viability determination and (A2) combination index (CI) value identified using Compusyn software and (A3) combination index plot of CL, TPL and in combination. (B1). Cell viability determination and (B2) combination index (CI) value identified using Compusyn software and (B3) combination index plot of TPL-SFNPs, CL-SFNPs and in combination.
Fig. 10. Synergistic effect of TPL and CL, TPL-SFNPs and CL-SFNPs in PANC-1 cell line.
(A1) Cell viability determination and (A2) combination index (CI) value identified using Compusyn software and (A3) combination index plot of CL, TPL and in combination. (B1) Cell viability determination and (B2) combination index (CI) value identified using Compusyn software and (B3) combination index plot of TPL-SFNPs, CL-SFNPs and in combination.
3.10 Apoptotic effects of TPL-SFNPs and CL-SFNPs
To investigate the apoptotic effects of TPL-SFNPs and CL-SFNPs combination on MIA PaCa-2 and PANC-1 cell lines, Annexin-V binding and PI staining assay were performed using flow cytometer.
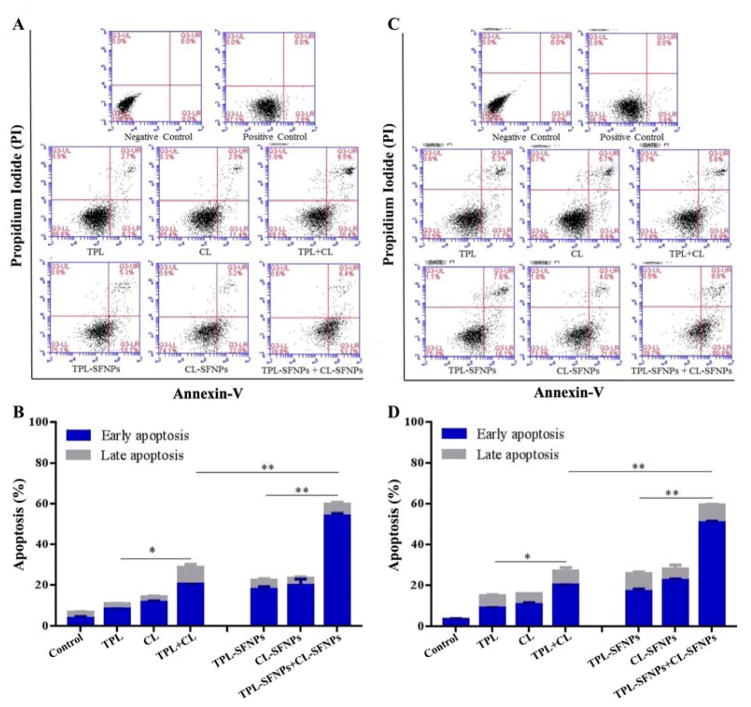
The cell lines were exposed to free drug and SFNPs of CL and TPL individually or in combination at equivalent doses of 0.5 μM and 4.5 nM, respectively for 48 h. Apoptosis assay helps distinguish and categorize the cells into four stages which are viable and healthy, early apoptosis, late apoptosis and dead (Fig. 11A–D). In MIA PaCa-2 and PANC-1 cell lines, the untreated cells showed early apoptosis of 2.7% and 3.8%, respectively (Fig. 11A & 11C). The untreated cells were incubated in the same medium and in the same environmental conditions as the treated cells. This type of apoptosis is normal for untreated cells as these cells might have experienced apoptosis because of their growth conditions. Free drug TPL and CL showed an early apoptosis of 8.2% and 11.4% and late apoptosis of 2.7% and 2.9%, respectively in MIA PaCa-2 cells, while their combination showed increased total apoptosis (30.0%) significantly indicating the synergistic effect (Fig. 11A & 11B). When TPL and CL were exposed to PANC-1 cells alone, the apoptosis observed was 17.0% and 14.0%, respectively whereas in combination, it was 25.5%. TPL-SFNPs and CL-SFNPs, individually, showed increased apoptosis compared to free CL and TPL at equivalent doses. The total apoptosis was 24.0% and 25.2%, respectively when MIA PaCA-2 cells were treated with TPL-SFNPs and CL-SFNPs individually. However, when used in combination at the same concentration, the total apoptosis of MIA PaCA-2 cells was significantly higher (58.6%) (Fig. 11A & 11B). The same trend was found in PANC-1 cells when treated with the combination (Fig. 11C & 11D). Overall this study confirmed that nanoparticle combination of TPL and CL was extremely effective in enhancing apoptosis of cancer cells and demonstrating the synergistic effect of TPL-SFNPs and CL-SFNPs combination.
Fig. 11. Apoptotic effects of CL-SFNPs and TPL-SFNPs in MIA PaCa-2 and PANC-1 cell line.
A–B. Determination of apoptosis in MIA PaCa-2 cell line after treatment with equivalent dose of CL, TPL individually and in combination and CL-SFNPs and TPL-SFNPs individually and in combination using flow cytometer. C–D. Determination of apoptosis in PANC-1cell line after treatment with equivalent doses of CL, TPL individually and in combination and CL-SFNPs and TPL-SFNPs individually and in combination using flow cytometer. (Mean ± SD, n = 3; *: P<0.05, **: P<0.01)
4. Discussion
Multidisciplinary treatment strategies are commonly used to combat pancreatic cancer. However, these remedies are often inadequate in contending the disease due to drug resistance and safety issues associated with normal healthy tissues. Diagnosis using combination drug therapy has been widely employed in clinical settings to treat the lethal diseases and attain synergistic therapeutic effect, to minimize drug toxicity and to overcome drug resistance. Triptolide and celastrol are reported to inhibit the growth of cancer cells synergistically when treated in combination both in vitro and in vivo.21 However, their use is limited because of their highly hydrophobic nature and non-selective toxicity to healthy cells. Therefore, to address these issues, triptolide and celastrol loaded silk fibroin nanoparticles were developed and evaluated for their effect on pancreatic cancer cell lines. Silk fibroin, a natural biopolymer extracted from cocoons, with proven clinical safety record, mechanical properties and biocompatibility has been used as carrier to attain targeted drug delivery of triptolide and celastrol. A modified desolvation method was used to prepare silk fibroin nanoparticles.
SFNPs were prepared using a modified process with a mixture of acetone and ethanol produced the desired particle size. The selected solvent mixture might have facilitated dehydration of silk fibroin, leading to closer chain packaging of GLY-X or nanofabrication, thereby allowing mild folding of SF polymer to generate nanoparticles of less than 200 nm in contrast to those prepared using other reported methodologies.45
The formulations were prepared systematically using a statistical experimental design and the resulting formulation variables such as size, entrapment efficiency and drug loading were systematically analyzed using Taguchi’s orthogonal array design to identify the parameters that have optimum influence on the formulation (Fig. S4 & S5).42, 45–47 The data analyzed using Design Expert® software demonstrated the reproducibility of the optimized formulation. According to previous reports, negatively charged nanoparticles have longer circulation lifetimes and less toxicity towards the cell.48, 49 The zeta potentials of TPL-SFNPs and CL-SFNPs were −27.2 ± 2.0 mV and −25.5 ± 2.57 mV, respectively, which might result in less aggregation and long circulation of SF nanoparticles in the blood. FTIR spectra showed that TPL-SFNPs and CL-SFNPs exhibit characteristic absorption peaks at 1735 cm−1 and 1500 cm−1 of TPL and CL, respectively, indicating successful encapsulation of the drug into SFNPs. TEM images suggest that the formulated SFNPs could be spherical and monodisperse.
The release study results indicate that silk fibroin nanoparticle can release the drug in a slow and sustained manner at physiological pH and releases rapidly at lower pH (Fig. 5). At low pH, silk loses its overall acidic surface properties and negative net charge leading to rapid drug release. The pH dependent drug release may also be attributed to the efficient packing as well as loading of drug inside the SFNPs. In the previous report, the extent of release at different pH conditions was predominantly governed by the electrostatic interaction between doxorubicin and SF.50 Since doxorubicin is a weak base and positively charged, it is adsorbed to silk in part by strong electrostatic bonding. However, unlike doxorubicin, TPL is neutral and CL possesses a weak negative charge and therefore, may be weakly adsorbed or bonded to the SFNPs (in part). Due to this difference in electrostatic interaction, TPL and CL showed higher release (≤ 50 %) at pH 5.0 compared to doxorubicin (20 %) at pH 4.5 in 24 hr. Similar studies by Wang et al. also showed that positively-charged molecules exhibit a more prolonged or sustained in vitro release of the drugs from the SFNPs compared to negatively charged molecules due to strong electrostatic interactions.51 The increase of TPL and CL release from SFNPs might also be attributed to the balance of the negative charges inside and outside the silk aggregate. Xiao et al. reported that metal ions usually interact with functional groups containing negative charges outside the aggregates while hydrogen ions could neutralize the negative charges both outside and inside the aggregates simultaneously due to their differential capacity of entering into the aggregates. When the negative charge outside silk aggregates is shielded, the repulsive force of the negative charge inside the aggregates could result in the destruction of the aggregates.52 Since the balance of the negative charge was shielded at acidic pH, the aggregates may be destructed and result in increased release of the drug. We will further investigate the mechanism of drug release and in vivo efficacy of the TPL-SFNPs and CL-SFNPs in a follow up study.
Delivering the anticancer drug inside the tumor cells while avoiding the p-gp mediated efflux of free drug to overcome the resistance and achieving the therapeutic concentration are important considerations for any nanoparticle formulation.53 Cellular uptake of nanoparticles is influenced by size, shape, material, surface charge and hydrophobicity.49 Cellular uptake assay by using RITC loaded SFNPs reiterated the potential uptake of SF nanoparticles. Confocal laser scanning microscope results indicated the superiority of the SF nanoparticles uptake inside the cells over free RITC (Fig. 5), which may be attributed to the rapid uptake of nanoparticles by endocytosis mechanism. Time dependent uptake of the nanoparticles was also observed in MIA PaCa-2 and PANC-1 cell lines. Superiority and time dependent uptake of SFNPs using flow cytometry analysis (Fig. 6) robustly support that SF nanoparticle approach could be an efficient way to deliver drugs to cancer cells.
The cytotoxic assay performed on PANC-1, MIA PaCa-2, HEK 293 and HFG-1 cell lines employing MTS assay exhibited safety and biocompatibility of placebo or Blank-SFNPs. At all concentrations, cell viability was > 95% after 72 h of treatment, clearly demonstrating the safe and non-toxic nature of Blank-SFNPs. Furthermore, hemolysis test was performed using fresh mouse blood for empty nanoparticles and drug loaded nanoparticles to confirm the biocompatibility of newly formed nanoparticles.54, 55 Hemolysis assay which gives an indication of the interactions between SFNPs and RBCs showed no significant hemolysis for the formulations indicating the use of safe, biocompatible, and biodegradable silk fibroin nanoparticles.
In both MIA PaCa-2 and PANC-1 cells, 72 h cytotoxicity assays revealed the IC50 of CL, TPL, CL-SFNPs and TPL-SFNPs (Fig. 7). Notably, the delivery of the drugs using SF-based CL and TPL formulations showed lower IC50 values as compared to free drugs IC50 indicating that nanoparticle formulations were more potent in inhibiting the cancer cell growth. This can be attributed to rapid uptake of nanoparticles inside the cells followed by releasing their high payload in cytosol.56, 57 The colony formation assay performed with the same cell line indicated superiority of CL-SFNPs and TPL-SFNPs over the free drug (Fig. 8).
In this study, we estimated the combination index (CI) value for both free drug combination and drug-loaded SFNPs combination using CompuSyn software® to evaluate the synergistic effect and the results demonstrated that TPL-SFNPs and CL-SFNPs have significant synergistic effect at low dose compared to free drug in both pancreatic cancer cell lines; all CI values were below 0.7 (Fig. 9 & 10). As shown in Fig. 9A2 & 9B2, Fig. 10A2 & 10B2, the calculated combination index values of TPL-SFNPs and CL-SFNPs (CI: 0.369–0.630) are much smaller than the combination index values of free drug TPL and CL (CI: 1.600–0.680) indicating much greater synergistic effect of SFNPs’ compared to that of free drugs. This synergistic effect may be attributed to the increase in the drug concentration inside the cell. The inhibition of cell growth at low dose drug combination may translate to a decrease in the toxicity in vivo condition. Apoptosis study with equivalent dose of drug and drug-loaded nanoparticles was conducted to confirm the potent synergistic effects of this nanoparticle combination. The results demonstrated that even at low dose combination, nanoparticle treatment is more potent in terms of inducing apoptosis and cell death.
5. Conclusion
In summary, TPL-SFNPs and CL-SFNPs with desired particle size and drug loading were successfully prepared to overcome the poor water solubility and high toxicity of TPL or CL as well as to facilitate the simultaneous delivery to cancer cells. The drug-loaded SFNPs have sustained a pH-sensitive drug release profile along with biocompatibility characteristics. Moreover, when compared with free TPL and CL, TPL-SFNPs and CL-SFNPs showed enhanced antitumor activity, higher inhibition of colony formation and could induce more apoptosis of cancer cells, which might be due to the sustained release of TPL and CL from SFNPs as well as the improved stability and cellular uptake of drugs encapsulated inside the nanoparticles. Further reduction in cell viability and significant increase of apoptosis when treated with a combination of TPL-SFNPs and CL-SFNPs provides strong proof of better anticancer efficacy of combination nanoparticle therapy than either TPL-SFNPs or CL-SFNPs individually. More importantly, the combination index value below 0.7, calculated by CompuSyn software, indicates that in certain ratio or drug concentration the combination therapy effect is strongly synergistic rather than additive. The results indicate that combination therapy of TPL and CL encapsulated in SFNPS could be a promising strategy for the treatment of pancreatic cancer.
Supplementary Material
Acknowledgments
The authors greatly thank Dr. Nekkanti, Western University of Health Sciences for his valuable suggestions and helpful discussions. We acknowledge the financial support received from the National Institute of Health of USA (No. 1 R15 CA182834-01A1), National Natural Science Foundation of China (No. 81201809), Zhejiang Provincial Natural Science Foundation of China (No. LQ12H30005), Public Welfare Technology Application Research Project of China (No. 2015C37125), Zhejiang Provincial 12 Five-year Plan for University Key Academic Subject of China (Pharmacology), and Western University of Health Sciences of USA (No. 12685P).
References
- 1.Siegel RL, Miller KD, Jemal ACA. Cancer J Clin. 2016;66:7–30. doi: 10.3322/caac.21332. [DOI] [PubMed] [Google Scholar]
- 2.Wolfgang CL, Herman JM, Laheru DA, Klein AP, Erdek MA, Fishman EK, Hruban RH, CA Cancer J Clin. 2013;63:318–348. doi: 10.3322/caac.21190. [DOI] [PMC free article] [PubMed] [Google Scholar]
- 3.Oettle H. Cancer Treat Rev. 2014;40:1039–1047. doi: 10.1016/j.ctrv.2014.07.003. [DOI] [PubMed] [Google Scholar]
- 4.Prabhu L, Mundade R, Korc M, Loehrer PJ, Lu T. Oncotarget. 2014;5:10969–10975. doi: 10.18632/oncotarget.2624. [DOI] [PMC free article] [PubMed] [Google Scholar]
- 5.Storz P. Expert Rev Anticancer Ther. 2013;13:501–504. doi: 10.1586/era.13.28. [DOI] [PMC free article] [PubMed] [Google Scholar]
- 6.Berlin J, Benson AB. Nat Rev Clin Oncol. 2010;7:135–137. doi: 10.1038/nrclinonc.2010.16. [DOI] [PubMed] [Google Scholar]
- 7.Herreros-Villanueva M, Hijona E, Cosme A, Bujanda L. World J Gastroenterol. 2012;18:1565–1572. doi: 10.3748/wjg.v18.i14.1565. [DOI] [PMC free article] [PubMed] [Google Scholar]
- 8.Guo Y, Ziesch A, Hocke S, Kampmann E, Ochs S, De Toni EN, Göke B, Gallmeier E. J Cell Mol Med. 2015;19:340–350. doi: 10.1111/jcmm.12444. [DOI] [PMC free article] [PubMed] [Google Scholar]
- 9.Chen BJ. Triptolide, Leuk Lymphoma. 2001;42:253–365. doi: 10.3109/10428190109064582. [DOI] [PubMed] [Google Scholar]
- 10.Zhou ZL, Yang YX, Ding J, Li YC, Miao ZH. Nat Prod Rep. 2012;29:457–475. doi: 10.1039/c2np00088a. [DOI] [PubMed] [Google Scholar]
- 11.Liu Z, Ma L, Zhou GB. Molecules. 2011;16:5283–5297. doi: 10.3390/molecules16065283. [DOI] [PMC free article] [PubMed] [Google Scholar]
- 12.Banerjee S, Sangwan V, McGinn O, Chugh R, Dudeja V, Vickers SM, Saluja AK. J Biol Chem. 2013;288:33927–33938. doi: 10.1074/jbc.M113.500983. [DOI] [PMC free article] [PubMed] [Google Scholar]
- 13.Li CJ, Chu CY, Huang LH, Wang MH, Sheu LF, Yeh JI, Hsu HY. Cancer Lett. 2012;319:203–213. doi: 10.1016/j.canlet.2012.01.006. [DOI] [PubMed] [Google Scholar]
- 14.Li H, Hui L, Xu W, Shen H, Chen Q, Long L, Zhu X. Pharm Biol. 2012;50:1233–1240. doi: 10.3109/13880209.2012.665931. [DOI] [PubMed] [Google Scholar]
- 15.Sai K, Li WY, Chen YS, Wang J, Guan S, Yang QY, Guo CC, Mou YG, Li WP, Chen ZP. Am J Chin Med. 2014;42:485–503. doi: 10.1142/S0192415X14500323. [DOI] [PubMed] [Google Scholar]
- 16.Chen Z, Sangwan V, Banerjee S, Chugh R, Dudeja V, Vickers SM, Saluja AK. Cancer Lett. 2014;348:156–166. doi: 10.1016/j.canlet.2014.03.016. [DOI] [PMC free article] [PubMed] [Google Scholar]
- 17.Yadav VR, Sung B, Prasad S. J Mol Med. 2010;88:1243–1253. doi: 10.1007/s00109-010-0669-3. [DOI] [PMC free article] [PubMed] [Google Scholar]
- 18.Chen M, Rose AE, Doudican N, Osman I, Orlow SJ. Mol Cancer Res. 2009;7:1946–1953. doi: 10.1158/1541-7786.MCR-09-0243. [DOI] [PubMed] [Google Scholar]
- 19.Lo Iacono M, Monica V, Vavala T, Gisabella M, Saviozzi S, Bracco E, Novello S, Papotti M, Scagliotti GV. Int J Cancer. 2015;136:2598–2609. doi: 10.1002/ijc.29302. [DOI] [PubMed] [Google Scholar]
- 20.Raja SM, Clubb RJ, Ortega-Cava C, Williams SH, Bailey TA, Duan L, Zhao X, Reddi AL, Nyong AM, Natarajan A, Band V, Band H. Cancer Biol Ther. 2011;11:263–276. doi: 10.4161/cbt.11.2.13959. [DOI] [PMC free article] [PubMed] [Google Scholar]
- 21.Jiang QW, Cheng KJ, Mei XL, Qiu JG, Zhang WJ, Xue YQ, Qin WM, Yang Y, Zheng DW, Chen Y, Wei MN, Zhang X, Lv M, Chen MW, Wei X, Shi Z. Oncotarget. 2015;6:32790–32804. doi: 10.18632/oncotarget.5411. [DOI] [PMC free article] [PubMed] [Google Scholar]
- 22.Jiang D, Gao XL, Kang T, Feng XY, Yao JH, Yang MS, Jing YX, Zhu QQ, Feng JX, Chen J. Nanoscale. 2016;8:3100–3118. doi: 10.1039/c5nr07724a. [DOI] [PubMed] [Google Scholar]
- 23.Peer D, Karp JM, Hong S, Farokhzad OC, Margalit R, Langer R. Nat Nanotechnol. 2007;2:751–760. doi: 10.1038/nnano.2007.387. [DOI] [PubMed] [Google Scholar]
- 24.Park K, Lee S, Kang E, Kim K, Choi K, Kwon IC. Adv Funct Mater. 2009;19:1553–1566. [Google Scholar]
- 25.Brannon-Peppas L, Blanchette JO. Adv, Drug Delivery Rev. 2004;56:1649. doi: 10.1016/j.addr.2004.02.014. [DOI] [PubMed] [Google Scholar]
- 26.Mottaghitalab F, Farokhi M, Ali Shokrgozar M, Atyabi F, Hosseinkhani H. J Control Release. 2015;206:161–176. doi: 10.1016/j.jconrel.2015.03.020. [DOI] [PubMed] [Google Scholar]
- 27.Tao H, Kaplan DL, Omenetto FG. Adv Mater. 2012;24:2824–2837. doi: 10.1002/adma.201104477. [DOI] [PubMed] [Google Scholar]
- 28.Jin HJ, Kaplan DL. Nature. 2003;424:1057–1061. doi: 10.1038/nature01809. [DOI] [PubMed] [Google Scholar]
- 29.Tian Y, Jiang XJ, Chen X, Shao ZZ, Yang WL. Adv Mater. 2014;26:7393–7398. doi: 10.1002/adma.201403562. [DOI] [PubMed] [Google Scholar]
- 30.Wang X, Yucel T, Lu Q, Hu X, Kaplan DL. Biomaterials. 2010;31:1025–1035. doi: 10.1016/j.biomaterials.2009.11.002. [DOI] [PMC free article] [PubMed] [Google Scholar]
- 31.Wenk E, Wandrey AJ, Merkle HP, Meinel L. J Control Release. 2008;132:26–34. doi: 10.1016/j.jconrel.2008.08.005. [DOI] [PubMed] [Google Scholar]
- 32.Mitropoulos AN, Perotto G, Kim S, Marelli B, Kaplan DL, Omenetto FG. Adv Mater. 2014;26:1105–1110. doi: 10.1002/adma.201304244. [DOI] [PubMed] [Google Scholar]
- 33.Rockwood DN, Preda RC, Yucel T, Wang X, Lovett ML, Kaplan DL. Nat Protoc. 2011;6:1612–1631. doi: 10.1038/nprot.2011.379. [DOI] [PMC free article] [PubMed] [Google Scholar]
- 34.Wu P, Liu Q, Li R, Wang J, Zhen X, Yue G, Wang H, Cui F, Wu F, Yang M, Qian X, Yu L, Jiang X, Liu B. ACS Appl Mater Interfaces. 2013;5:12638–12645. doi: 10.1021/am403992b. [DOI] [PubMed] [Google Scholar]
- 35.Kundu J, Chung YI, Kim YH, Tae G, Kundu SC. Int J Pharm. 2010;388:242–250. doi: 10.1016/j.ijpharm.2009.12.052. [DOI] [PubMed] [Google Scholar]
- 36.Chen M, Shao Z, Chen X, Biomed J. Mater Res A. 2012;100:203–210. doi: 10.1002/jbm.a.33265. [DOI] [PubMed] [Google Scholar]
- 37.Ling S, Qi ZM, Knight DP, Shao ZZ, Chen X. Biomacromolecules. 2011;12:3344–3349. doi: 10.1021/bm2006032. [DOI] [PubMed] [Google Scholar]
- 38.Shi Z, Peng XX, Kim IW, Shukla S, Si QS, Robey RW, Bates SE, Shen T, Ashby CR, Jr, Fu LW, Ambudkar SV, Chen ZS. Cancer Res. 2007;67:11012–11020. doi: 10.1158/0008-5472.CAN-07-2686. [DOI] [PubMed] [Google Scholar]
- 39.Shi Z, Tiwari AK, Shukla S, Robey RW, Singh S, Kim IW, Bates SE, Peng X, Abraham I, Ambudkar SV, Talele TT, Fu LW, Chen ZS. Cancer Res. 2011;71:3029–3041. doi: 10.1158/0008-5472.CAN-10-3820. [DOI] [PMC free article] [PubMed] [Google Scholar]
- 40.Jiang QW, Cheng KJ, Mei XL, Qiu JG, Zhang WJ, Xue YQ, Qin WM, Yang YY, Zheng DW, Chen Y, Wei MN, Zhang X, Lv M, Chen MW, Wei X, Shi Z. Oncotarget. 2015;6:32790–32804. doi: 10.18632/oncotarget.5411. [DOI] [PMC free article] [PubMed] [Google Scholar]
- 41.Foster KA, Yazdanian M, Audus KL. J Pharm Pharmacol. 2001;53:57–66. doi: 10.1211/0022357011775190. [DOI] [PubMed] [Google Scholar]
- 42.Nekkanti V, Marwah A, Pillai R. Drug Dev Ind Pharm. 2015;41:124–130. doi: 10.3109/03639045.2013.850709. [DOI] [PubMed] [Google Scholar]
- 43.Osaka T, Nakanishi T, Shanmugam S, Takahama S, Zhang H. Colloids Surf B Biointerfaces. 2009;71:325–330. doi: 10.1016/j.colsurfb.2009.03.004. [DOI] [PubMed] [Google Scholar]
- 44.Gupta AK, Gupta M, Yarwood SJ, Curtis AS. J Control Release. 2004;95:197–207. doi: 10.1016/j.jconrel.2003.11.006. [DOI] [PubMed] [Google Scholar]
- 45.Varshosaz J, Tavakoli N, Minayian M, Rahdari N. AAPS PharmSciTech. 2009;10:158–165. doi: 10.1208/s12249-009-9191-8. [DOI] [PMC free article] [PubMed] [Google Scholar]
- 46.Sonam, Chaudhary H, Kumar V. Int J Biol Macromol. 2014;64:99–105. doi: 10.1016/j.ijbiomac.2013.11.032. [DOI] [PubMed] [Google Scholar]
- 47.Muhammad SA, Ahmed S, Ismail T, Hameed A. Pak J Pharm Sci. 2014;27:11–23. [PubMed] [Google Scholar]
- 48.Fröhlich E. Int J Nanomedicine. 2012;7:5577–5591. doi: 10.2147/IJN.S36111. [DOI] [PMC free article] [PubMed] [Google Scholar]
- 49.Arvizo RR, Miranda OR, Thompson MA, Pabelick CM, Bhattacharya R, Robertson JD, Rotello VM, Prakash YS, Mukherjee P. Nano Lett. 2010;10:2543–2548. doi: 10.1021/nl101140t. [DOI] [PMC free article] [PubMed] [Google Scholar]
- 50.Seib FP, Jones GT, Rnjak-Kovacina J, Lin Y, Kaplan DL. Adv Healthc Mater. 2013;2:1606–1611. doi: 10.1002/adhm.201300034. [DOI] [PMC free article] [PubMed] [Google Scholar]
- 51.Wang J, Yin ZP, Xue X, Kundu SC, Mo XM, Lu SZ. Int J Mol Sci. 2016;17:2012. doi: 10.3390/ijms17122012. [DOI] [PMC free article] [PubMed] [Google Scholar]
- 52.Xiao LY, Lu G, Lu Q, Kaplan DL. ACS Biomater Sci Eng. 2016;2:2050–2057. doi: 10.1021/acsbiomaterials.6b00457. [DOI] [PubMed] [Google Scholar]
- 53.Markman JL, Rekechenetskiy A, Holler E, Ljubimova JY. Adv Drug Deliv Rev. 2013;65:1866–1879. doi: 10.1016/j.addr.2013.09.019. [DOI] [PMC free article] [PubMed] [Google Scholar]
- 54.Dobrovolskaia MA, Clogston JD, Neun BW, Hall JB, Patri AK, McNeil SE. Nano Lett. 2008;8:2180–2187. doi: 10.1021/nl0805615. [DOI] [PMC free article] [PubMed] [Google Scholar]
- 55.Choi J, Reipa V, Hitchins VM, Goering PL, Malinauskas RA. Toxicol Sci. 2011;123:133–143. doi: 10.1093/toxsci/kfr149. [DOI] [PubMed] [Google Scholar]
- 56.Yameen B, Choi WI, Vilos C, Swami A, Shi J, Farokhzad OC. J Control Release. 2014;190:485–499. doi: 10.1016/j.jconrel.2014.06.038. [DOI] [PMC free article] [PubMed] [Google Scholar]
- 57.Kettler K, Veltman K, van de Meent D, van Wezel A, Hendriks AJ. Environ Toxicol Chem. 2014;33:481–492. doi: 10.1002/etc.2470. [DOI] [PubMed] [Google Scholar]
Associated Data
This section collects any data citations, data availability statements, or supplementary materials included in this article.


