Abstract
We study the temperature dependence of the self-intermediate scattering function for supercooled water confined in hydrophilic silica nanopores. We simulate the simple point charge/extended model of water confined to pores of radii 20 , 30 , and 40 over a temperature range of 210 K to 250 K. First, we examine the temperature dependence of the structure of the water and find that there is layering next to the pore surface for all temperatures and diameters. However, there exists a region in the center of the pore where the density is nearly constant. Using the density profile, we divide confined water into different regions and compare the dynamics of the water molecules that start in these regions. To this end, we examine the mean-squared displacement and the self-intermediate scattering functions for the water hydrogens, which would allow one to connect our results with quasi-elastic neutron scattering experiments. We examine the dependence of the self-intermediate scattering function on the magnitude and direction of the wavevector, as well as the proximity to the silica surface. We also examine the rotational-translational decoupling. We find that the anisotropy of the dynamics and the rotational-translational decoupling is weakly temperature dependent.
I. INTRODUCTION
For biological and industrial applications, it is important to understand how nano-confinement changes the properties of water. Furthermore, the dynamics of supercooled nano-confined water is of fundamental interest.1 If the geometry restricts the formation of crystalline ice, nano-confined water can be supercooled below its homogeneous nucleation temperature.2,3 This offers a means to study the dynamics of amorphous water in a temperature range that is not possible to study for bulk water. However, the confinement and the water-surface interactions influence the structure and the dynamics of the water.4
Water confined to approximately cylindrical nano-pores of MCM-41 appears to be less influenced by the water-surface interactions than water confined in many other systems.1,5 Therefore, water confined in MCM-41 is an attractive system to study the dynamics of supercooled water, and there have been several experimental and simulational studies of the structural relaxation of water in MCM-41 with various pore sizes.6–9,11–16 In general, it has been shown that the translational and rotational motions of the water slow down relative to the bulk at a given temperature.4 Furthermore, the temperature dependence of the relaxation time has received much attention due to an apparent fragile-to-strong transition.10 However, interpreting experiments is complicated due to anisotropic dynamics within the pore.8,9
Quasi-elastic neutron scattering (QENS) is frequently used to examine the dynamics of water in MCM-41 nano-pores.10–14,16 To analyze QENS results, it is generally assumed that the signal is a convolution of vibrational, rotational, and translational components.17 Since the vibrational component is too fast to resolve using QENS,18 it is frequently not included in the analysis. Several different approximations have been made for the rotational and translational contributions to the QENS signal.17 Molecular dynamics simulations can examine the accuracy of these approximations by calculating the self-intermediate scattering function, a quantity related to the dynamic structure factor obtained from QENS studies. Molecular dynamics simulations are also able to examine how the anisotropic dynamics change the self-intermediate scattering function.
To aid in the interpretation of QENS studies, Milischuk, Krewald, and Ladanyi9 examined the wavevector Q and time dependence of the self-intermediate scattering function Fs(Q, t) of the water hydrogens for water confined to nano-pores of MCM-41 at 300 K for various pore sizes. They examined how Fs(Q, t) was dependent on the pore diameter as well as the direction and the magnitude of the momentum transfer Q. They also examined how the water molecules next to the silica surface influenced Fs(Q, t), and examined the extent of the rotational-translational coupling in Fs(Q, t). They concluded that the decreased mobility of the water molecules next to the silica surface resulted in a strong pore size dependence of Fs(Q, t) and that the relaxation rate depends on the direction of Q.
For consistent interpretation of QENS signals in the supercooled regime, it is important that the approximations that go into the analysis are weakly temperature dependent. Here we examine how Fs(Q, t) of the water hydrogens changes as the temperature is decreased for the different pore sizes. We examine temperatures ranging from 300 K to 210 K (the mildly supercooled regime for the model of water used in this study) and the pore sizes of 20 , 30 , and 40 . We examine the temperature dependence of the anisotropic dynamics and the rotational-translational coupling. We find that the anisotropy of the dynamics does not increase significantly despite a significant slow down of the dynamics. Additionally, there is only a small increase in the rotational-translational coupling with decreasing temperature.
The paper is organized as follows. In Sec. II, we present the simulation methods and molecular models used in the study. We also describe the procedure used to hydrate the pores and describe some difficulties associated with obtaining a hydrated pore in equilibrium. In Sec. III, we examine how the silica surface influences the fluid density for different pore sizes and temperatures. In Sec. IV, we study the anisotropy of the long time dynamics of the water by examining the mean-squared displacement (MSD) for different directions within the pore. In Sec. V, we study the dependence of Fs(Q, t) on the magnitude and direction of Q and its sensitivity to the anisotropic dynamics. We also quantify the temperature dependence of the translational-rotational coupling and the accuracy of the Rayleigh expansion. We end with a summary and conclusions.
II. METHODS
A. Pore construction and hydration
We simulated supercooled simple point charge/extended (SPC/E) water confined to silica nanopores following the procedure of earlier studies.8,9 We generated nanoporous silica using cylindrical resists following the procedure of Gulmen and Thompson.19 Pore surfaces were partially hydroxylated to simulate conditions observed in experiment.20,21 The number of hydroxyl groups NOH along with the number of water molecules NW for each pore are given in Table I. The pores were constructed in a simulation box with the dimensions of Lx = Ly = 60 and Lz = 40 . The axis of the pore is along the z direction. We studied the pore sizes, R, of 40 , 30 , and 20 in diameter.
TABLE I.
Number of water molecules NW and hydroxyl groups NOH in each pore.
| Pore diameter () | NW | NOH |
|---|---|---|
| 20 | 547 | 64 |
| 30 | 1092 | 96 |
| 40 | 1718 | 104 |
To hydrate the pore, two-box Gibbs ensemble Monte Carlo simulations were performed using the TOWHEE simulation package.22–24 Initially, the first box contained the silica matrix without any water molecules present. The silica matrix was fixed in place. The second box, the water box, contained water vapor at a temperature of 300 K and a pressure of 4 kPa. This pressure was chosen to be slightly above the vapor pressure of the SPC/E water model at 300 K. The volume of the first box was kept constant, but the volume of the second box was allowed to fluctuate. Insertion, deletion, translational and rotational Monte Carlo moves were performed on the water molecules in both the boxes until a plateau was observed in the number of molecules within the box containing the pore. This plateau was observed after around 15 000 Monte Carlo cycles, where one Monte Carlo cycle is one attempted move per particle. After the Monte Carlo simulations were complete, all the water molecules that resided at a radial position of greater than R + 5 Å were considered nonphysical due to their placement within small voids in the silica matrix. These water molecules were removed. The final configurations were used as initial configurations in the molecular dynamics simulations.
The method described in the previous paragraph results in a density in the center of the pore that is close to what is reported in experiments and close to the density that was used in previous studies.4,15 However, we examined the hydration procedure in some detail to try to understand the sensitivity of the results on this procedure. We found that the above mentioned procedure produced consistent results, but the water in the box without the pore condensed into small clusters and was not in equilibrium. Furthermore, equilibrium was approached exceedingly slow and the approach to equilibrium was slow enough that we could not estimate how long it would take to reach equilibrium.
To examine how hydration is dependent on the initial state of the water box, we used water equilibrated at 300 K and 4 kPa for the water box.25–27 The Monte Carlo simulations were performed as described previously, except that the box containing the pore contained the final hydrated pore configurations from the initial Monte Carlo simulations. It was found in this case that the number of water molecules inside the pore decreased. However, this decrease occurred at an approximate rate of 15 molecules per 35 000 Monte Carlo cycles, and, again, equilibrium was approached very slowly.
We also attempted to hydrate the pore using a water box where the initial condition was water equilibrated at 300 K and ambient pressure (101 kPa). The number of water molecules in the pore also decreased in the pore, but at a considerably faster rate than when the water box was initially at lower pressure. Again, it is unclear how long the Monte Carlo simulations would need to be run in order reach equilibrium.
We conclude from these simulations that finding the equilibrium hydration of the pores using TOWHEE takes a prohibitively long time. Further work should examine how the self-intermediate scattering function depends on the hydration of the pore and if small changes in hydration significantly change the self-intermediate scattering function over the temperature range examined in this work. Since we are concerned about the temperature dependence of the self-intermediate scattering function and making contact with previous work,9 we used the pores hydrated using the first method described.
B. Model and simulation details
We simulated temperatures of 250 K, 240 K, 230 K, 220 K, and 210 K in the NVT ensemble with a Nosé-Hoover thermostat using DL_POLY_2.28 The Nosé-Hoover relaxation constant was 50 ps. The initial condition for the next lower temperature was an equilibrium configuration from the next higher temperature. We equilibrated the system for 10 ns and then ran at least 4 production runs for at least 20 ns.
The interaction potential between particle i and j is Lennard-Jones (LJ) plus Coulomb,
| (1) |
Lorenz-Berthelot combining rules were used for the LJ parameters.29 The simple point charge/extended (SPC/E) model30 was used to model water molecules. The LJ parameters introduced by Bródka and Zerda33 and the partial charges due to Gulmen and Thompson34 were used to model the pore. These parameters are given in Table II, where atoms without a Lennard-Jones site are marked by ellipses.
TABLE II.
Potential parameters.
| Interaction site | q/e | (kJ/mol) | () |
|---|---|---|---|
| Ow | −0.8476 | 0.650 | 3.166 |
| Hw | 0.4238 | … | … |
| Si | 1.28 | … | … |
| OSi | −0.64 | 1.912 | 2.700 |
| OOH | −0.74 | 1.912 | 3.000 |
| HOH | 0.42 | … | … |
III. WATER STRUCTURE
In this section, we examine how the confinement and the pore surface influence the structure of the water. Previous simulations9 demonstrated that there is a variation of the density next to the surface. The water dynamics can be influenced by the water-pore interactions as well as this density variation. Here we are interested in how the radial density changes when decreasing the temperature for the three pore diameters.
We study the radial mass density defined through
| (2) |
where is the center of mass of the water molecule, NW is the number of water molecules, mi is the mass of the water molecule, and is the radial distance from the center of the pore.
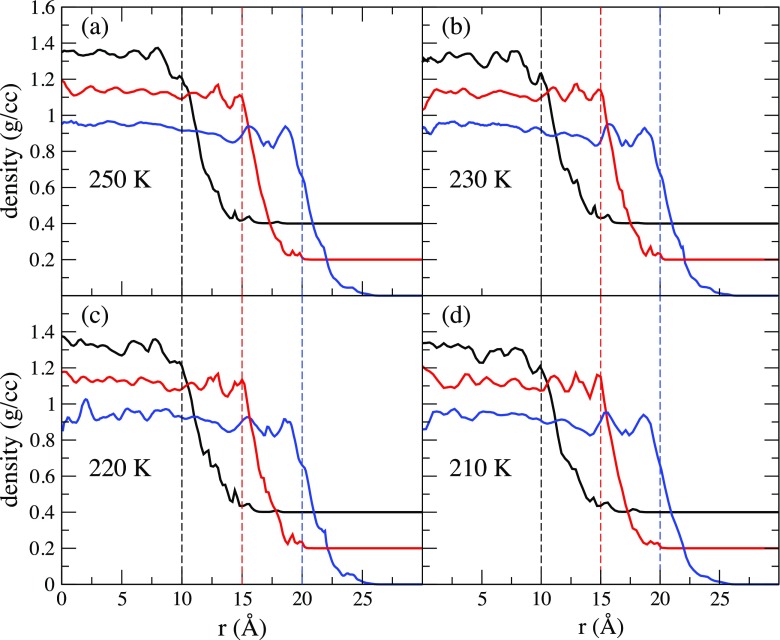
Figure 1 shows for waters in the three different pores at all temperatures. The local radial density profile is approximately constant and uniform near the center of the pore with an average density of g/cc. This value is consistent with the previous simulation studies of 40 Å diameter pores.8 One or two peaks are present near the edges of the pore, indicative of the non-uniform water structure in proximity to the pore wall. The density then begins to decay rapidly close to the pore radius, and there are some water molecules outside the defined radius of the pore. This is due to the roughness of the pore matrix.
FIG. 1.
Radial density profile of the center of mass of the water molecules confined in the 40 pore (black line), the 30 pore (red line), and the 20 pore (blue line) for (a) T = 250 K, (b) 230 K, (c) 220 K, and (d) 210 K. The dashed lines indicated the radius of the pore. The 30 pore is offset by 0.2 g/cc and the 20 pore is offset by 0.4 g/cc.
Using the radial density, we can divide the pore into two regions: the core region and the shell region. We define the core region of the pore as the region in which the density of the water remains approximately uniform. For a pore of diameter d, we define the core region to be 0 Å Å and the shell region to be Å. We use this definition to remain consistent with our previous studies of this system.9 However, it might be more appropriate to compare core regions of the different sizes due to the curvature of the interface. The percentages of the water molecules in the core region of the 20 Å pore, the 30 Å pore, and the 40 Å pore are 11.5%, 29.1%, and 50.2%, respectively.
IV. WATER MEAN SQUARE DISPLACEMENT
In this section, we examine how the mean-square displacement of the water molecules changes when the temperature is decreased. QENS examines the dynamics on a length scale proportional to the inverse of the wavevector Q.18 The small Q behavior is related to the large displacement, long time, behavior of the water, which can also be examined by looking at the long time behavior of the mean-square displacement. Since the pore translational motion of the water molecules is restricted in the radial direction but unhindered in the axial direction, we calculate the components of the mean squared displacement (MSD) of the water center of masses in the axial (z) direction and the radial () directions.
In the axial direction, the MSD is linear at long times, and thus
| (3) |
where Dz is the axial diffusion coefficient. The MSD in the radial direction is bounded by the finite radius of the pore. If the pore is approximated as a smooth cylinder, then at long times,32
| (4) |
However, the pore wall is rough and the pore is only approximately a cylinder.
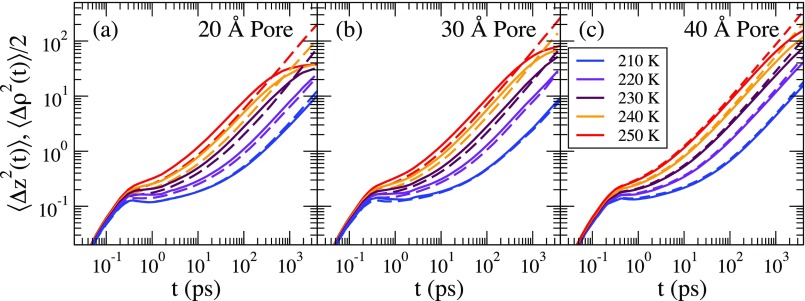
In Fig. 2, we show the axial and 1/2 the radial MSD (to facilitate comparison with the axial MSD) for the (a) 20 , (b) 30 , and (c) 40 pores for all temperatures studied. For each pore, a plateau begins to emerge at lower temperatures. The plateau height is temperature dependent and is smaller for lower temperatures. The radial and axial MSDs are similar in the short time ballistic regime, but they deviate after the ballistic regime for the 20 Å and 30 Å pores. This occurs for K. After the plateau, there is a nearly linear regime for both the axial and radial components, with the radial component approaching its asymptotic value at long times and the axial component remaining linear. We note that the long time behavior of the radial component of the MSD implies that the radii of the pores are slightly larger than the diameter we assign to the pore. This behavior is due to the roughness of the pore wall.
FIG. 2.
The axial (dashed lines) and radial (solid lines) MSDs for all the water molecules at all temperatures for (a) the 20 Å pore, (b) the 30 Å pore, and (c) the 40 Å pore. The saturation of the radial component at long times is visible at the higher temperatures.
For the 20 Å and the 30 Å pores, there is an appreciable slowing down of the radial component compared to the axial component at 250 K, but the difference between the radial and the axial components decreases with decreasing temperature and nearly vanishes at 210 K. We believe that the decrease of the MSD in the axial direction is due to the rough pore walls, which hinders the motion of the water molecules more in the axial direction than in the radial direction. However, this hypothesis does not explain why the difference of the MSD in the axial and radial directions vanishes at lower temperatures, which suggests a change in the water dynamics at these lower temperatures. Future studies should examine the water displacements next to the pore walls as a function of temperature in more detail. There is a little difference in the short and intermediate time behaviors of the MSD for the 40 Å pore at all temperatures.
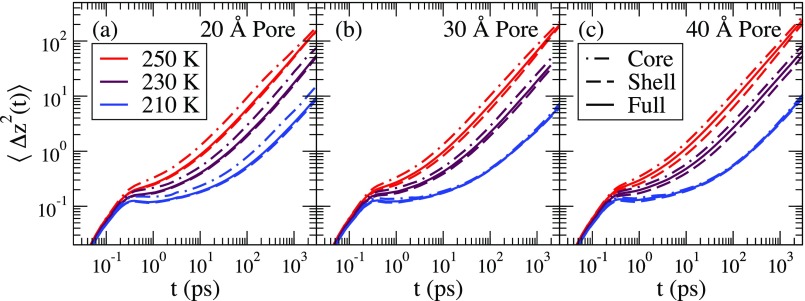
To examine how the mobility changes as a function of the distance from the silica substrate, we study for particles whose initial position z(0) is within the shell or the core. This is shown in Fig. 3. Three curves are shown as follows: (1) the MSD for the water molecules that were initially in the core region (dotted-dashed line), (2) the MSD for the water molecules that were initially in the shell region (dashed line), and (3) the MSD for all the water molecules regardless of their initial position (solid line). Waters that were initially in the core or the shell region may be at any position at time t. At short times, the curves for the core, shell, and full MSDs coincide since motion at short times is not significantly affected by the water-substrate interactions.
FIG. 3.
for waters that start in the core (dotted-dashed line) and in the shell (dashed line), and for all the water molecules (solid line) for (a) the 20 Å pore, (b) the 30 Å pore, and (c) the 40 Å pore. Temperatures of 250 K, 230 K, and 210 K are shown.
The water molecules that start in the core are more mobile on the time scale of the simulations than the waters that start in the shell for most pore sizes and temperatures. The exception is the 40 Å and the 30 Å pores at T = 210 K, where the mobility does not depend on the initial starting position of the water molecule.
The QENS probes dynamics at length scales proportional to Q−1, and the typical range of Q is between 0.2 Å−1 and 3 Å−1.35 We find that the dynamics of the water is heterogenous on the length scales measured in QENS studies. We note that the smaller the pore, the larger will be the percentage of the water molecules found in the slower shell region, and thus the full self-intermediate scattering function will be influenced more by the slower, shell water. In Sec. V, we examine the temperature dependence of the self-intermediate scattering function.
V. SELF-INTERMEDIATE SCATTERING FUNCTION
A. Background
Quasi-Elastic Neutron Scattering (QENS) measures the dynamic structure factor as a function of the momentum transfer Q and the frequency . The full dynamic structure factor is a sum of the coherent and incoherent components, and each atomic species has a unique coherent and incoherent scattering cross section.18 The incoherent scattering cross section for water is dominated by 1H. Here, we assume that is equivalent to the incoherent dynamic structure factor of the hydrogen atoms.36
Under the above assumption, is the frequency Fourier transform of the self-intermediate scattering function of the hydrogen atoms,9
| (5) |
where
| (6) |
The sum in Eq. (6) is over the hydrogen atoms and NH is the number of hydrogen atoms. FS(Q, t) is easily obtained from the molecular dynamics simulations, while requires a Fourier transform, which can introduce unwanted artifacts.
The motion of the hydrogen atoms in a system of the rigid water molecules can be decomposed into the translational and rotational components. The position of hydrogen atom i can then be written as
| (7) |
where is the water molecule center of mass and is the vector from the water molecule center of mass to the nth hydrogen atom of the water molecule. For the rigid water molecule studied in this work, the vector can only change through rotation. The incoherent structure factor (ISF) can then be written as
| (8) |
In QENS studies, the product approximation is frequently used to analyze the data. This approximation assumes that the translational and rotational degrees of freedom are decoupled, and the total ISF is approximated as a product of the translational and rotational components,17
| (9) |
where the translational and rotational components are defined as follows:
| (10) |
and
| (11) |
We examine the momentum transfer Q in the axial direction and perpendicular to the axial direction. The values of Q for this study are chosen to be within the range accessible by QENS experiments, stated in Sec. IV.
B. Self-intermediate scattering functions of pore-confined water
In this subsection, we examine the temperature dependence of the total self-intermediate scattering functions. In previous work, it was shown that FS(Q, t) is dependent on the direction of Q and that there was an increase in the relaxation time of FS(Q, t) with the decreasing pore size.9 This was due to the increased fraction of the water molecules found in the shell region of the smaller pores and an overall slowing down of the water molecules in the smaller pores.
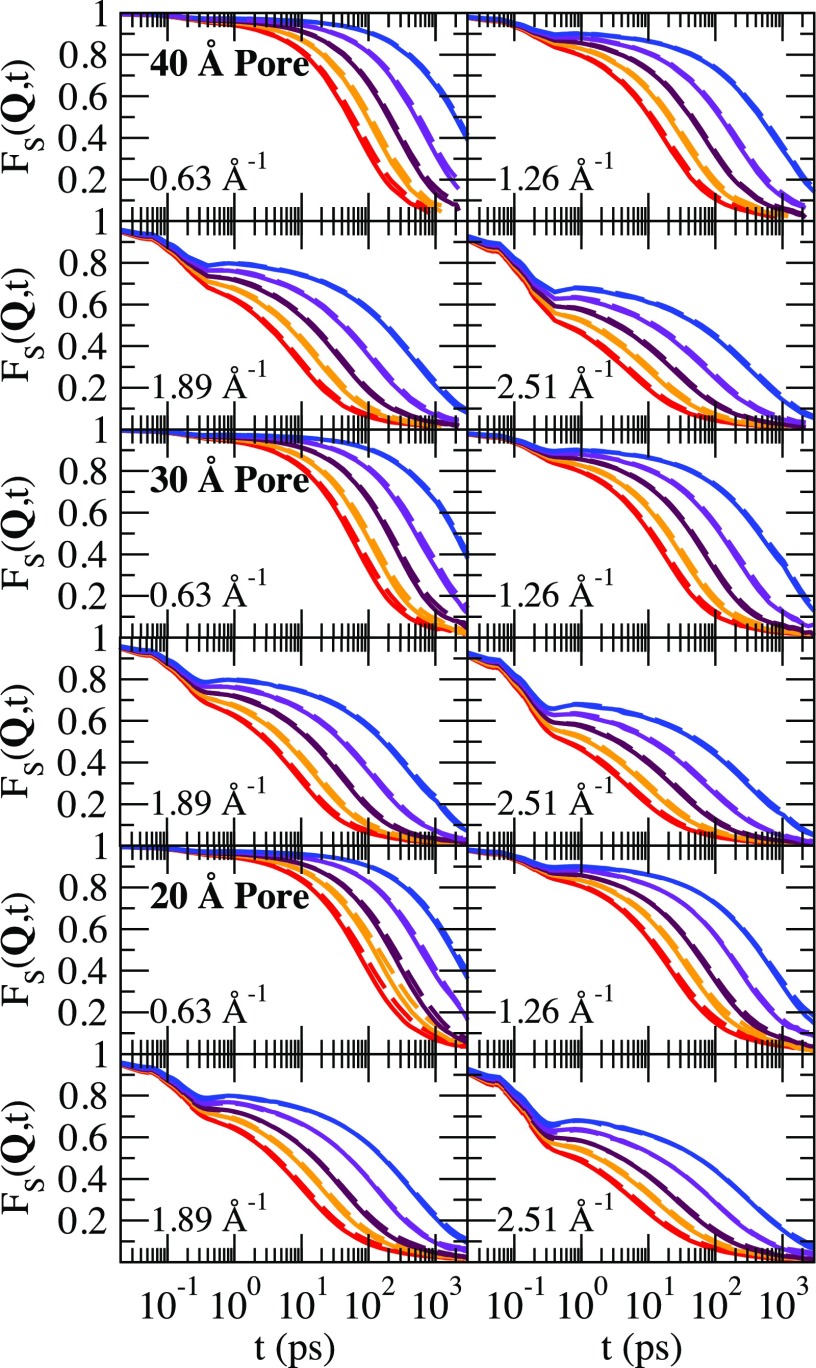
Shown in Fig. 4 is the self-intermediate scattering function for the three pore diameters for four values of Q = |Q|. For each Q, we show all the five temperatures. We show results with Q along the axial direction Qz (solid lines) and perpendicular to the axial direction Qx,y (dashed lines). It is expected FS(Q, t) averaged over the direction of Q would lie between Fs(Qz;, t) and Fs(Qx,y, t) as shown in Fig. 4, and future work should examine this expectation. After an initial relaxation during the time window of the ballistic regime of the MSD, a plateau develops at lower temperatures. The plateau suggests that the water molecules are trapped within a cage of neighbors, and it takes an increasingly longer time to escape this cage with decreasing temperature. The plateau length and height increases with decreasing temperature. The decay from the plateau is non-exponential in all the cases and is better described by a stretched exponential. However, the final decay is very slow and a stretched exponential does not fit the final decay well. If Q is perpendicular to the axial direction, then FS(Q, t) will decay to a Q dependent constant proportional to the radius size. In every case, the decay of FS(Q, t) is faster when Q is chosen in the axial direction.
FIG. 4.
The total self-intermediate scattering function for the four Q values and the three pore diameters examined in this study. The solid lines are results for Q in the axial direction Qz and the dashed lines are for Q perpendicular to the axial direction Qx,y. The temperatures are T = 250 K, 240 K, 230 K, 220 K, and 210 K listed from left to right. Note that the same color scheme is used in Fig. 2.
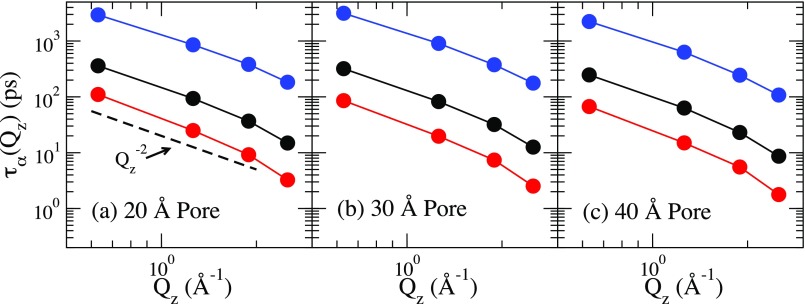
To quantify the decay time, we define the alpha relaxation time through . Note that depends on both the direction and magnitude of Q. However, we find that is nearly identical to . Shown in Fig. 5 is as a function of Qz for each pore size and each radius. There is at least 1.5 orders of magnitude slowdown for each Qz value. For reference, we show the dependence of the relaxation time expected for Fickian diffusion. We find that our smallest two wavevectors are consistent with what is expected for Fickian diffusion, but relaxation time grows faster with decreasing Qz at the larger wavevectors. We also find that is slighter larger than , but has the same dependence on the magnitude of Q as to within the error of the calculation.
FIG. 5.
The relaxation time calculated for (a) the 20 Å pore, (b) the 30 Å pore, and (c) the 40 Å pore for temperature of 250 K (blue), 230 K (black), and 210 K (red), respectively.
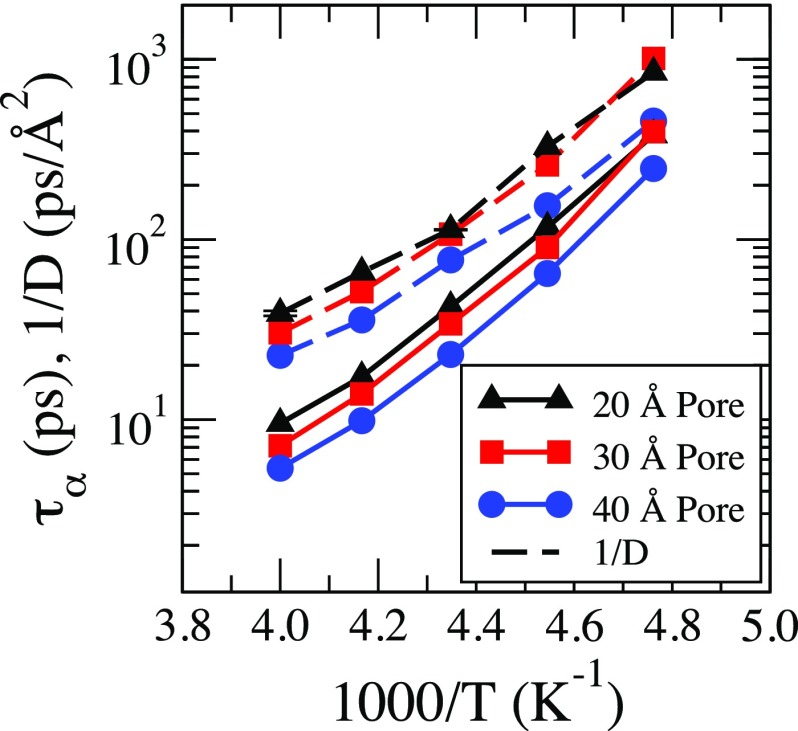
In Fig. 6, we show the temperature dependence of the relaxation time for Q = 1.89 calculated for the full self-intermediate scattering function. We find that for each pore the relaxation time increases for decreasing temperature. Furthermore, for all temperatures except T = 210 K, the relaxation time is longer for smaller pores. However, at T = 210 K the relaxation time for the 30 pore is slower than for the 20 pore. We also find that the inverse of the diffusion coefficient follows the same trend as the relaxation time, but the difference between the 30 Å and the 20 Å pores at 210 K is not that pronounced, Fig. 6.
FIG. 6.
The temperature dependence of relaxation times () in all the pores at Q = 1.89 Å−1. The temperature dependence of the inverse diffusion coefficient (1/D) in all the pore sizes is also plotted.
We are unsure of the cause of the non-monotonic dependence of the relaxation time and the diffusion coefficient on the pore size. We investigated several possibilities. One hypothesis that the slower relaxation times at 210 K in the 20 and 30 pores are due to the curvature of the pore wall affecting the dynamics and future studies should examine this hypothesis. To examine if the behavior was due to the increase in ordering, we calculated the tetrahedral order parameter qn for the water oxygen atom n,
| (12) |
where the sum over i and j is over the three nearest water oxygen atoms to water oxygen n and is the angle formed by the vectors ri − rn and rj − rn that connect nearest oxygen atoms.38,39 The one-third ensures that qn is one for a perfect tetrahedral structure.
We calculated the distribution of P(q) for all water oxygens and found that the peak height of P(q) was slightly higher in the 30 Å pore than the 20 Å pore at T = 210 K, but the peak height was approximately equal for the other pores and at the other temperatures. However, the difference in height for the 30 Å and the 20 Å pores was small at 210 K, and it is not clear that such a small difference would result in a crossover in the relaxation times. We also attempted to examine the density dependence of the relaxation time, but this study proved to be time consuming (see Sec. II B) and is left for future work.
C. Translational-rotational coupling
In this subsection, we examine the translational-rotational coupling and the product approximation given by Eq. (9), which is often used in analysis of the QENS data.17 Previous work suggests that the translational-rotational coupling is weak for water confined to silica nanopores at T = 300 K,9 and here we examine the temperature dependence of the coupling. First we examine and the applicability of the Rayleigh expansion, and then we examine the temperature and pore size dependence of the connected scattering function , which is a measure of the accuracy of the product approximation and the amount of translational-rotational decoupling.
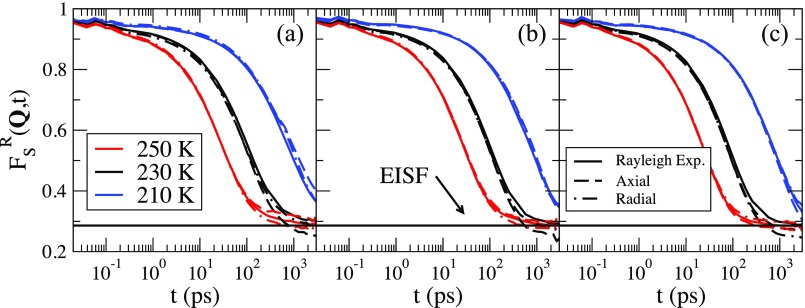
In Fig. 7, we show the temperature dependence of for Q = 1.89 Å−1 for all the pores at T = 250 K, 230 K, and 210 K. The wavevector is chosen to be along the axial direction (dashed lines) and perpendicular to the axial direction (dotted-dashed lines). There is no significant difference in for the different directions of Q.
FIG. 7.
The rotational correlation functions, , for Q in the radial (dotted-dashed line) and axial (dashed line) directions for T = 250 K (red), 230 K (black), and 210 K (blue) listed from left to right. Panel (a) shows the results of the 20 Å pore, (b) the 30 Å pore, and (c) the 40 Å pore. The Rayleigh expansion at each temperature is also shown in each panel as the solid line. The Elastic Incoherent Structure Factor (EISF) is shown as the solid black horizontal line.
For an isotropic fluid, can be expressed in terms of the Rayleigh expansion,37
| (13) |
where
| (14) |
where Pl(x) are Legendre polynomials of order l and are the unit vectors along b. There are additional terms for cylindrical confinement due to the anisotropy of the water molecule’s orientation at the cylinder walls.9 Here we will only consider the applicability of the Rayleigh expansion, which allows for the separation of the Q dependent and the time dependent terms.
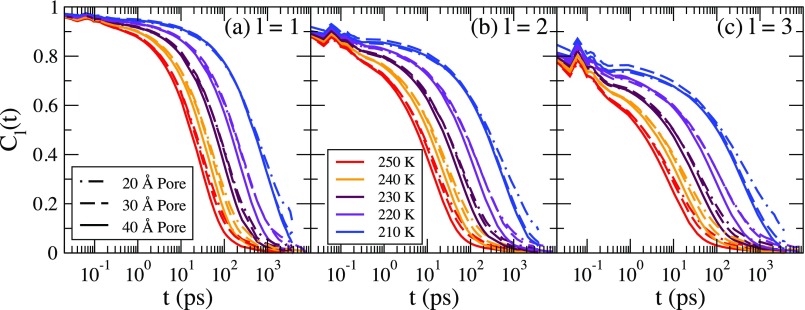
Shown in Fig. 8 is the temperature dependence of Cl(t) for l = 1, 2, and 3 for each pore and at each temperature. At the highest temperatures, the decay time of the rotational correlation functions is longer for the smaller pores, but at lower temperatures the decay times are nearly the same for each pore diameter. Additionally, the decay times of Cl(t) are not as influenced by the pore diameter as for FS(Q, t).
FIG. 8.
The rotational correlation function Cl(t) for l = 1, 2, and 3 for the 20 Å pore (dotted-dashed line), the 30 Å pore (dashed line), and the 20 Å pore (solid line), respectively, for each temperature.
We examine the accuracy of the Rayleigh expansion in Fig. 7, where we show the Rayleigh expansion for Q = 1.26 for T = 250 K, 230 K, and 210 K for the three pores. The solid lines in Fig. 7 are the Rayleigh expansion to third order and the dashed lines are . Shown as the solid line is the Elastic Incoherent Structure Factor (EISF), defined as EISF = , calculated using Eq. (13). The Rayleigh expansion is an excellent approximation for for all temperatures and all pore sizes. In conclusion, is not as dramatically affected by the pore size as FS(Q, t), and the Rayleigh expansion is a good approximation even though the system is not uniform.
To examine rotational-translational coupling at different temperatures, we calculate the connected ISF, which is defined as
| (15) |
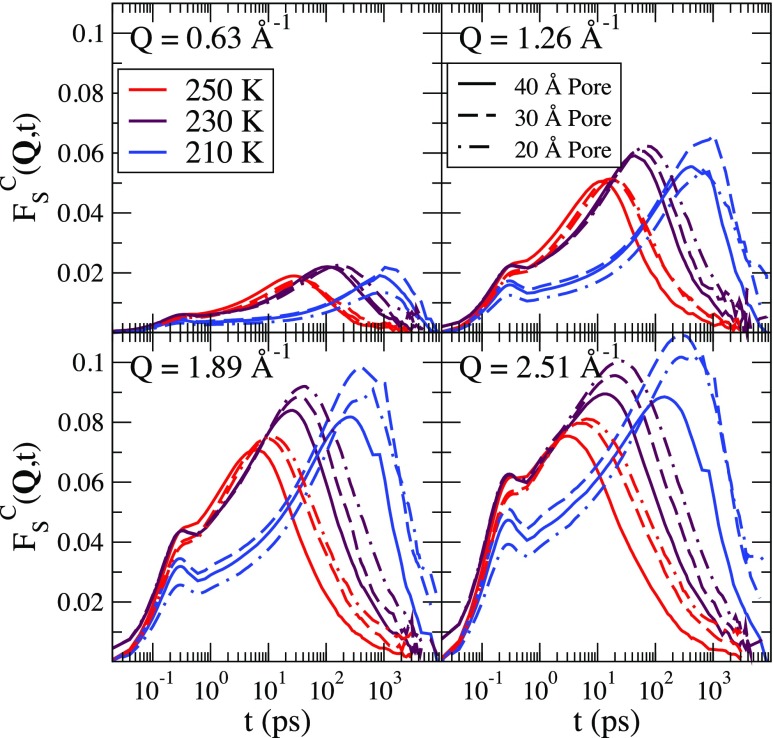
The connected portion of ISFs are shown in Fig. 9 for Q = 2.51 for all three pore sizes at temperatures of 210 K, 230 K, and 250 K. There is an initial peak in that is between 0.28 ps and 0.31 ps and a larger peak that occurs at later times at lower temperatures. The position of the larger peak is weakly dependent on Q and occurs on a similar time scale as , but does not scale with Q as . The ratio grows with decreasing Q and is around 0.5 for Q = 2.51 and 2.5 for Q = 0.63 .
FIG. 9.
The connected portion of FS(Q, t) for each wavevector, each pore, and each temperature. The product approximation is more accurate for smaller wavevectors but is weakly dependent on the temperature and the pore size.
is smaller at each temperature and for each pore size for smaller wavevectors, which indicates that the product approximation is more accurate for smaller wavevectors. Importantly, the peak heights of is only weakly dependent on the temperature. This allows for consistent interpretation of QENS signals in supercooled silica nanopores since the product approximation does not introduce an increase in the error with increased supercooling.
VI. WATER ISF IN DIFFERENT REGIONS
To examine the influence of water-surface interactions on FS(Q, t), we examine FS(Q, t) for the water molecules starting in different regions. Previous work has examined water dynamics in a series of shells as well as in three shells.8,9 As with the mean-square displacement, we divide the water into two regions: core and shell waters. We use the same definition as in Sec. IV.
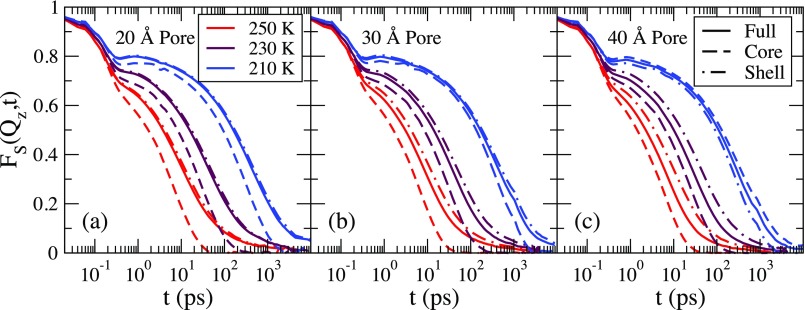
Shown in Fig. 10 is the full self-intermediate scattering function and the self-intermediate scattering function calculated using waters that start in the core and in the shell for T = 250 K, 230 K, and 210 K. The three pore sizes are shown and Q is chosen along the axial direction. For each pore and in each region a plateau develops when the temperature is reduced. There is a slow decay at late times for the full scattering function and the scattering function calculated for the shell region. This is due to reduced mobility of a fraction of the shell waters, where some do not move more than one molecular diameter on the time scale of the simulation. However, the scattering function calculated using waters that start in the core region does not exhibit the slowly decaying tail. For the smaller pores, a larger percentage of the water molecules are found in the shell region, and thus the shell self-intermediate scattering function is closer to the full self-intermediate scattering function for small pore sizes.
FIG. 10.
FS(Q, t), where Q is in the axial direction for the three pore sizes. Shown are the full scattering function (solid lines), the scattering function calculated using the shell waters (dotted-dashed lines), and the scattering function calculated using the core waters (dashed lines). For each pore, the temperatures of 250 K, 230 K, and 210 K, listed from left to right, are shown.
VII. SUMMARY AND CONCLUSION
We investigated the water dynamics and the self-intermediate scattering function calculated for the water molecules in silica nanopores for temperatures from T = 210 K to 250 K. For the SPC/E water model studied here, this range of temperatures includes normal liquid water down to mildly supercooled water. Due to the anisotropy of the density and the dynamics within the silica nanopores, we examined the dependence of the mean-square displacement and the self-intermediate scattering function as a function of the starting position of the water molecules and the direction of motion. We divided the pore into a core region that consists of the water molecules in the center of the pore and a shell region that consists of the water molecules close to the nanopore wall.
We find that the water dynamics demonstrate behavior characteristic of supercooled liquids. Specifically, we find that a plateau develops at intermediate times in the mean-square displacement and the self-intermediate scattering function for the water molecules in the core region and in the region next to the pore walls. While the initial decay from the plateau of the self-intermediate scattering function is well described by a stretched exponential, the final decay is slow and no longer well described by the same stretched exponential as the initial decay. This is due to the position dependence of the dynamics within the nanopore.
We find that there is an overall slow down of the dynamics within smaller pore sizes for K in the core region as well as the shell region. Therefore, the dynamics of the water are affected by the confinement even when there are no large density variations within the pore. For T = 210 K we found that the water molecules in the 30 Å pore were slower than in the 20 Å pore, which was evident in the relaxation times of Fs(Q, t) and in the diffusion coefficient for motion along the pore axis. We explored the two possibilities for this unexpected behavior. One was that the density of waters in the pore was not the equilibrium density. This led to a lengthy study, described in the methods, where we found that it was difficult to establish that the water molecules were equilibrated in the pore using a two-box Gibbs ensemble Monte Carlo method to hydrate the pores. Future work should examine methods to create equilibrium hydrated silica nanopores at a given thermodynamic condition. This work is needed since it has been determined that the density changes with temperature within the silica nanopores.31 Complementary to creating improved methods to hydrate the pore, a study of the intermediate scattering functions as a function of density should also be performed. We also calculated the probability distribution of a tetrahedral order parameter to investigate if the center of the 30 Å pore was forming ice while the center of the 20 Å pore was not. We found a slight increase of the peak height of the tetrahedral order parameter for the 30 Å pore as compared to the 20 Å pore around a value that indicates more tetrahedral order, but it is unclear if this increased order could result in the observed change in the dynamics. Future studies would be needed to explore this behavior.
We found that the rotational-translational decoupling approximation had very little temperature dependence. Therefore, using this approximation for the analysis of QENS studies will result in a fairly temperature independent interpretation of the QENS results. We also found that the Rayleigh expansion for an isotropic fluid was an accurate description of the rotational motion at every temperature, despite the system being anisotropic.
ACKNOWLEDGMENTS
N.K., A.A.M., and B.M.L. gratefully acknowledge funding from the NSF CHE-1213682. E.F. gratefully acknowledges funding from the NSF CHE-1213682 and the NSF DMR-1608086. We thank Grzegorz Szamel for many important discussions and critical reading of the manuscript. We are sorry to acknowledge that Branka M. Ladanyi passed away before the research for this manuscript was complete.
REFERENCES
- 1.Cerveny S., Mallamace F., Swenson J., Vogel M., and Xu L., Chem. Rev. 116, 7608 (2016). 10.1021/acs.chemrev.5b00609 [DOI] [PubMed] [Google Scholar]
- 2.Amann-Winkel K., Böhmer R., Fujara F., Gainaru C., Geil B., and Loerting T., Rev. Mod. Phys. 88, 011002 (2016). 10.1103/revmodphys.88.011002 [DOI] [Google Scholar]
- 3.Angell C. A., Annu. Rev. Phys. Chem. 34, 593 (1983). 10.1146/annurev.pc.34.100183.003113 [DOI] [Google Scholar]
- 4.Takahara S., Nakano M., Kittaka S., Kuroda Y., Mori T., Hamano H., and Yamaguchi T., J. Phys. Chem. B 103, 5814 (1999). 10.1021/jp984136j [DOI] [Google Scholar]
- 5.Beck J. S., Vartuli J. C., Roth W. J., Leonowicz M. E., Kresge C. T., Schmitt K. D., Chu C. T. W., Olson D. H., Sheppard E. W., McCullen S. B., Higgins J. B., and Schlenker J. L., J. Am. Chem. Soc. 114, 10834 (1992). 10.1021/ja00053a020 [DOI] [Google Scholar]
- 6.Burris P. C., Laage D., and Thompson W. H., J. Chem. Phys. 144, 194709 (2016). 10.1063/1.4949766 [DOI] [PubMed] [Google Scholar]
- 7.Limmer D. T. and Chandler D., J. Chem. Phys. 137, 044509 (2012). 10.1063/1.4737907 [DOI] [PubMed] [Google Scholar]
- 8.Milischuk A. A. and Ladanyi B. M., J. Chem. Phys. 135, 174709 (2011). 10.1063/1.3657408 [DOI] [PubMed] [Google Scholar]
- 9.Milischuk A. A., Krewald V., and Ladanyi B. M., J. Chem. Phys. 136, 224704 (2012). 10.1063/1.4724101 [DOI] [PubMed] [Google Scholar]
- 10.Faraone A., Liu L., Mou C.-Y., Yen C.-W., and Chen S.-H., J. Chem. Phys. 121, 10843 (2004). 10.1063/1.1832595 [DOI] [PubMed] [Google Scholar]
- 11.Wang Z., Liu K.-H., Harriger L., Leao J. B., and Chen S.-H., J. Chem. Phys. 141, 014501 (2014). 10.1063/1.4885844 [DOI] [PubMed] [Google Scholar]
- 12.Liu L., Chen S.-H., Faraone A., Yen C.-W., and Mou C.-Y., Phys. Rev. Lett. 95, 117802 (2005). 10.1103/physrevlett.95.117802 [DOI] [PubMed] [Google Scholar]
- 13.Faraone A., Liu L., Mou C., Shih P., Copley J. R., and Chen S., J. Chem. Phys. 119, 3963 (2003). 10.1063/1.1584653 [DOI] [Google Scholar]
- 14.Bertrand C. E., Zhang Y., and Chen S.-H., Phys. Chem. Chem. Phys. 15, 721 (2012). 10.1039/c2cp43235h [DOI] [PubMed] [Google Scholar]
- 15.Gallo P., Rovere M., and Spohr E., J. Chem. Phys. 113, 11324 (2000). 10.1063/1.1328073 [DOI] [Google Scholar]
- 16.Gallo P., Rovere M., and Chen S.-H., J. Phys.: Condens. Matter 24, 064109 (2012). 10.1088/0953-8984/24/6/064109 [DOI] [PubMed] [Google Scholar]
- 17.Di Cola D., Deriu A., Sampoli M., and Torcini A., J. Chem. Phys. 104, 4223 (1996). 10.1063/1.471233 [DOI] [Google Scholar]
- 18.Bée M., Quasielastic Neutron Scattering (Hilger, Bristol, 1988). [Google Scholar]
- 19.Gulmen T. S. and Thompson W. H., MRS Proc. 899, 0899 (2005). 10.1557/proc-0899-n06-05 [DOI] [Google Scholar]
- 20.Luo R. S. and Jonas J., J. Raman Spectrosc. 32, 975 (2001). 10.1002/jrs.786 [DOI] [Google Scholar]
- 21.Hiramara Y., Takahaski T., Hino M., and Sato T., J. Colloid Interface Sci. 184, 349 (1996). 10.1006/jcis.1996.0629 [DOI] [PubMed] [Google Scholar]
- 22.Panagiotopoulos A. Z., Mol. Phys. 61, 813–826 (1987). 10.1080/00268978700101491 [DOI] [Google Scholar]
- 23.Panagiotopoulos A. Z., Quirke N., Stapleton M., and Tildesley D. J., Mol. Phys. 63, 527–545 (1988). 10.1080/00268978800100361 [DOI] [Google Scholar]
- 24.Martin M. G., Mol. Simul. 39, 1212–1222 (2013). 10.1080/08927022.2013.828208 [DOI] [Google Scholar]
- 25.Boulougouris G. C., Economou I. G., and Theodorou D. N., J. Phys. Chem. B 102, 1029 (1998). 10.1021/jp972582l [DOI] [Google Scholar]
- 26.Errington J. R., Kiyohara K., Gubbins K. E., and Panagiotopoulos A. Z., Fluid Phase Equilib. 150, 33 (1998). 10.1016/s0378-3812(98)00273-8 [DOI] [Google Scholar]
- 27.Vorholz J., Harismiadis V. I., Rumpf B., Panagiotopoulos A. Z., and Maurer G., Fluid Phase Equilib. 170, 203 (2000). 10.1016/s0378-3812(00)00315-0 [DOI] [Google Scholar]
- 28.Smith W. and Forester T. R., J. Mol. Graphics 14, 136 (1996). 10.1016/s0263-7855(96)00043-4 [DOI] [PubMed] [Google Scholar]
- 29.Allen M. P. and Tildesley D. J., Computer Simulation of Liquids (Oxford University Press, New York, 1987). [Google Scholar]
- 30.Berendsen H. J. C., Grigera J. R., and Straatsma T. P., J. Phys. Chem. 91, 6269 (1987). 10.1021/j100308a038 [DOI] [Google Scholar]
- 31.Zhang Y. et al. , Proc. Natl. Acad. Sci. U. S. A. 108, 12206 (2011). 10.1073/pnas.1100238108 [DOI] [PMC free article] [PubMed] [Google Scholar]
- 32.Bródka A., Mol. Phys. 82, 1075 (1994). 10.1080/00268979400100764 [DOI] [Google Scholar]
- 33.Bródka A. and Zerda T. S., J. Chem. Phys. 22, 6319 (1996). 10.1063/1.471292 [DOI] [Google Scholar]
- 34.Gulmen T. S. and Thompson W. H., Langmuir 22, 10919 (2006). 10.1021/la062285k [DOI] [PubMed] [Google Scholar]
- 35.Liu L., Faraone A., Mou C.-Y., Yen C.-W., and Chen S.-H., J. Phys.: Condens. Matter 16, S5403 (2004). 10.1088/0953-8984/16/45/007 [DOI] [Google Scholar]
- 36.Sears V. F., Neutron News 3, 26 (1992). 10.1080/10448639208218770 [DOI] [Google Scholar]
- 37.Sears V. F., Can. J. Phys. 45, 237 (1967). 10.1139/p67-025 [DOI] [Google Scholar]
- 38.Errington J. and Debenedetti P., Nature 409, 318 (2001). 10.1038/35053024 [DOI] [PubMed] [Google Scholar]
- 39.Chau P.-L. and Hardwick A. J., Mol. Phys. 93, 511 (1998). 10.1080/002689798169195 [DOI] [Google Scholar]


