Abstract
Both bimodal cochlear implant and bilateral hearing aid users can exhibit broad binaural pitch fusion, the fusion of dichotically presented tones over a broad range of pitch differences between ears [Reiss, Ito, Eggleston, and Wozny. (2014). J. Assoc. Res. Otolaryngol. 15(2), 235–248; Reiss, Eggleston, Walker, and Oh. (2016). J. Assoc. Res. Otolaryngol. 17(4), 341–356; Reiss, Shayman, Walker, Bennett, Fowler, Hartling, Glickman, Lasarev, and Oh. (2017). J. Acoust. Soc. Am. 143(3), 1909–1920]. Further, the fused binaural pitch is often a weighted average of the different pitches perceived in the two ears. The current study was designed to systematically measure these pitch averaging phenomena in bilateral hearing aid users with broad fusion. The fused binaural pitch of the reference-pair tone combination was initially measured by pitch-matching to monaural comparison tones presented to the pair tone ear. The averaged results for all subjects showed two distinct trends: (1) The fused binaural pitch was dominated by the lower-pitch component when the pair tone was either 0.14 octaves below or 0.78 octaves above the reference tone; (2) pitch averaging occurred when the pair tone was between the two boundaries above, with the most equal weighting at 0.38 octaves above the reference tone. Findings from two subjects suggest that randomization or alternation of the comparison ear can eliminate this asymmetry in the pitch averaging range. Overall, these pitch averaging phenomena suggest that spectral distortions and thus binaural interference may arise during binaural stimulation in hearing-impaired listeners with broad fusion.
I. INTRODUCTION
When two pure tones are presented dichotically, i.e., a tone of one frequency is presented to one ear simultaneously with another tone of a different frequency to the other ear, two auditory percepts are possible. Two distinct sounds could be perceived as separated with different pitches across the ears, or a single, possibly composite sound with a single pitch could be perceived, indicating binaural pitch fusion. Previous studies have shown that in normal-hearing listeners, two distinct sounds are perceived across the ears in most cases, with binaural pitch fusion occurring only for tones with small frequency differences of less than 0.1–0.2 octaves across the ears (Thurlow and Bernstein, 1957; Van den Brink et al., 1976; Reiss et al., 2016, 2017). The Van den Brink et al. (1976) study showed a correlation between the center of the binaural pitch fusion range and the amount of diplacusis, the interaural differences in pitch evoked by the same frequency tone. This suggests that binaural pitch fusion might be an adaptation to prevent the perception of diplacusis.
The fusion range is often broader in hearing-impaired listeners than in listeners with normal hearing. For bimodal cochlear implant (CI) users, who wear a CI in one ear and a hearing aid (HA) in the other ear, a single electrode can be fused with acoustic tones differing by as much as 3–4 octaves in pitch from that elicited by the electrode (Reiss et al., 2014). Bilateral HA users (i.e., HA users without a CI) can show similarly broad fusion ranges, fusing tones that differ between the ears by as much as 4 octaves (Reiss et al., 2016, 2017). In bimodal CI users, it was demonstrated that the perceived binaural pitch of the fused stimulus is often consistent with a weighted average of the original monaural pitches. Specifically, the weightings varied with the tone pair, with domination by the pitch perceived in one ear in some cases, and with clear averaging of the two monaurally elicited pitches in other cases (Reiss et al., 2014).
In the current study, fusion pitch weighting trends were investigated in bilateral HA users, specifically those with broad fusion ranges. Furthermore, various comparison ear conditions were tested in order to determine the effects of ear condition on asymmetries or biases in fusion pitch weighting trends.
II. METHODS
A. Subjects
These studies were conducted according to the guidelines for the protection of human subjects as set forth by the Institutional Review Board (IRB) of Oregon Health & Sciences University, and the methods employed were approved by that IRB. Nine bilateral HA users participated in the experiments. Seven female and two male subjects were included, ranging in age from 31 to 81 yrs old [mean and standard deviation (std) = 54.9 ± 7.6]. All subjects were screened for normal cognitive function using the Mini Mental Status Examination with a minimum score of 25 out of 30 required to qualify (Folstein et al., 1975; Souza et al., 2007). In addition, subjects selected for this study were required to have binaural fusion ranges broad enough to allow measurement of binaural pitch averaging trends across frequency; these include six subjects with broad fusion selected from a larger pool of subjects in a previous study (HI05, HI07, HI15, HI17, HI25, and HI32; Reiss et al., 2017) and three new subjects recruited specifically for the current study (HI27, HI33, and HI34). Their fusion ranges are described in detail in Sec. III A.
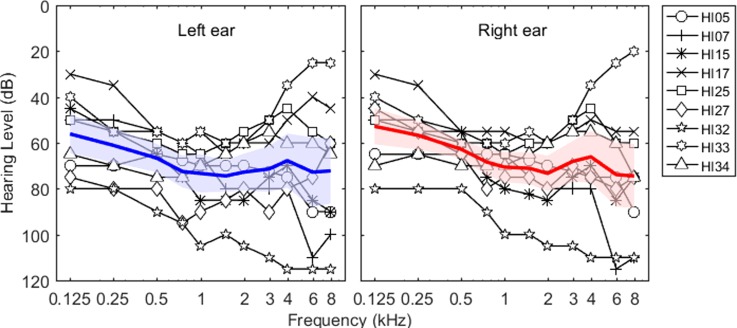
All subjects had a moderate to severe hearing loss in both ears, and the average audiometric thresholds were between 53 dB hearing level (HL) (std = ±7.9) and 75 dB HL (std = ±14.1) at frequencies (0.125–8 kHz). All subjects had normal middle ear function as defined by 0.226-kHz tympanometry and air-bone gaps of 10 dB or less. All subjects had relatively symmetric losses between ears and flat hearing loss across frequency, except for subjects HI07 and HI32 who had a sloping pattern (more high frequency loss) and subject HI33 who had a reverse slope (better thresholds at high frequencies than low frequencies). Detailed audiograms are shown for left and right ears for all subjects in Fig. 1.
FIG. 1.
(Color online) Audiograms for the left ears (left panel) and the right ears (right panel) of the nine subjects. Solid thin lines show individual thresholds for all subjects. Solid thick lines and shaded areas represent averaged thresholds and standard deviations, respectively.
All subjects were paid an hourly wage and completed all experiments in between eight to 15 sessions of 2–3 h each. No prior experience with psychoacoustic research was required for participation; however, practice tutorials were provided to assure familiarity with the procedure and signals.
B. Stimuli and procedures
All experiments were conducted in a double-walled, sound attenuated booth. Signals were generated at a sampling rate of 44.1 kHz with Matlab (version R2010b), processed through an ESI Juli sound card, TDT PA5 digital attenuator and HB7 headphone buffer, and presented over Sennheiser HD-25 headphones. Each headphones frequency response was equalized using calibration measurements obtained with a Brüel & Kjær sound level meter with a 1 in. microphone in an artificial ear.
All stimuli consisted of sinusoidal pure tones with 10-ms raised-cosine onset/offset ramps. Prior to all experiments, loudness balancing was conducted for a subset of test frequencies (0.125, 0.175, 0.25, 0.375, 0.5, 0.625, 0.75, 0.875, 1, 2, 3, and 4 kHz) using a method of adjustment. First, 300-msec tones were initialized to “medium loud and comfortable” levels corresponding to a 6 or “most comfortable” on a visual loudness scale from 0 (no sound) to 10 (too loud). Loudness was then adjusted for each frequency to be equally loud to a tone in the left ear at 500 Hz during sequential presentation within or across the ears, based on subject feedback. The frequencies and order of presentation were randomized to minimize the effect of biases such as time-order error and overestimation of the loudness for high-frequency tones (Florentine et al., 2011). Adjustments were repeated with 0.1 dB steps until equal loudness was achieved with all comparison sequences within and across ears. Loudness could be balanced at all frequencies for all subjects except HI32, for whom 3 and 4 kHz could not be presented at a high enough level to be audible and comfortably loud, and so were not used in testing for that subject. This loudness balancing procedure was performed to minimize use of level-difference cues and maximize focus on pitch differences as the decision criteria.
Interpolation (on a dB scale) was then used to determine appropriate levels for additional tone frequencies sampled in between these loudness-balanced frequencies. The average comfortable sound levels across subjects and tone frequencies were 90.8 dB sound pressure level (SPL) (std = ±6.6) for the left ear and 91.1 dB SPL (std = ±5.7) for the right ear (Supplementary Fig. S1)1.
Moreover, upper limit frequencies for detection of interaural phase differences (IPDs) were measured by using a rapid, adaptive IPD test (Grose and Mamo, 2010) in order to determine the frequencies at which binaural beat cues were present and would potentially interfere with the fusion task; for all subjects, the IPD thresholds were lower than all of the reference frequencies used in this study (mean and std = 497 ± 305 Hz). Detailed procedures for the IPD test have been described previously in Reiss et al. (2017).
Stimuli were presented bilaterally in a set of three experiments: interaural pitch matching, dichotic fusion range measurement, and fusion pitch matching. In this set of experiments, one ear was designated as the “reference ear” to which reference tone frequencies were presented. The reference ear was chosen randomly for each subject, and fixed for the duration of the experiment. Note that in the fusion pitch match experiment, the reference ear differed from the “reference stimulus” which was presented dichotically to both ears. Comparison tones were presented to the contralateral ear in the pitch matching and fusion range experiments, and to either ear in the fusion pitch matching experiment.
Reference frequencies were fixed at 1, 2, and 3 kHz, and comparison tone frequencies were varied in 1/4 octave steps within the range of 0.25 and 4 kHz (i.e., a total of 17 frequencies). Note that one subject (HI32) was tested using a different set of reference and comparison tone frequencies (reference frequencies at 0.375, 0.75, and 1.25 kHz and comparison frequencies between 0.125 and 2 kHz) due to limited residual hearing above 2 kHz. In a fourth experiment, measurement of the frequency discrimination limen (FDL), stimuli were presented monaurally to both ears using the same frequencies as above.
All experiments except the FDL and IPD procedure used a constant-stimulus procedure to compute the 25%, 50%, or 75% point on subject's response functions, which were generated from the average of the responses at six repeats of the same pairs of the reference and comparison tones (i.e., a total of 102 trials for each run). A 1-up, 2-down adaptive procedure (Levitt, 1971) was used for the FDL procedure to determine a threshold at the 71% correct response. The results for all experiments were averaged across two separated runs for each condition as described below.
1. Interaural pitch matching
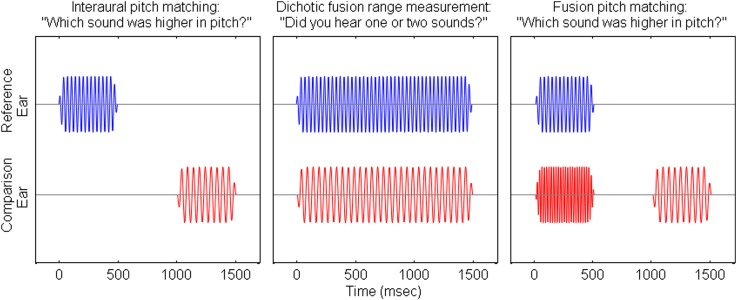
A 2-interval, 2-alternative forced-choice (2I-2AFC) constant-stimulus paradigm was used to estimate pitch match psychometric functions. Reference and comparison stimuli were each 500 ms in duration and separated by a 500-ms interval, with interval order randomized (see left panel in Fig. 2). The reference stimulus was held constant in the reference ear, and the comparison stimulus was presented in the contralateral ear with pseudorandom sequences across trials. In each trial, subjects were asked to select which interval had the higher pitch. The psychometric functions were generated from the average of the responses at six repeats of the same pairs of the reference and comparison tones.
FIG. 2.
(Color online) Schematics of the stimuli used for the three different tasks, along with the questions presented to subjects for each task. The reference ear stimulus is shown at the top and the contralateral ear stimulus is shown at the bottom for each task, representing stimuli presented in a single trial presentation. Interaural pitch matching task, dichotic fusion range measurement, and fusion pitch matching task are shown in the left, middle, and right panels, respectively.
2. Dichotic fusion range measurement
Both reference and dichotic comparison tones were presented simultaneously in a 1500-ms single interval, two-alternative forced-choice (1I-2AFC) task, in which subjects were asked to indicate whether they heard a single fused sound or two different sounds in each ear (see middle panel in Fig. 2). Similar to the pitch matching experiment, the reference stimulus was held constant in the reference ear, and the comparison tone frequencies were presented in the contralateral ear and pseudo-randomly varied at each trial. Multiple presentations (six repeats) of the same reference and comparison tone pairs were provided. The average of the subject's responses of the multiple stimulus pairs formed the fusion function, with a value of 0 indicating frequencies over which two sounds were heard, and a value of 1 indicating frequencies over which one sound was heard. Two subjects (HI07 and HI25) repeated the fusion range measurement with the reference ear switched to investigate possible asymmetries in fusion range measurements between the ears.
3. Fusion pitch matching
The procedure for the fusion pitch matching measurement was a 2I-2AFC task similar to that used for the interaural pitch matching measurement, except that a fused dichotic stimulus was presented as the reference stimulus (see right panel in Fig. 2). That is, the reference stimulus in this task consisted of a “reference tone” in the reference ear presented simultaneously with a “pair tone” in the contralateral ear. The pair tone frequencies were selected to sample approximately linearly spaced intervals within the subject's fusion range (four to eight inharmonic frequencies), and outside ±1 standard deviation of the 50% point of the pitch match. This reference stimulus, i.e., the reference and pair tone frequency, was fixed for each run. A third tone, the comparison tone, was presented to the contralateral ear sequentially with the reference stimulus, with frequency varied pseudo-randomly across trials. All stimuli were 500 ms in duration, and the reference stimulus and comparison stimulus were separated by a 500-ms inter-stimulus interval, with interval order randomized. Subjects were asked to choose the stimulus with the higher pitch. Psychometric functions were generated similarly as for the interaural pitch matching measurement.
4. Frequency discrimination limen measurement
Tones of 400-ms duration were presented in each of three intervals in a three alternative forced choice adaptive paradigm. The first interval was used as the reference stimulus, and the interval containing the different tone was randomly selected from the second and third intervals. Subjects were instructed to determine whether the second or third interval differed from the first interval. Two frequency discrimination tasks were interleaved with different initial frequencies: one octave above and one octave below the reference frequency. The size of the frequency difference was reduced by a factor s after two consecutive correct responses, and was increased by the same factor after an incorrect response. Here, the value of s was initially set at 2, and was reduced to 1.41 after the initial two reversals (Wier et al., 1977). Each run continued until there were a total of eight reversals, with the first two reversals discarded. The threshold was estimated as the geometric mean of the last six reversals.
III. RESULTS
A. Binaural pitch fusion ranges and FDLs
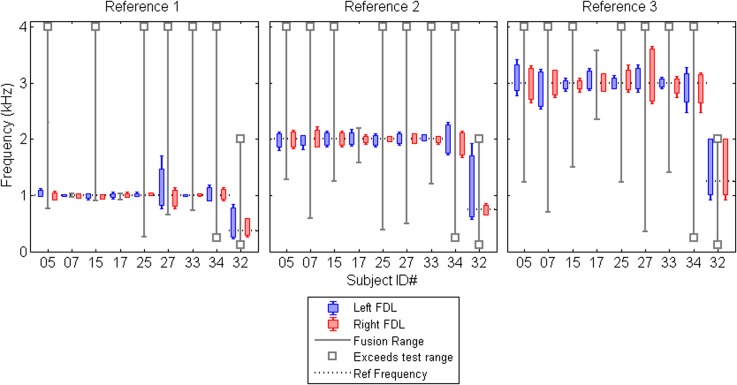
Figure 3 shows the fusion ranges (solid vertical lines) by subject, with the left, middle, and right panels showing results for reference frequencies of 1, 2, and 3 kHz, respectively. Most subjects exhibited broad fusion ranges (mean and std = 2665 ± 1096 Hz or 2.80 ± 1.03 octaves) across all reference frequencies, with the exception of subjects HI07 and HI17. The lower boundaries of the fusion ranges for subjects with broad fusion varied from 34 Hz (0.05 octaves) to 2750 Hz (3.58 octaves) below the reference frequencies, and the upper boundaries were at least at the maximum frequency limits used in the experiment (4 kHz for all subjects with broad fusion except HI32; 2 kHz for HI32 due to limited hearing above 2 kHz).
FIG. 3.
(Color online) Individual fusion range results (solid lines) and frequency-discrimination limens (filled boxes) plotted by subject; each panel shows results for one reference frequency. Horizontal dotted lines in each panel represent the reference frequencies (0.375, 0.75, and 1.25 kHz for subject HI32 and 1, 2, and 3 kHz for the other eight subjects). Vertical solid lines indicate fusion ranges, and the open squares at the top and bottom of each line indicate that fusion ranges may exceed the upper or lower limits of the frequency range tested, respectively. Filled boxes to the left and right of the fusion range results (solid lines) show FDLs in the left and right ears of each subject, respectively. Error bars at the top and bottom of the filled boxes indicate standard deviations of FDLs around the mean thresholds above and below the reference frequencies, respectively.
Subjects HI07 and HI17 had fusion ranges that varied with reference frequency. Both subjects had narrow fusion ranges at the 1-kHz reference frequency (64 and 115 Hz or 0.09 and 0.18 octaves for HI07 and HI17, respectively). At higher reference frequencies, HI07 had broad fusion ranges (3404 Hz or 2.75 octaves at 2 kHz and 3305 Hz or 2.52 octaves at 3 kHz), and HI17 had fusion ranges that were slightly broader than at 1 kHz (615 Hz or 0.48 octaves at 2 kHz and 1225 Hz or 0.61 octaves at 3 kHz). Note also that HI17 had better low-frequency thresholds (Fig. 1), and both HI07 and HI17 had lower sound presentation levels at the low frequencies (Supplementary Fig. S11), suggesting a possible effect of level on fusion. This is consistent with correlations of real-ear measurements with fusion range found previously, though those correlations disappeared when demographic factors were controlled for (Reiss et al., 2017).
The measured FDLs for the left and right ears in Fig. 3 (the filled boxes to the left and right of the solid vertical lines, respectively) show that broad fusion ranges are not explained by poor spectral resolution within the ear. Most of the subjects had reasonably good within-ear frequency discrimination ability (31–518 Hz or 0.04–0.36 octaves) at each of the reference frequencies, which was much narrower than the corresponding fusion ranges. Only subjects HI27 and HI32 showed relatively poor discriminability as well as asymmetry in FDL across ears, but their FDLs were still narrower than their fusion ranges. No correlations were seen between fusion range width and FDLs or FDL differences between the ears (p > 0.9, Pearson 2-tailed correlation test).
B. Binaural pitch averaging within the fusion range
A fusion pitch matching procedure was used to measure the pitch evoked by each fused tone pair. Each fused tone pair consisted of a tone at the reference frequency in the reference ear and a tone at a pair frequency in the contralateral ear (selected from within the fusion range for that reference frequency, as required for the tone pair to be fused). Fused tone pairs were pitch-matched to comparison tones presented monaurally to either ear. First we describe fusion pitch matching results obtained using comparison tones presented to the ear contralateral to the reference ear.
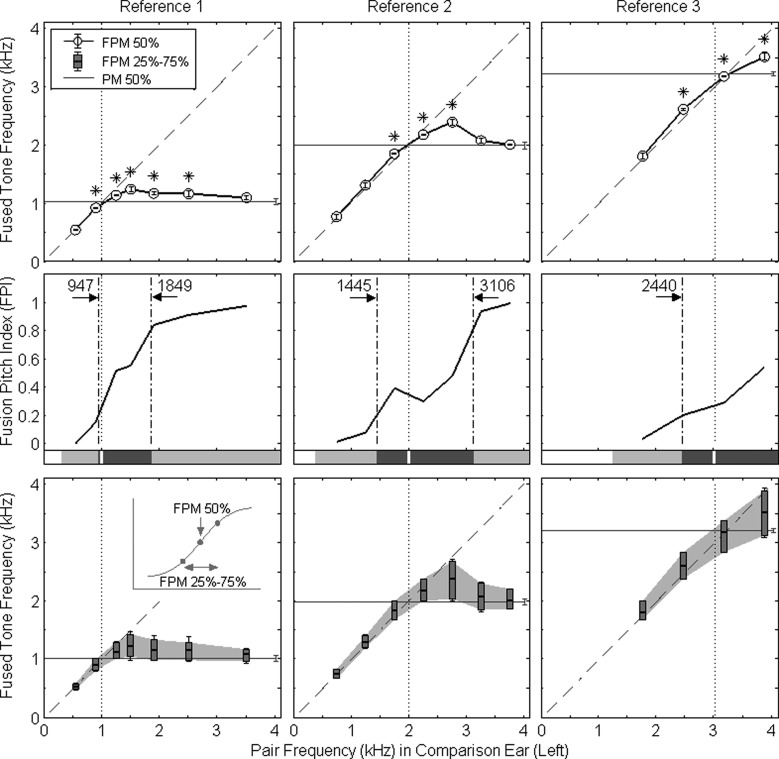
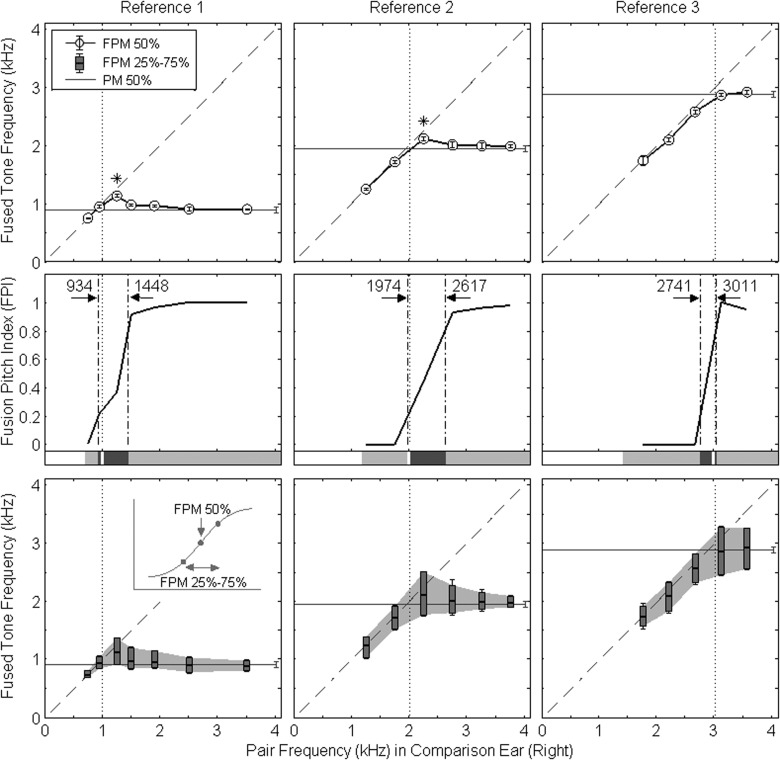
Binaural pitch averaging, in which fused binaural pitch is a weighted average of the pitches elicited under monaural presentation, was observed in all subjects, but there was individual variation in the pitch averaging range. Figure 4 shows examples of binaural pitch averaging trends for subject HI25. Each of the upper panels shows the fusion pitch matches as a function of pair tone frequency (solid line with open circles, with each circle corresponding to the 50% point on the psychometric function obtained for that fusion pitch match). The results for the reference frequencies of 1, 2, and 3 kHz are shown in the top left, middle, and right panels, respectively. The dashed 1:1 line represents the pair frequency, such that points on this line indicate that the fusion pitch match was dominated by the pair frequency. The horizontal solid line represents the reference tone pitch match 50% point, such that points on or near this line indicate that the fusion pitch match was dominated by the reference pitch match. The vertical dotted line shows the reference frequency on the pair frequency axis. Points falling between the diagonal dashed line and the horizontal solid line indicate averaging of the pitches evoked monaurally by the pair and reference tones.
FIG. 4.
Example fusion pitch match results for subject HI25. Each column shows results for one reference frequency. In the upper panels, the 50% points of the fusion pitch match functions (open circles; see legend inset in top left panel) along with the standard deviations (overlaid vertical lines) are shown. Note that the error bars are smaller than the symbol size. Solid horizontal lines show the interaural pitch match 50% points, with standard deviations shown as error bars at the right end of the horizontal lines. Asterisks indicate pitch averaging, i.e., no overlap with either the pitch match 50% point or the pair-tone frequency. Diagonal dashed lines indicate the 1:1 relationship between the pair frequency and pitch-matched frequency. In the middle row panels, FPIs [see Eq. (1)] are shown as a solid line. Vertical dashed dotted lines indicate the lower (20%) and upper (80%) limits of the pitch averaging range. The 80% upper limit for the 3-kHz reference was not shown due to the limit on the frequency range tested (right middle panel). Shaded bars below the FPI functions indicate the pitch averaging trend, with the thin vertical white line indicating the reference frequency, dark gray shading indicating pitch averaging, and light gray shading indicating lower pitch dominance. In the bottom panels, the 25%–75% range of the fusion pitch match functions (shaded boxes; see legend inset in top left panel) along with standard deviations (error bars) are shown. The horizontal lines inside the boxes show the 50% points. A sample psychometric function in the left bottom panel illustrates the locations of the 50% point and 25%–75% range on the psychometric function.
Two trends are apparent from these plots. For pair frequencies below the reference frequency, the fusion pitch match was on the dashed line, indicative of dominance by the pair tone pitch. For pair frequencies far above the reference frequency, the fusion pitch match was on the horizontal solid line and close to the pitch match, indicative of dominance by the reference tone pitch; both trends were apparent for the 1- and 2-kHz reference frequencies (top left and middle panels), but only the first trend was apparent for the 3-kHz reference frequency (top right panel) as higher frequencies could not be tested. These trends suggest dominance by the lower frequency component of the pair when the components are far apart.
However, for pair frequencies just above the reference frequency, the fusion pitch match was between the dashed line and the horizontal solid line (significant differences from both indicated by asterisks). Thus, for these pair frequencies, the fused tone pitch was an average of the original pitches perceived in either ear alone, with no overlap of the fused tone pitches (open circles) with either the pitch match (solid line) or the paired tone frequency (dashed line). This suggests that averaging occurs when the components are closer together. Note also that with this paradigm, pitch averaging occurred asymmetrically around the reference frequency. In other words, pitch averaging occurred for pair tones above the reference frequency, rather than in a range centered around the reference frequency.
In order to quantify the pitch averaging range, a fusion pitch index (FPI) was applied (Reiss et al., 2014). The FPI is defined as the absolute value of the difference between the fused tone pitch 50% points and the pair-tone frequency, in Hertz, normalized by the difference between the pitch match 50% point and the pair frequency:
| (1) |
Here, the FPI approaches a value of 0 or 1 when the fused tone pitch is close to the paired tone pitch or the pitch match, respectively (i.e., dominance of the lower pitch). FPI values between 0 and 1 reflect pitch averaging between ears. The middle row panels in Fig. 4 show the FPI values as a function of pair frequency. The increase in FPI from 0 to 1 from left to right indicates increased weighting toward the reference tone pitch match with increased pair frequency. The 20% to 80% points on the FPI functions (marked by vertical dashed-dotted lines) are a quantitative measure of the boundaries of this averaging region. Overall, the quantitative representation of the fusion pitch results using the FPI boundaries also demonstrate the asymmetry of pitch averaging trend around the reference frequencies (see shaded bars at bottom of each panel, with dark gray indicating pitch averaging, light gray indicating lower pitch dominance, and the white bar indicating the reference frequency).
Note the slight fluctuation in the middle of the FPI function for the 2-kHz reference frequency (middle panel); this fluctuation is due to the small denominator values in Eq. (1) that arise when the pair frequency is close to the reference frequency. Note also that the upper boundary for the reference of 3 kHz was not measured due to the 4 kHz upper frequency limit.
The bottom panels in Fig. 4 show how the slopes or steepness of the fusion pitch match psychometric functions varied as a function of pair frequency. The measure plotted is the range between the 25% and 75% points on the psychometric function (box plots and shaded region), with the height of each box inversely proportional to the function slope. This means that the short boxes indicate steep slopes and the tall boxes indicate shallow slopes (see schematic for the 50% point and 25%–75% range in the fusion pitch match psychometric function represented in the bottom left panel). The 25%–75% ranges were largest (slopes were shallowest) in the same pair frequency regions over which pitch averaging was observed, i.e., for the region just above the reference frequency (asterisks in the upper panels and region between the dashed-dotted lines in the middle panels). Note that the asymmetry of these shallow slope regions is similar to that seen for the pitch averaging regions, with respect to the reference frequency. Moreover, the pair frequencies with the widest 25%–75% ranges (shallowest slopes; bottom panels) were roughly aligned with the pair frequencies at the 50% points on the FPIs (middle row panels).
Figure 5 shows examples of narrower binaural pitch averaging trends for another subject, subject HI33, plotted similarly as in Fig. 4. For this subject, pitch averaging occurred at only one pair-tone frequency for the reference frequencies of 1 and 2 kHz (asterisks in upper left and middle panels); no averaging was observed for the 3-kHz reference (upper right panel). Consistent with the narrower pitch averaging regions, the FPI functions also showed relatively fast transitions (from 0 to 1 for the FPI) of the fused tone pitch from the pair frequency to the reference frequency pitch match as a function of pair frequency (solid lines in middle row panels). The 25%–75% ranges of the fusion pitch match functions were maximized (slopes were shallowest) when the pair frequencies were just above the reference frequency (box plots in bottom panels). As in the previous example, asymmetry in weighting was observed, such that the pitch averaging region and shallow slope region both occurred for pair frequencies above the reference frequency.
FIG. 5.
Example fusion pitch match results for subject HI33. Plotted as in Fig. 4. As shown in the upper and middle panels, the pitch averaging ranges are narrower than those for subject HI25 for all reference frequencies.
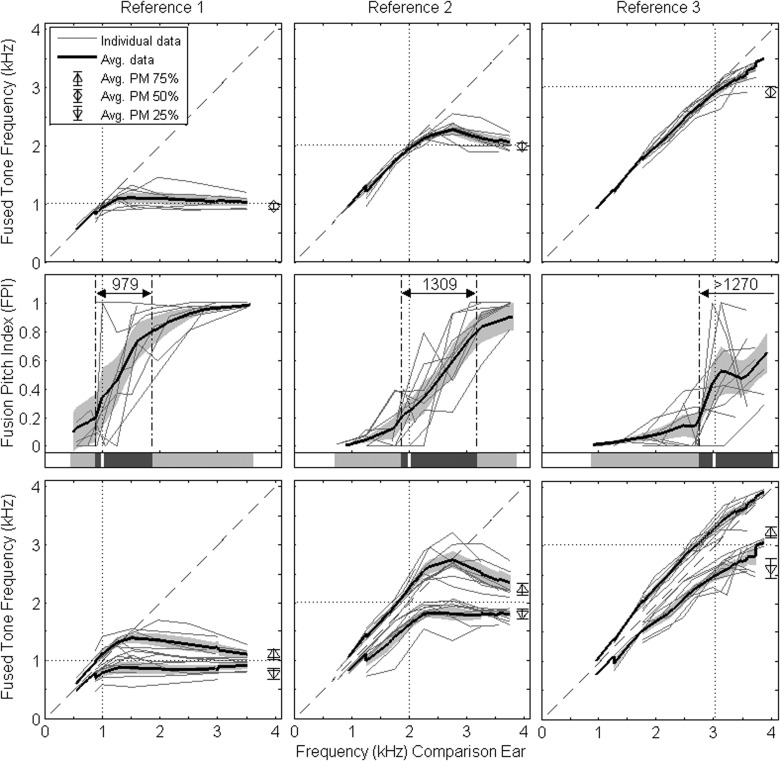
The population results are shown in Fig. 6, as plots of individual (thin lines) and group-averaged results (thick lines), plotted in a similar format as Figs. 4 and 5, except with the averaged interaural pitch match results indicated by different symbols (75%, 50%, and 25% points with open triangles, diamond, and upside-down triangles, respectively). The results for subject HI32 are not shown here due to the difference in the reference frequencies used in the experiments, even though similar fusion pitch matching trends occurred in HI32's results (Supplementary Fig. S21). Clearly, the trends seen for the fusion pitch match, FPI, and fusion pitch match slopes follow similar trends for all subjects and resemble those seen in the individual examples; however, the pitch averaging regime is less apparent in the group-averaged data (especially for the lowest reference frequency) due to individual variability. Based on the FPI functions, the group-averaged fusion pitch match was aligned with the dashed line for pair frequencies at or below 118, 136, and 270 Hz (0.18, 0.10, and 0.14 octaves) lower than the reference frequencies of 1, 2, and 3 kHz, respectively. For pair frequencies at or above 861 and 1173 Hz (0.90 and 0.67 octaves) higher than the 1- and 2-kHz references, respectively, the fusion pitch match was close to the pitch match (open diamond). Both cases indicate dominance by the lower frequency component, i.e., the pair tone pitch for the former case, and the reference tone pitch for the latter case.
FIG. 6.
Average fusion pitch match results for all subjects. In each panel, the solid thick line with the shaded area indicates the mean with standard deviation for all subjects, and thin solid lines show individual data. As in Figs. 4 and 5, the 50% points of the fusion pitch match functions and the FPIs are shown in the upper and middle panels, respectively. In the upper panel, open diamonds with error bars represent the average of the interaural pitch match 50% point with the standard deviation. In the bottom panel, the 25% (lower lines) and 75% (upper lines) points are represented separately as lines instead of box plots, and open triangles and upside-down triangles with error bars represent the average of the interaural pitch match 75% and 25% points with the standard deviation. Both the vertical and horizontal dotted lines indicate the reference frequencies on the reference and paired ear axes, respectively.
Pitch averaging generally occurred between these boundaries with averaging ranges (quantified as the ranges between the 20% to 80% points on the FPI functions) of 979, 1309, and ≥1270 Hz (1.08, 0.77, and ≥0.55 octaves) for the 1-, 2-, and 3-kHz references, respectively. Note again the asymmetry of the averaging ranges around the reference frequency (offset of gray shaded region from white bars in middle row panels of Fig. 6). Similarly, the averaged 25% to 75% ranges of the fusion pitch match functions (averaged data shown as two sets of thick solid lines and individual data as thin lines, instead of as box plots in the bottom panels) showed the shallowest slopes within the pitch averaging region (differences between the thick solid lines).
C. Effect of alternating and randomizing the comparison ear on pitch averaging
The asymmetry in both the pitch averaging region and the shallow slope region may be due to a subject response bias toward one ear induced by the fusion pitch matching procedure. Specifically, in the fusion pitch matching procedure, the presentation of a constant stimulus in the reference ear over all trials might somehow result in habituation leading to a subject response bias toward the opposite paired ear with the pair tone, in which the comparison stimuli vary from trial to trial. In this section, the effects of alternating or randomizing the comparison ear, and thus the ear presented with variable stimuli, on response bias are described.
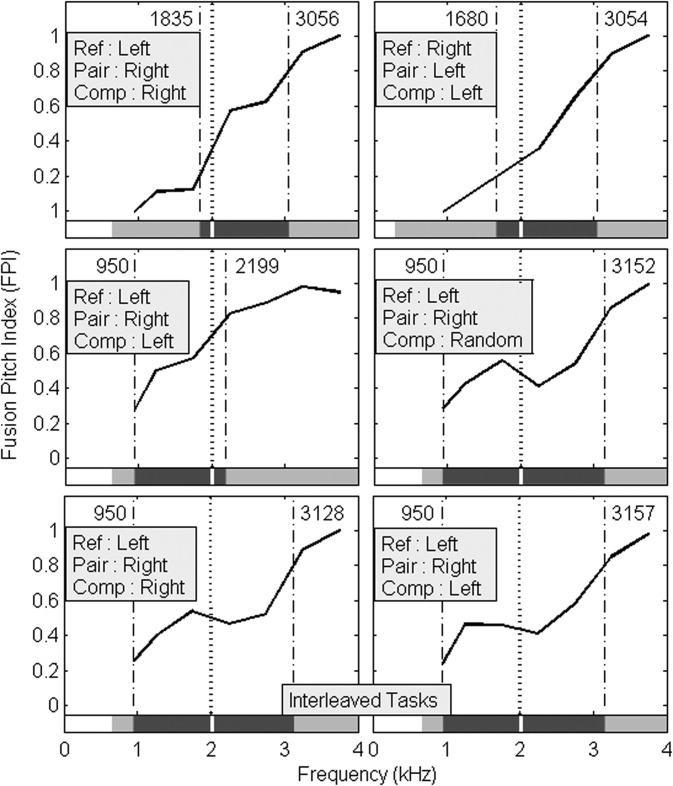
The effects of varying the comparison ear for a reference frequency of 2 kHz are shown for subject HI07 in Fig. 7. The upper two panels in Fig. 7 show the FPI results obtained using the original fusion pitch matching procedure, with the right ear as the reference ear and left ear as pair and comparison ear (upper left panel), or with the left ear as the reference ear and right ear as the pair and comparison ear (upper right panel). In these cases, i.e., when the comparison tones were presented in the ear opposite to the designated “reference” ear, the pitch averaging range was shifted, as seen previously in Figs. 4–6, toward pair frequencies (region between dashed-dotted lines) above the 2-kHz reference frequency (dotted lines). In contrast, when the comparison ear was the same as the reference ear, the pitch averaging range was shifted toward the pair frequencies below the 2-Hz reference frequency (left-middle panel). Then, when the comparison ear was randomly varied, these pitch averaging biases were diminished with the pitch averaging region centered on the reference frequency (right-middle panel).
FIG. 7.
Effect of varying the comparison ear on pitch averaging ranges for the reference frequency of 2 kHz for subject HI07. Each panel shows FPI functions (solid lines) for a given condition, with vertical dashed-dotted and dotted lines indicating the 20%–80% points and reference frequency, respectively. Upper panels: FPI functions estimated based on measurements with the comparison ear opposite to the reference ear. The reference ear (and thus the comparison ear) was switched from the left to the right panel. Middle row panels: FPI functions estimated when the comparison tones were presented in the reference ear (left panel) or randomized between ears (right panel). Bottom panels: FPI functions estimated based on two interleaved measurements, with the two measurements plotted separately in each panel. The reference and comparison ear conditions are given in the text box in each panel.
To further verify this reduced subject response bias seen in the randomized comparison ear condition, two interleaved fusion pitch matching tasks were used, i.e., two interleaved sets of stimuli were used with the comparison tone presented alternately in the opposite side or in the same side of the reference ear. The responses to these interleaved tasks were analyzed separately as for the equivalent non-interleaved tasks (shown in the left and right bottom panels, respectively). As seen in the bottom two panels of Fig. 7, and similar to the randomized condition, when the tasks were interleaved, the fusion pitch averaging occurred symmetrically around the reference frequency of 2 kHz (i.e., between ∼950 Hz below and ∼3140 Hz above 2 kHz). Thus, by randomizing or simply alternating the comparison ear, response bias was minimized and a symmetric pitch averaging range obtained.
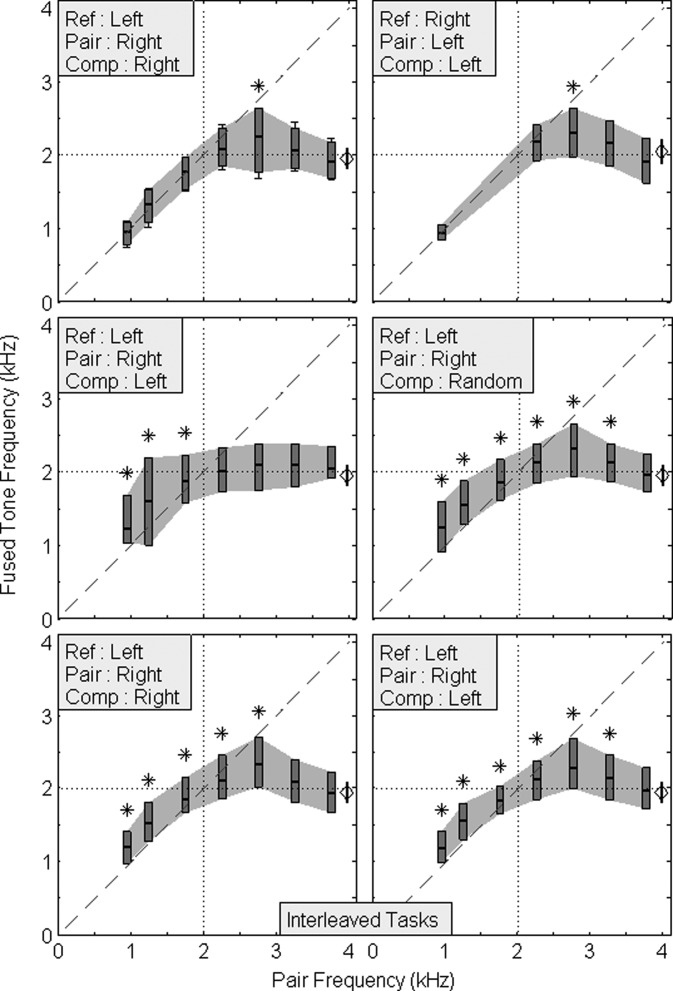
Figure 8 shows similar effects of comparison ear condition on the asymmetry of the shallow psychometric function slope regions for this same subject. The maximum 25%–75% range (shallowest slope) regions were shifted from higher to lower pair frequencies re: the 2-kHz reference when the comparison ear was changed from contralateral to ipsilateral to the reference ear, respectively (asterisks in the upper two panels versus the left-middle panel). When the response bias was reduced via randomization or interleaving of the comparison ear, the psychometric function 25%–75% ranges (slopes) were approximately equalized across all pair tone frequencies, and the pitch averaging occurred symmetrically around the reference frequency (right-middle and bottom two panels). Note that HI25 shows an asymmetry or pitch averaging bias toward the comparison ear and a similar effect of randomization or interleaving on reducing this asymmetry (Supplementary Figs. S3 and S41).
FIG. 8.
Effects of varying the comparison ear on the 25%–75% ranges (slopes) of the fusion pitch match functions for the reference frequency of 2 kHz for subject HI07. Each panel shows the fusion pitch match function 25%–75% range (shaded boxes) with standard deviations (error bars), plotted as in the bottom panels of Fig. 3. The panels are laid out with the same conditions as in Fig. 7. The horizontal solid lines inside the boxes show the fusion pitch match 50% points. Again, asterisk symbols indicate the pitch averaging regions of no overlap with either the pitch match or the paired-tone frequencies. The reference and comparison ear conditions are given in the text box in each panel.
D. Effect of switching the reference ear on fusion range
As described in Sec. II A, most of the subjects that participated in the current study exhibited broad fusion ranges around the reference frequencies. Subjects HI07 and HI17 had fusion range trends that differed from the rest of the subjects, i.e., asymmetric fusion ranges around the reference and relatively narrow fusion ranges, respectively. These fusion range results could, however, be influenced by choice of reference ear. Thus, to further investigate the effect of reference ear choice on the fusion range, fusion range measurements were also conducted with the reference ear switched in two representative subjects (HI07 and HI25).
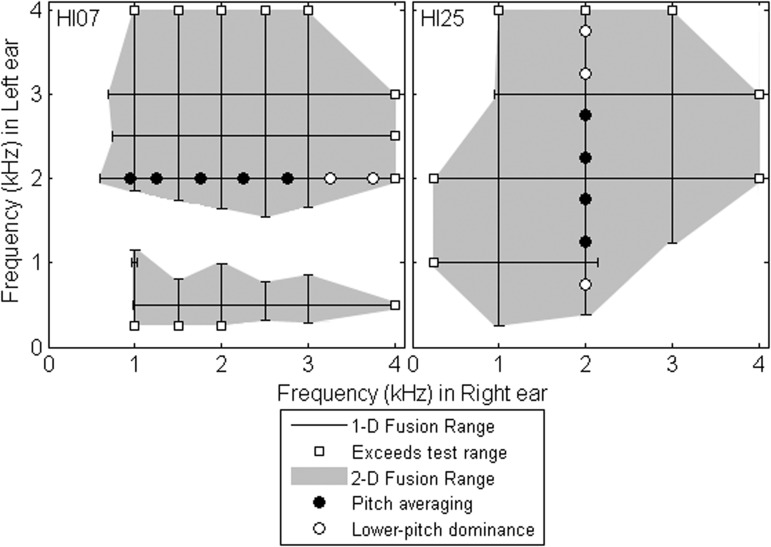
Figure 9 shows two-dimensional representations (shaded areas) of the fusion range results obtained for both reference ear conditions. Here, the vertical and horizontal lines in each panel show fusion ranges obtained with the right and left ears as the reference, respectively. In the case of subject HI25 (right panel), switching the reference ear (i.e., from right to left ear) also resulted in broad fusion ranges around the reference frequencies of 1, 2, and 3 kHz. On the other hand, HI07 (left panel) had very different fusion ranges when the reference ear was switched (i.e., from left to right ear). When the reference ear was the left ear, fusion ranges were generally broad. However, when the reference ear was switched to the right ear, two separate fusion ranges were observed. These two fusion ranges were separated by a gap of no fusion of any frequencies in the right ear with frequencies around 1.5 kHz in the left ear. Note the higher sampling resolution of reference frequencies tested (0.5-kHz steps from 0.5 to 3 kHz) used for HI07 to show detailed fusion range results around 1 kHz in the left ear.
FIG. 9.
Two-dimensional representations of fusion ranges collected in separate trials with the left or right ear as the reference. Vertical lines show fusion ranges obtained with the right ear as the reference. Horizontal lines show fusion ranges obtained with the left ear as the reference. Data are shown for HI07 (left panel) and HI25 (right panel). Again, open square symbols indicate the upper and lower frequency limits of the frequency range tested. Shaded regions show “fusion areas” which are demarcated by the upper and lower boundaries of the fusion ranges. Any dichotic frequency pairs within the fusion area may be perceived as one sound. Filled and open circles indicate the pair frequencies for which pitch averaging and lower-pitch dominance were observed, respectively. Only data obtained with interleaved tasks are shown.
The two fusion pitch match trends of pitch averaging (filled circles) and lower-pitch dominance (open circles) are also illustrated in this two-dimensional representation of the fusion range in Fig. 9. Note that only the unbiased fusion pitch averaging results obtained using the interleaved procedure around the 2-kHz reference (bottom panels in both Fig. 7 and Supplementary Fig. S3 for HI07 and HI25, respectively) are shown.
IV. DISCUSSION
A. Binaural pitch averaging trends within the fusion range
This study provides the first quantitative measurement of binaural pitch averaging phenomena in bilateral HA users with broad binaural pitch fusion. Two distinct pitch averaging trends were observed: domination of the lower-pitch component between the original monaural pitches, and clear pitch averaging of the two monaural pitches. This finding is qualitatively consistent with previous findings in an analogous population, bimodal CI users (Reiss et al., 2014).
One possible explanation for the lower pitch dominance (the first trend for the fused binaural pitches) could be the relatively better thresholds in the lower frequencies (threshold differences of 11 ± 14 dB and 13 ± 17 dB between 0.25 and 4 kHz for the left and right ear, respectively). Even though loudness and audibility were controlled for, the differences in threshold and thus sound level needed to provide audibility may still affect the relative weighting of pitch averaging. However, no significant correlation was seen between the pitch averaging range, which was averaged across reference frequencies, and this threshold or level difference between 0.25 and 4 kHz in the reference and comparison ear (p > 0.5 and p > 0.7 for the correlation with threshold differences in the reference and comparison ear, respectively, p > 0.1 and p > 0.3 for the correlation with level differences in the reference and comparison ear, respectively, Pearson 2-tailed correlation test), suggesting that neither threshold nor sound level is a major factor in determining the fused binaural pitch weighting.
Another possibility considered was that better thresholds at lower frequencies could be associated with better frequency resolution, which could lead to greater weighting of the more reliable (better resolution) signal if the brain is a statistical optimizer as suggested by studies of multisensory integration (Hillis et al., 2002). Cochlear hearing loss and broadening of the excitation pattern may lead to poor frequency discrimination (Moore, 1996). As in multisensory integration, the fused binaural pitch could be weighted more toward the ear with the better frequency discrimination and thus greater reliability. However, the fusion pitch results were not significantly correlated with differences between FDLs at each ear (p > 0.7, Pearson 2-tailed correlation test). Note that the FDLs were measured in this study only for the reference frequencies of 1, 2, and 3 kHz (0.375, 0.75, and 1.25 kHz for HI32). Future study using FDLs around the all test frequencies (0.125–4 kHz) would be helpful to fully rule out spectral resolution effects on binaural fusion pitch weighting.
B. Effects of alternating or randomizing the comparison ear on pitch averaging
An interesting finding of the current study is that the pitch averaging trends varied depending on the comparison ear used. The overall trend was that the pitch averaging was biased toward the ear used to make the pitch comparisons, i.e., the pitch averaging range was biased toward the pair frequency when the comparison stimuli were presented to the paired ear, and conversely, biased toward the reference frequency when the comparison stimuli were presented to the reference ear. This finding is consistent with the subjective nature of pitch comparisons, which have been shown to be biased by other stimulus variables such as comparison stimulus frequency range (Carlyon et al., 2010), or stimulus context or sequence (Reiss et al., 2012).
One possible cause of this response bias may be involuntary attention and thus weighting toward the comparison ear, due to the greater variability and unpredictability of tones in that ear compared to the constant presentation of the reference stimulus in the opposite ear (regardless of whether the component in that ear was the reference or pair tone) during the fusion pitch matching measurement. Thus, the symmetric pitch averaging results obtained when the comparison ear was randomized might be attributed to evenly divided attention when stimulus variability and unpredictability are distributed across the ears. Certainly, previous studies suggest that stimulus variability may serve to orient attention (Posner, 1980; Asbjørnsen and Bryden, 1996; Thompson et al., 2011). It is also possible that manipulation of voluntary attention to one or the other ear might affect the relative weighting between ears.
In addition, the findings suggest that pitch averaging may lead to a more diffuse pitch sensation which is more difficult to pitch match, resulting in a shallower slope (Reiss et al., 2014). As pitch averaging regions shift with the comparison ear, shallow slope regions also shift. This interpretation is supported by an additional indicator of uncertainty, the total number of repeats requested by the subject for each reference-pair tone combination (not shown). In the biased comparison ear conditions, more repeat trials of the tone pairs occurred in the pitch averaging region than in the lower-pitch dominance region, while randomization or alternation of the comparison ear led to an equal distribution of repeats over the pitch averaging region.
C. Characterizing the two-dimensional binaural pitch fusion range and averaging trends
The findings from one subject (HI07) show that fusion ranges can sometimes be asymmetric across ears. In such cases, two-dimensional representations of the binaural pitch fusion ranges and averaging trends would be useful. A systematic, efficient measurement protocol is recommended as follows: first determine the coarse boundaries of the fusion area with a shortened version of the constants procedure (e.g., with a reduced number of trials), and then determine the finer boundaries with testing of adjacent tone pairs near the boundaries (i.e., a coarse-to-fine measurement procedure). To minimize biases, the methodology should incorporate some way of randomizing each reference-pair tone combination, either by interleaving multiple measurements with various reference and pair components, or by randomizing or interleaving the comparison ear.
D. Implications of broad binaural pitch fusion and averaging for speech perception
Recently it was shown that hearing-impaired listeners with HAs and/or CIs can experience interference in vowel perception when listening with two ears instead of one, and that this may be explained by broad binaural pitch fusion and the associated pitch averaging (Reiss et al., 2016). In that study, spectral mismatches between the ears often led to differences in perceived vowel spectrum between ears, especially for bimodal CI users with large mismatches between the CI and HA. These differently perceived vowels were then fused between the ears, occasionally leading to worse discrimination than with either ear alone. For HA users, even though spectral mismatches are smaller between the ears, interference may still occur, especially in complex environments. For example, perception of concurrent/different vowels could be degraded when they are presented simultaneously in both ears if their formant frequencies were fused within a specific frequency range. Even though the within-ear concurrent vowel perception has been discussed extensively in the literature (e.g., Culling and Darwin, 1993; Assmann and Paschall, 1997), questions still remain about how two ears interact with each other in dichotic vowel perception, especially in individuals with hearing loss. There has been little work published relating to both ears simultaneously. The ability to separate and stream multiple talkers in background noise may also be degraded if fundamental frequencies are fused within a frequency range.
E. Applicability and relation to other sensory modalities
Other sensory systems can exhibit a similar perceptual fusion phenomenon. For example, in the visual system, two incompatible images presented separately in each eye normally produce perceptual alternation between the two monocular views, which is known as binocular rivalry. However, the two monocular images can be fused or superimposed into a single image with manipulation of various factors such as spatial frequency (image resolution) and stimulus duration (Wolfe, 1983). As observed in the current study, such properties are averaged across the two eyes (Hillis et al., 2002). Similar averaging and integration have also been observed in various experimental conditions of multi-sensory integration, such as across vision and touch (e.g., vision-haptic shape discrimination, Ernst and Banks, 2002; visual-tactile motion perception, Shams and Kim, 2010) or audition and vision (e.g., audio-visual illusion, Shams and Kim, 2010; pitch-size perceptual interaction, Albrecht et al., 2012).
V. CONCLUSIONS
The current study focused on binaural pitch averaging trends in bilateral HA users with broad fusion ranges. Two distinct trends were seen for binaural pitch fusion: dominance by the pitch perceived in one ear, or averaging of the pitches perceived in the two ears. Specifically, averaging occurred when the pair tone frequency was between −0.14 and +0.78 octaves relative to the reference frequency; dominance by the lower component occurred outside of this range. Interestingly, the findings from two subjects suggest that randomization or alternation of the comparison ear can eliminate this asymmetry in the pitch averaging range around the reference frequency. Differences in fusion ranges between ears, including gaps in fusion ranges, were also observed in some subjects. Further study is needed to investigate the effects of factors such as attention on fusion pitch weighting. These findings may provide insights into how hearing-impaired listeners generally integrate spectral information between ears.
ACKNOWLEDGMENTS
This research was supported by Grant Nos. R01 DC013307 and P30 DC005983 from the National Institutes of Deafness and Communication Disorders, National Institutes of Health. The authors would like to thank Virginia Best and two anonymous reviewers for their valuable comments and suggestions to improve the quality of the paper.
Portions of this work were presented in “Toward a Systematic Analysis of Binaural Pitch Averaging Trends in Hearing Impaired Listeners,” 2016 Meeting of the Association for Research in Otolaryngology, San Diego, CA, February 2016.
Footnotes
See supplementary material at http://dx.doi.org/10.1121/1.4997190E-JASMAN-142-036708 for Figs. S1, S2, S3, and S4, which are plots of equal loudness levels, example fusion pitch match results for subject HI32, effects of varying the comparison ear on the pitch averaging ranges for subject HI25 (FPI and 25%–75% ranges of the fusion pitch match functions), respectively.
References
- 1. Albrecht, A. R. , Scholl, B. J. , and Chun, M. M. (2012). “ Perceptual averaging by eye and ear: Computing summary statistics from multimodal stimuli,” Attn., Percept., Psychophys. 74(5), 810–815. 10.3758/s13414-012-0293-0 [DOI] [PubMed] [Google Scholar]
- 2. Asbjørnsen, A. E. , and Bryden, M. P. (1996). “ Biased attention and the fused dichotic words test,” Neuropsychologia 34(5), 407–411. 10.1016/0028-3932(95)00127-1 [DOI] [PubMed] [Google Scholar]
- 3. Assmann, P. F. , and Paschall, D. D. (1998). “ Pitches of concurrent vowels,” J. Acoust. Soc. Am. 103(2), 1150–1160. 10.1121/1.421249 [DOI] [PubMed] [Google Scholar]
- 4. Carlyon, R. P. , Macherey, O. , Frijns, J. H. , Axon, P. R. , Kalkman, R. K. , Boyle, P. , Baguley, D. M. , Briggs, J. , Deeks, J. M. , Briaire, J. J. , Barreau, X. , and Dauman, R. (2010). “ Pitch comparisons between electrical stimulation of a cochlear implant and acoustic stimuli presented to a normal–hearing contralateral ear,” J. Assoc. Res. Otolaryngol. 11(4), 625–640. 10.1007/s10162-010-0222-7 [DOI] [PMC free article] [PubMed] [Google Scholar]
- 5. Culling, J. F. , and Darwin, C. J. (1993). “ Perceptual separation of simultaneous vowels: Within and across–formant grouping by F0,” J. Acoust. Soc. Am. 93(6), 3454–3467. 10.1121/1.405675 [DOI] [PubMed] [Google Scholar]
- 6. Ernst, M. O. , and Banks, M. S. (2002). “ Humans integrate visual and haptic information in a statistically optimal fashion,” Nature 415(24), 429–433. 10.1038/415429a [DOI] [PubMed] [Google Scholar]
- 7. Florentine, M. , Popper, A. N. , and Fay, R. R. (2011). Loudness ( Springer, New York), Chap. 2, pp. 17–56. [Google Scholar]
- 8. Folstein, M. F. , Folstein, S. E. , and McHugh, P. R. (1975). “ ‘Mini-mental state’: A practical method for grading the cognitive state of patients for the clinician,” J. Psychiatr. Res. 12, 189–198. 10.1016/0022-3956(75)90026-6 [DOI] [PubMed] [Google Scholar]
- 9. Grose, J. H. , and Mamo, S. K. (2010). “ Processing of temporal fine structure as a function of age,” Ear Hear. 31(6), 755–760. 10.1097/AUD.0b013e3181e627e7 [DOI] [PMC free article] [PubMed] [Google Scholar]
- 10. Hillis, J. M. , Ernst, M. O. , Banks, M. S. , and Landy, M. S. (2002). “ Combining sensory information: Mandatory fusion within, but not between, senses,” Science 298(5598), 1627–1630. 10.1126/science.1075396 [DOI] [PubMed] [Google Scholar]
- 11. Levitt, H. (1971). “ Transformed up-down methods in psychoacoustics,” J. Acoust. Soc. Am. 49(2), 467–477. 10.1121/1.1912375 [DOI] [PubMed] [Google Scholar]
- 12. Moore, B. C. J. (1996). “ Perceptual consequences of cochlear hearing loss and their implications for the design of hearing aids,” Ear Hear. 17(2), 133–160. 10.1097/00003446-199604000-00007 [DOI] [PubMed] [Google Scholar]
- 13. Posner, M. I. (1980). “ Orienting of attention,” Q. J. Exp. Psychol. 32(1), 3–25. 10.1080/00335558008248231 [DOI] [PubMed] [Google Scholar]
- 14. Reiss, L. A. , Eggleston, J. L. , Walker, E. P. , and Oh, Y. (2016). “ Two ears are not always better than one: Mandatory vowel fusion across spectrally mismatched ears in hearing-impaired listeners,” J. Assoc. Res. Otolaryngol. 17(4), 341–356. 10.1007/s10162-016-0570-z [DOI] [PMC free article] [PubMed] [Google Scholar]
- 15. Reiss, L. A. , Ito, R. A. , Eggleston, J. L. , and Wozny, D. R. (2014). “ Abnormal binaural spectral integration in cochlear implant users,” J. Assoc. Res. Otolaryngol. 15(2), 235–248. 10.1007/s10162-013-0434-8 [DOI] [PMC free article] [PubMed] [Google Scholar]
- 16. Reiss, L. A. , Perreau, A. E. , and Turner, C. W. (2012). “ Effects of lower frequency-to-electrode allocations on speech and pitch perception with the Hybrid short-electrode cochlear implant,” Audiol. Neurotol. 17(6), 357–372. 10.1159/000341165 [DOI] [PMC free article] [PubMed] [Google Scholar]
- 17. Reiss, L. A. , Shayman, C. S. , Walker, E. P. , Bennett, K. O. , Fowler, J. R. , Hartling, C. L. , Glickman, B. , Lasarev, M. , and Oh, Y. (2017). “ Binaural pitch fusion: Comparison of normal-hearing and hearing-impaired listeners,” J. Acoust. Soc. Am. 141(3), 1909–1920. 10.1121/1.4978009 [DOI] [PMC free article] [PubMed] [Google Scholar]
- 18. Shams, L. , and Kim, R. (2010). “ Crossmodal influences on visual perception,” Phys. Life Rev. 7(3), 269–284. 10.1016/j.plrev.2010.04.006 [DOI] [PubMed] [Google Scholar]
- 19. Souza, P. E. , Boike, K. T. , Witherall, K. , and Tremblay, K. (2007). “ Prediction of speech recognition from audibility in older listeners with hearing loss: Effects of age, amplification, and background noise,” J. Am. Acad. Audiol. 18, 54–65. 10.3766/jaaa.18.1.5 [DOI] [PubMed] [Google Scholar]
- 20. Thompson, S. K. , Carlyon, R. P. , and Cusack, R. (2011). “ An objective measurement of the build-up of auditory streaming and of its modulation by attention,” J. Exp. Psychol. Hum. Percept. Perform. 37(4), 1253–1262. 10.1037/a0021925 [DOI] [PubMed] [Google Scholar]
- 21. Thurlow, W. R. , and Bernstein, S. (1957). “ Simultaneous two-tone pitch discrimination,” J. Acoust. Soc. Am. 29(4), 515–519. 10.1121/1.1908946 [DOI] [Google Scholar]
- 22. Van den Brink, G. , Sintnicolaas, K. , and van Stam, W. S. (1976). “ Dichotic pitch fusion,” J. Acoust. Soc. Am. 59(6), 1471–1476. 10.1121/1.380989 [DOI] [PubMed] [Google Scholar]
- 23. Wier, C. C. , Jesteadt, W. , and Green, D. M. (1977). “ Frequency discrimination as a function of frequency and sensation level,” J. Acoust. Soc. Am. 61(1), 178–184. 10.1121/1.381251 [DOI] [PubMed] [Google Scholar]
- 24. Wolfe, J. M. (1983). “ Influence of spatial frequency, luminance, and duration on binocular rivalry and abnormal fusion of briefly presented dichoptic stimuli,” Perception. 12(4), 447–456. 10.1068/p120447 [DOI] [PubMed] [Google Scholar]


