Abstract
Model cellular membranes are known to form micro- and macroscale lipid domains dependent on molecular composition. The formation of macroscopic lipid domains by lipid mixtures has been the subject of many simulation investigations. We present a critical study of system size impact on lipid domain phase separation into liquid-ordered and liquid-disordered macroscale domains in ternary lipid mixtures. In the popular di-C16:0 PC:di-C18:2 PC:cholesterol at 35:35:30 ratio mixture, we find systems with a minimum of 1480 lipids to be necessary for the formation of macroscopic phase separated domains and systems of 10 000 lipids to achieve structurally converged conformations similar to the thermodynamic limit. To understand these results and predict the behavior of any mixture forming two phases, we develop and investigate an analytical Flory-Huggins model which is recursively validated using simulation and experimental data. We find that micro- and macroscale domains can coexist in ternary mixtures. Additionally, we analyze the distributions of specific lipid-lipid interactions in each phase, characterizing domain structures proposed based on past experimental studies. These findings offer guidance in selecting appropriate system sizes for the study of phase separations and provide new insights into the nature of domain structure for a popular ternary lipid mixture.
I. INTRODUCTION
Cellular membranes consist of a variety of types of lipids1 combined with sterols and proteins.2 The membrane environment is observed to be robust against local spatial disturbances and structural stress over the membrane surface yet dynamic in allowing lipid and protein diffusion and structural reorganization essential to cellular function.3–5
Lipid bilayer mixtures have been observed to form domains in vitro6 and in vivo.7,8 Lipids within a given domain are assumed to adopt one of many structural phases available to lipid bilayers,9,10 constituting a thermodynamic model of “condensed complexes.”11 Lipid domains are observed to be micro- or macroscale depending on the lipid mixture, categorized as “type I” and “type II” mixtures by Feigenson.12–14 The most widely discussed macroscale domain is known as a “lipid raft,” characterized by high concentrations of cholesterol, sphingomyelin, and glycosylphosphatidylinositol-anchored proteins in a liquid-ordered phase (),15 conjectured to be critical to the structure and function of several membrane proteins.16 Lipid domains are widely believed to be circular, formed via coarsening,17–19 though the formation of circular domains via modulated phases has also been reported.20
Few component lipid bilayers have been designed as minimal models of biological membranes that retain characteristics believed to be essential to membrane function.21–23 Investigations of model membranes using NMR spectroscopy,24–27 fluorescence spectroscopy,28–32 scattering techniques,33–36 and microscopy techniques28,37–40 have provided insight into the essential thermodynamic properties of lipid bilayers. Lattice models have provided insight into the fundamental thermodynamic driving forces leading to the phase behavior observed in experimental studies of ternary lipid mixtures.41–46 This understanding of membrane structure and dynamics has been supplemented by increasingly detailed molecular simulation studies.47–59 Taken together, these experimental, computational, and theoretical studies have supplied us with a fundamental understanding of the essential properties of membrane formation.60–66
In molecular dynamics simulations, periodic boundary conditions (PBCs) are used with the knowledge that observed thermodynamic and kinetic properties may depend on the finite size of the system.67–69 In the case of lipid bilayer simulation, PBC effects were first investigated in the context of the spectrum of membrane surface undulations. Lindhal and Edholm found that the x- or y-edge length must be 20 nm or longer, and the system must be equilibrated for 10-100 ns to develop the longest wavelength undulatory modes required to fully characterize the bilayer surface. Klauda et al. found a strong dependence of lipid diffusion on the PBC size,70 though Castro-Román et al. found the effect of PBC on single and multilamellar bilayer structures to be negligible.71 Additionally Camley et al. have developed a Saffman-Delbrück hydrodynamic model validated by all-atom and coarse-grained simulations, suggesting that lipid bilayer simulations must employ PBCs with near-100 nm edge lengths and thick hydration layers to capture essential bilayer structural fluctuations.72 These studies suggest that PBCs strongly perturb lipid bilayer fluctuations and dynamics. In the case of domain formation by simple liquid mixtures, Scott et al.73 have investigated the nature of system size and PBC effects, and Huang and Feigenson have investigated system size effects of phase separation in binary mixture lattice models.74 However, the scaling of PBC effects observed in studies of liquid-liquid phase separation using molecular dynamics simulation does not appear to have been addressed in any context.
In this work, we perform molecular dynamics simulations and structural analysis of domain formation in the well-studied di-C16:0 PC (DPPC), di-C18:2 PC (DIPC), and cholesterol (CHOL) (35:35:30), “type II” ternary lipid bilayer mixture using MARTINI coarse-grained lipid models over a wide range of system sizes. Our analysis of domain formation as a function of system size suggests that systems with less than 1480 lipids may not form macroscale domains defined by a distinguishable interface. Moreover, the convergence of structural properties is found to require systems of 10 000 lipids or more. Additionally, via the microscopic structural analysis of trans-leaflet aggregates of domain-forming lipids, we observe the coexistence of micro- and macroscopic ordered domains in systems of sufficient size. To describe the balance of finite size, composition, temperature, and interaction energy on phase separation and domain shape, we apply an analytical Flory-Huggins model parameterized using simulation data and interaction energies derived from experiment. These findings provide insight into the role of system size in determining the morphology and stability of domain formation in multicomponent lipid bilayers and guidance for future modeling studies. Additionally, this work suggests that finite size effects may be critical to the study of phase separation in other multi-component biological systems, such as the formation of the protein coronae, protein fibrils, endoplasmic granules, and vesicles.
II. MATERIALS AND METHODS
A. MD simulation setup
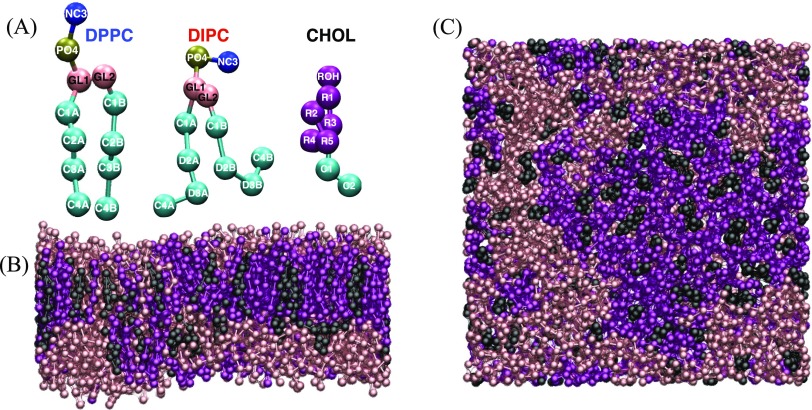
Fully atomistic simulations of lipid bilayer phase separation from random mixtures are not feasible with current enhanced sampling methods and computing hardware. As such, we employ the widely used MARTINI coarse-grained force field, which simplifies the energy landscape of the mixture, accelerates dynamics relative to atomistic models, and provides an order of magnitude gain in both computational efficiency for integration time step and number of particles (Fig. 1). While approximate, the MARTINI model has been shown to capture essential properties of a variety of thermodynamic phases, making it useful for understanding structural transitions in lipid membranes.63,75
FIG. 1.
(a) MARTINI model lipids and cholesterol with site labels. Slab (b) and top (c) views of N = 508 lipid membranes at 11 where DPPC, DIPC, and CHOL are pink, purple, and black, respectively.
The Melo et al. force field parameters were used for CHOL.76 DPPC, DIPC, water, Na, and Cl were modeled using the MARTINI v2.0 parameters.77 Approximately 24 effective solvent molecules per lipid molecule were used so as to fully solvate each lipid head group.78 To avoid spontaneous freezing of water, 10% of the waters were modeled using anti-freeze parameters. 150 mM NaCl salt was used to model a physiological salt concentration.
All ternary mixtures were prepared by the random placement of DPPC, DIPC, and CHOL on a square lattice bilayer with a layer of solvent using the insane.py tool.79 The steepest descent minimization and MD were performed using the GROMACS 5.0.4 simulation suite.80 Simulation parameters largely correspond to those of the “common” parameter set described by De Jong et al.81 A time step of 20 fs using leapfrog integration with a 1.2 nm “group” neighbor list updated every 10 steps was used. Non-bonded interactions are handled using the Gromacs shifting function between 0.9-1.2 nm and 0.0-1.2 nm for Lennard-Jones and Coulomb interactions, respectively. The velocity-rescaling thermostat was used with a coupling time of 1 ps with 295 K temperature, and the semi isotropic Berendsen barostat was used with 1 atm pressure, a coupling time of 2 ps, and a compressibility of 3 × 10⁻⁴ bar−1. Coordinates and thermodynamic data were recorded in 1 ns time intervals.
B. Assignment of CHOL to leaflets
Due to rapid flip-flop between leaflets, CHOL molecules were assigned to a specific leaflet in each frame. Flip-flops of lipids other than CHOL were not observed. For each CHOL molecule, we assessed whether its head group is proximate to an upper or lower leaflet lipid head group and assigned it to the appropriate leaflet.
C. Analysis methods
Lipid mixing entropy () was computed using nearest neighbors determined via Voronoi tessellations of lipid head groups. This method provides advantages over definitions of mixing entropies based on coarse-grained measurements of lipid composition within a space-fixed grid, the resolution of which influences the estimate of the mixing entropy.82,83 The head groups, represented by the PO4 beads of DPPC and DIPC and the ROH bead of CHOL, were selected within each leaflet in each frame, from which a Voronoi tessellation was performed. The mixing entropy was determined based on the probability of contacts formed by the same lipid type (p1) or different lipid type (p2) as
| (1) |
The Nelson-Halperin 2D bond-orientational order parameter () was computed based on the carbon chain of each DPPC, DIPC, and CHOL. Positions of DPPC and DIPC chains were represented by C2A and C2B, and D2A and D2B beads, respectively. The CHOL chain was represented by the centroid of the R1, R2, R3, R4, and R5 beads. The six nearest neighbors (l) of each point (k) were found using the Cartesian coordinates of the k and l points fitted to a plane using their singular value decomposition prior to the measurement of . The reference vector, , was positioned at k, pointed along the x-axis, and was fitted to the same plane as the k and l points. Using the fitted plane, the bond-orientational order parameter was computed as
| (2) |
where is the angle between the vector connecting l and k and the vector . Taking the absolute value, gives us a measure of how “well-packed” a lipid tail is.
The liquid crystal order parameter (P2) was measured using a vector between GL1-C4A and GL2-C4B beads for DPPC and DIPC and the z-axis as the director,
| (3) |
where is the angle between the vector connecting the lipid tails and the director vector.
To identify intra-leaflet aggregates of DPPC and CHOL carbon chains, we performed a hierarchical distance-based geometric clustering analysis. We counted DPPC and CHOL carbon chains as being part of an aggregate if the C2A, C2B, or centroid of the R1, R2, R3, R4, and R5 beads were within 5.8 Å of any other beads. The inter-leaflet contacts were counted if the C4A, C4B (DPPC and DIPC), or C2 (CHOL) bead in the opposing leaflet were within 7.0 Å of any bead defining the aggregate. For the analysis of DIPC and CHOL aggregates, equivalent criterion for cluster identification was used except intra-leaflet aggregates which were identified using a 7.8 Å cutoff distance.
III. RESULTS AND DISCUSSION
A. Achieving structural and spatial equilibrium
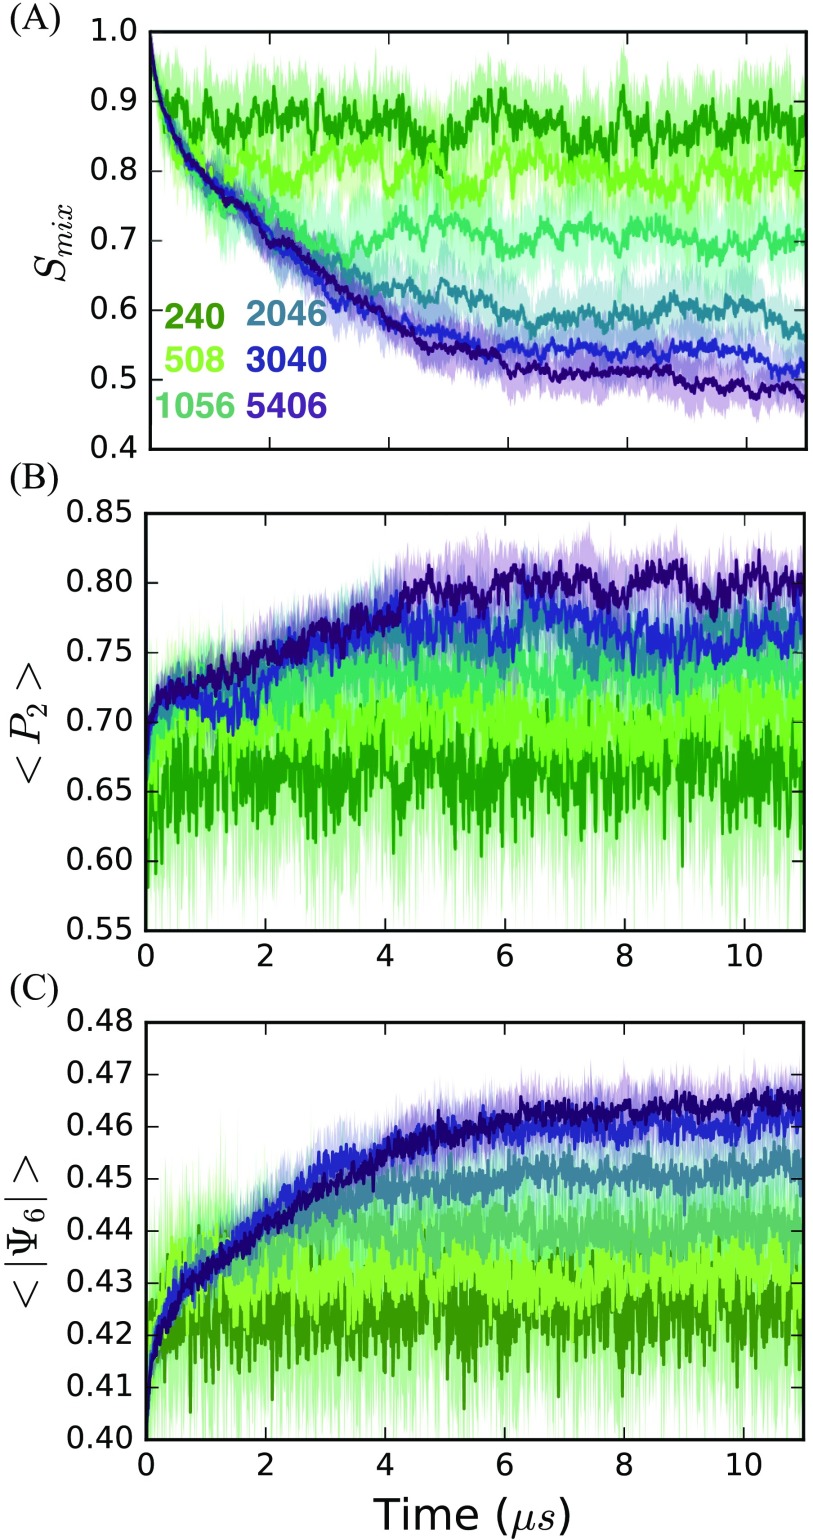
To study the formation of phase separated domains, we employ a traditional “type II” mixture of DPPC, DIPC, and CHOL (35:35:30) previously investigated.14,61–66,84–86 We performed coarse-grained MD simulations at 295 K initiated from a random spatial placement of lipids into a bilayer geometry for a wide range of system sizes. Five 11 trajectories were produced for bilayers composed of N = 240, 508, 1056, 2046, 3040, and 5406 molecules. 330 of sampling were accumulated for this study. These systems reach an apparent equilibrium in their structural properties by 6 , as measured by the time-dependence of the lipid mixing entropy (), the norm of their 2D bond-orientational order parameter (), and the liquid crystal order parameter (P2) (Fig. 2). The time evolution of the instantaneous order parameters suggests that the system dynamics is essentially stationary after 6 .
FIG. 2.
Mean and standard deviations in (a) mixing entropy, (b) liquid crystal order, and (c) absolute value of 2D bond-orientational order averaged over five replicate trajectories.
B. Critical system size is required for phase separations
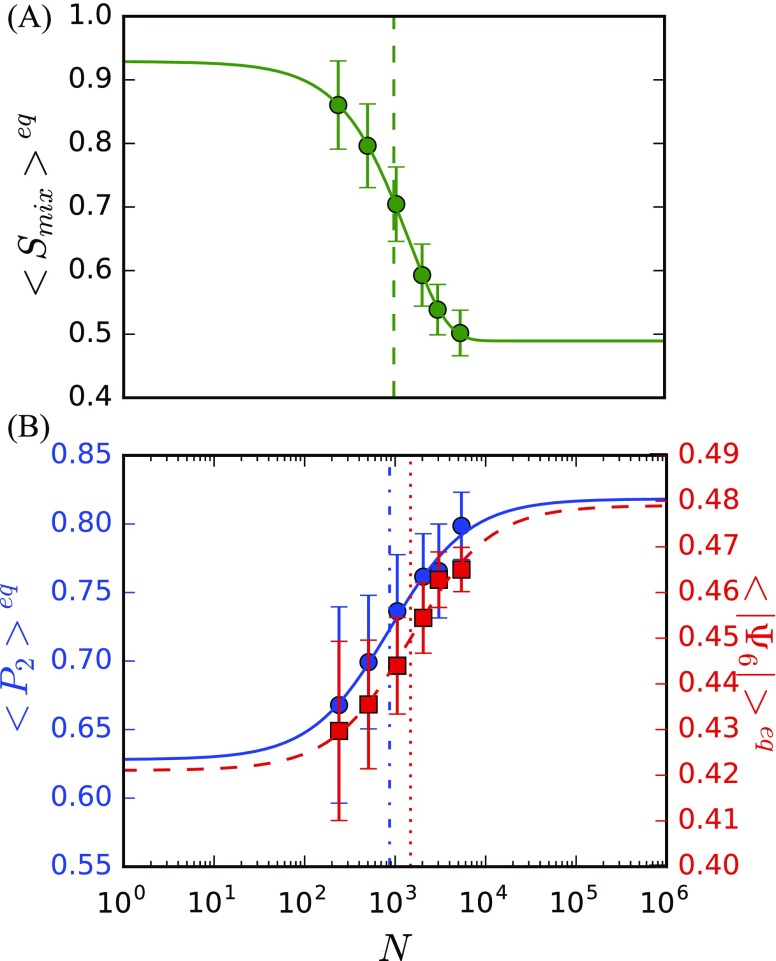
The average values of the three order parameters were computed as a function of system size using the dynamics in the observed stationary regime (Fig. 3). The average value of each order parameter displays a sigmoidal transition as a function of the log of system size, with a miscible state for small N and a phase separated state for large N. The average order parameters are observed to asymptotically converge at N 10 000, similar to that observed by Huang and Feigenson for binary lattice mixtures.74 We identify a critical size (Nc) for each order parameter as the inflection point of the order parameter as a function of system size. We find that for the three order parameters employed, = 994, = 870, and = 1480, close to Nc = 1000 previously predicted by Huang and Feigenson.74
FIG. 3.
Mean and standard deviations at equilibrium of (a) and (b) P2 of DPPC (blue) and of DPPC (dashed-red) averaged over five replicate trajectories. Inflection points are identified by dashed (), dashed-dotted (P2), and dotted () lines.
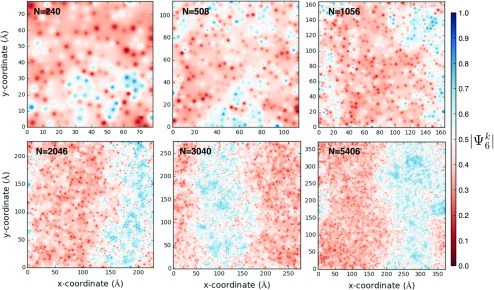
We observe that small equilibrated lipid bilayers up to N = 1056 do not form macroscopic phase separated domains spanning the system. Larger systems (N 1480) appear to form phase separated domains of size limited by the PBC employed. When N 1056, liquid ordered domains do not span the system to form striped domains (Fig. 4). Based on these observations, we say that = 1480 is the minimum system size required to simulate the formation of phase separated lipid domains. The separation of states by is clear (Fig. S1 of the supplementary material) and the short correlation length of lipid tail orientational order [] indicates that both phases retain characteristics of the liquid state (Fig. S2 of the supplementary material). Separation of states by P2 is not as clearly visualized because this is not measured for CHOL (Fig. S3 of the supplementary material).
FIG. 4.
Linearly interpolated measurements of absolute-valued 2D bond-orientational order parameter for one leaflet at 6 μs in different systems.
C. Binary Flory-Huggins theory defines critical system size for domain formation
The phenomenon of phase separation in lipid bilayers has been considered using a variety of Flory-Huggins type models. Phase diagrams were computed for models of binary41 and ternary87 mixtures that included an order parameter based treatment of the liquid-gel melting transition. Additionally, a Flory-Huggins type model has been used to develop a theory of line tension in ternary lipid mixtures, finding the line tension to depend on the composition of the lipid mixture.45 Finally, Radhakrishnan and McConnell developed a model for ternary lipid mixtures in which two components combine and interact with the third component.42 While this last approach captures certain aspects of phase separation in ternary lipid mixtures noted in experiment, it fails to reproduce the more complex phase behavior captured by the more detailed models.
In this work, we employ a minimal model for the ternary lipid mixture in that it models the ternary mixtures in terms of two fluid components and bears resemblance to the model of McConnell and Vrljic11 and to the original presentation of the theory.88 It is used as a minimal model to provide insight into the importance of system size on phase separation and to determine the thermodynamic driving forces determining the minimum system size required to observe phase separated domains.
We define the free energy of a randomly mixed state (), a stripe phase separated state (), and a dot-shaped (circular) phase separated state (Fdot) as
| (4) |
| (5) |
| (6) |
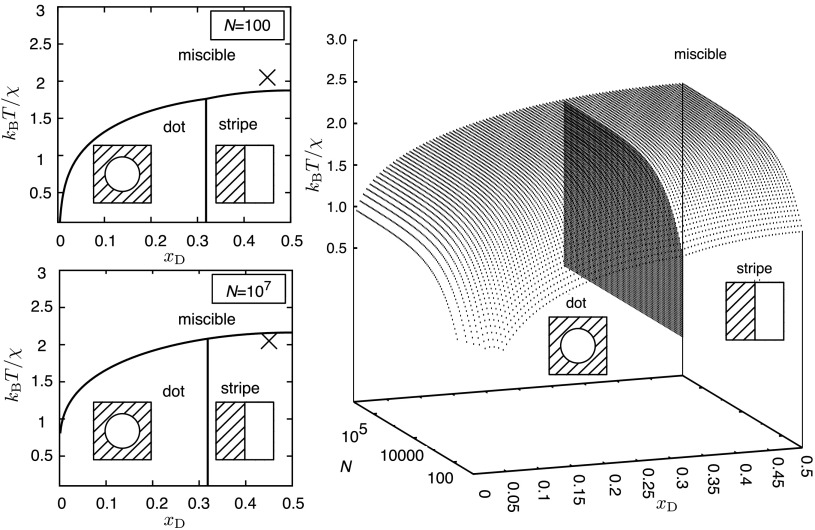
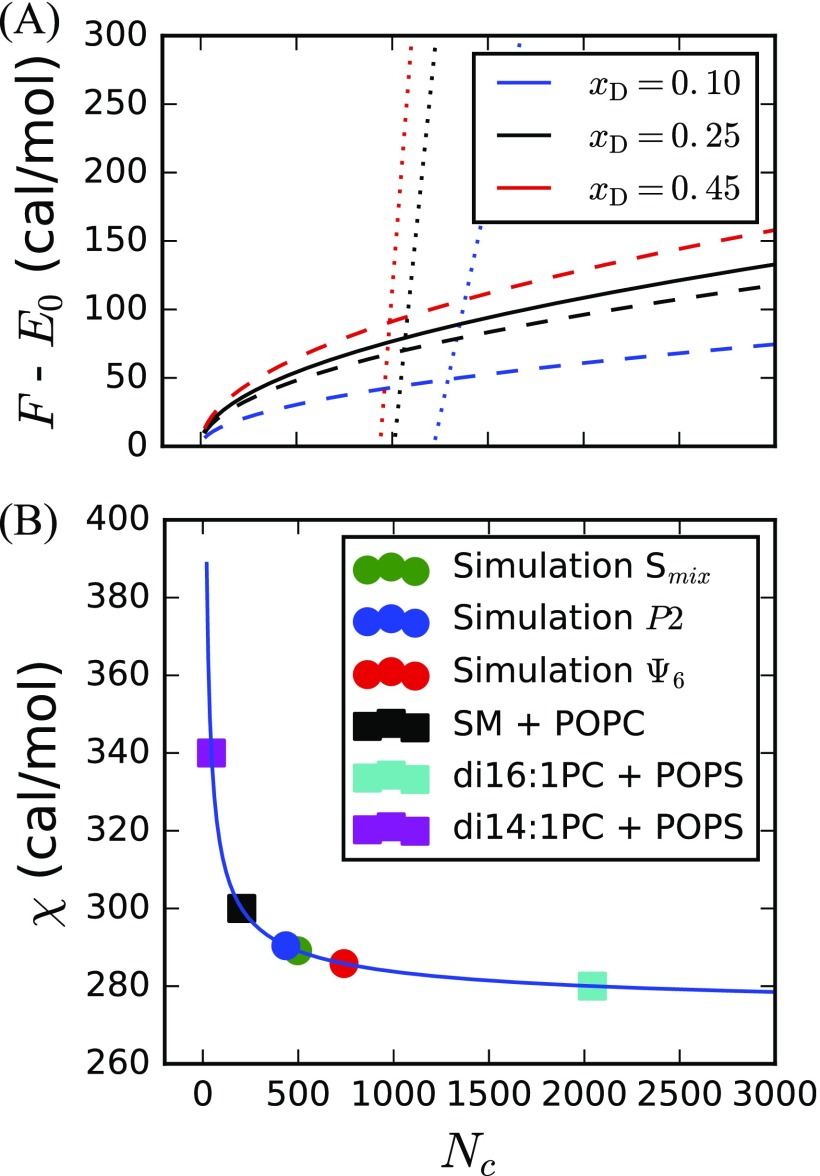
where N is the number of molecules in a monolayer, is the mole fraction of molecules that form the liquid disordered phase (), ranging from 0 to 0.5, = is the mole fraction of molecules that form the liquid ordered phase (), z is the coordination number of each molecule, E0 is a constant for interaction energies, and is a measure of the cost of forming an interaction between sites representing and . , , and are bond energies discussed in detail in the supplementary material. When 0, it is possible for or to reach a lower energy than . The stripe phase is more stable than the dot phase for xD . In our simulations, 0.45 (Table S2 of the supplementary material) and we observe the stripe phase, consistent with the predictions of the model. The crossover between miscible and immiscible states may happen as the number of lipids, N, in the system increases (Figs. 5 and 6).
FIG. 5.
Lowest free energy configurations found for the Flory-Huggins model of mixed, stripe, or dot states at T = 295 K and z = 6 (to approximate realistic lipid packing). The “X” depicts the state of the system considered in this work, which is predicted to be in the miscible state for N = 100 and stripe phase separated state for N = 107 taken to be the thermodynamic limit.
FIG. 6.
We demonstrate the dependence of system size, N, on the mole fraction, . (a) Free energies of mixed (dotted), stripe (solid), and dot (dashed) phases when = 2.90 cal/mol and T = 295 K. z = 6 to approximate realistic packing of lipids. (b) Solid line is the relation from the binary Flory-Huggins model [Eq. (S6) of the supplementary material] with xD = 0.45, T = 295 K, and z = 6. Circles are placed on the curve at critical sizes (Nc) obtained from simulation, while squares are placed on the curve at values derived by Almeida.95 and Nc values are tabulated along with corresponding line tensions in Table S3 of the supplementary material.
This model enables prediction of Nc from experimentally determined , as well as the determination of values from Nc obtained by simulation [Fig. 6(b)]. The values corresponding to our simulations occur near the inflection point in , suggesting a sensitive dependence of Nc on . The values reported here are likely larger than other well-studied mixtures in experiment, such as DPPC, DIPC, and CHOL, due to substantial mismatch in degrees of tail saturation. This may explain the past difficulty in observing macroscopic phase separation of such mixtures in simulation studies.
There have been many previous studies of domain formation in ternary lipid mixtures using MARTINI as well as more fine-grained lipid force fields.14,60–66,84–86,89–93 Some of the previous simulation work on this phenomenon employed system sizes substantially smaller than the critical minimum system size required for phase separation in this study.62,65,66,90–92,94 As such, it is important to carefully consider how PBC may have influenced observations of phase behavior in these previous studies.
D. Coexistence of micro- and macroscopic liquid ordered domains at equilibrium
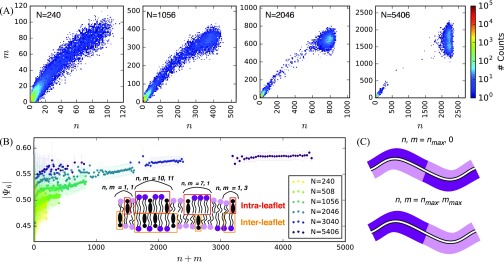
To define domains of DPPC and CHOL aggregates, we geometrically cluster intra-leaflet DPPC and CHOL carbon chains (of number n) and identify inter-leaflet contacts with DPPC and CHOL (of number m) at equilibrium (see Sec. II for details). We count the occurrences of aggregates given (n, m). Through this analysis, we observe large separations between micro- and macroscopic domains once the system becomes large [Fig. 7(a) and Fig. S4 of the supplementary material]. Similar separation can be observed for DIPC and CHOL aggregates (Fig. S5 of the supplementary material). By analyzing the number of carbon chains not associated to the largest intraleaflet cluster, we also find that domains in small systems exhibit substantial impurities while domains are similarly pure at all system sizes (Fig. S6 of the supplementary material). Additionally, it appears that sampled values of n and m are linearly correlated, such that an aggregate of n intra-leaflet carbon chains will be in contact with a similar number of m inter-leaflet carbon chains. Analyzing aggregates of size n+m, we find microscopic domains as large as 250 carbon chains to be substantially ordered, forming a domain [Fig. 7(b)]. This coexistence of micro- and macroscopic domains stands in contrast to the scenario in which ternary mixtures only form micro- (type I) or macro-domains (type II) as implied by Feigenson.12–14 Similar observations have also been made based on binary mixture simulations of the Pink lattice model for lipid-lipid and lipid-protein mixtures, suggesting that microscopic phase separations can arise even when there is a vanishingly small amount of mismatching lipid.96,97 Additionally, recent work by Javanainen et al. identifies the coexistence of microscopic and domains in all-atom simulations.98
FIG. 7.
(a) Counts of intra- (n) and inter-leaflet (m) carbon chains in DPPC-CHOL aggregates at equilibrium. (b) Mean and standard deviations of as dependent on the size of DPPC-CHOL aggregates. Inset illustration describes aggregates in an example configuration. (c) Illustration of extreme cases of registration and anti-registration.
E. Phases form unique complexes involving CHOL
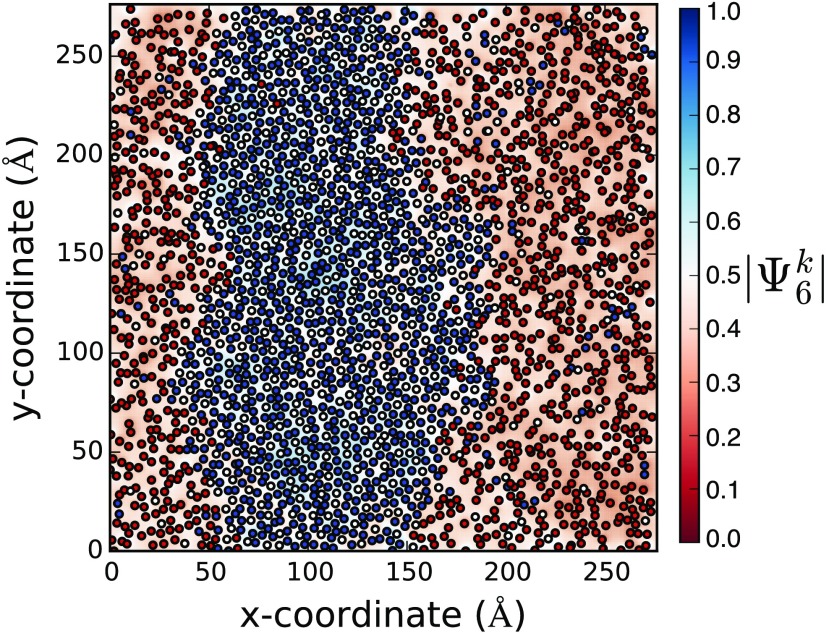
To characterize the structure of lipids within the simulated and domains, we provide a critical comparison with the liquid condensed phase of DPPC and CHOL monolayers, analogous to the phase. Kim et al. observed that liquid condensed domains in mixtures of DPPC and CHOL exhibit a high degree of bond-orientational order and a ratio of 6:1 DPPC:CHOL, consistent with the formation of a “tiled lattice” of cholesterol carbon chain surrounded by six DPPC carbon chains.99 Consistent with this view, we observe substantial bond-orientational order which visually differentiates the and domains (Fig. 8).
FIG. 8.
Coordinates of DPPC (blue, C2A and C2B beads), DIPC (red, D2A and D2B beads), and CHOL (white, centroid of R1, R2, R3, R4, and R5 beads) in one leaflet at 6 for N = 3040. values are linearly interpolated.
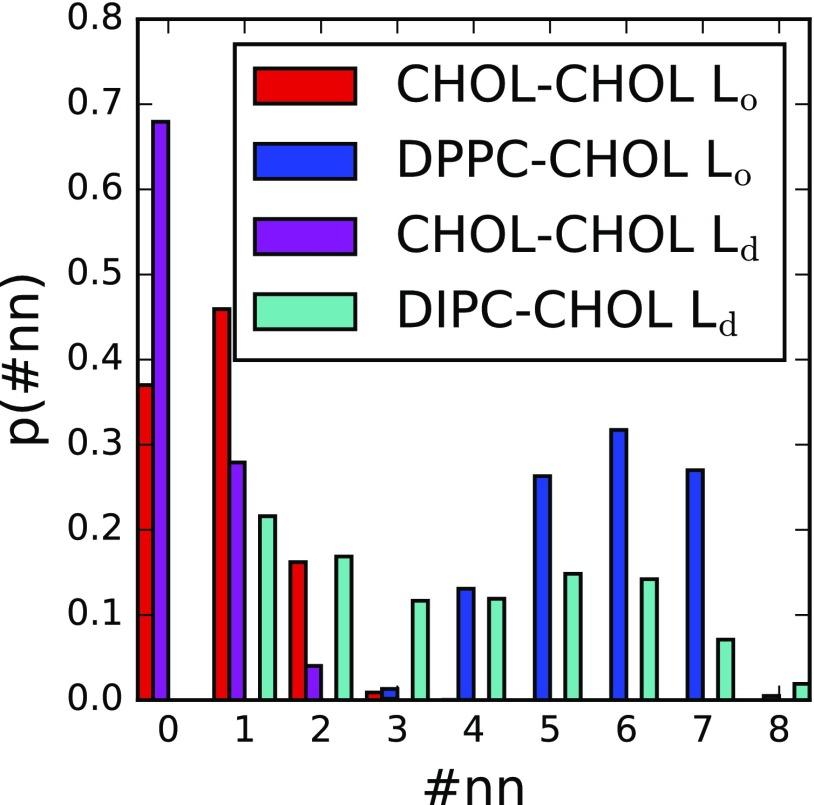
Distributions of CHOL neighbors were evaluated via Voronoi tessellations, where DPPC:CHOL 6:1 ratio was found to be most prevalent in domains (in which cholesterol only neighbors other cholesterol or DPPC). Approximately equal counts of 5:1 and 7:1 ratios were the next-most populous complexes (Fig. 9), the result of point defects in the membrane surface that facilitate bilayer undulations. These ratios are consistent with the spatial distributions observed by Kim et al.99 in the liquid condensed phase. For smaller system sizes in the phase, a 1:1 DIPC:CHOL ratio is found to be most prominent. As N increases, a second peak at 6:1 DPPC:CHOL develops (in the phase), similar to that of DPPC:CHOL (in the phase) (Fig. S7 of the supplementary material).
FIG. 9.
Cholesterol nearest neighbor distributions computed using Voronoi tessellation analysis at apparent equilibrium for N = 5406. Cholesterol in () domains are identified as cholesterols with no DIPC (DPPC) neighbors.
We note that the phase exhibits the preferential formation of CHOL-CHOL dimers over monomers. This may be of interest in biological processes where CHOL-CHOL dimerization has been proposed to play a role. An example of this is the case of amyloid precursor protein C99-CHOL dimerization, which has been proposed to promote the formation of amyloidogenic A protein implicated in Alzheimer’s disease.100,101 The competition between C99-C99, C99-CHOL, and CHOL-CHOL dimer formations appears to be critical to this process, although the exact mechanism is unclear.102,103 Additionally, there is some evidence that -secretase, which cleaves C99 to form A, is concentrated in domains.104 If CHOL recruits C99 to the phase,102 CHOL may form homodimers, freeing C99 to bind with -secretase, thus forming A.
IV. CONCLUSION
In this work, we have investigated the effects of system size on macroscopic phase separation in lipid bilayers. We find that for the commonly investigated ternary lipid mixture, 35:35:30 DPPC:DIPC:CHOL, the system size must surpass 1480 lipids to observe the formation of stripe domains. This minimal number of lipids required for domain formation is likely to be similar or larger for other phase-separating mixtures, a conjecture supported by the predictions of a simple binary Flory-Huggins model. The binary Flory-Huggins model predicts a critical system size for domain formation and offers insight into the role of temperature, interaction energies, and system size in the domain formation process.
We have observed the coexistence of macro- and microscopic domains within a “type II” macroscopic domain-forming mixture, in contrast to earlier observations. We have also quantified the effect of inter-leaflet contacts on the formation of domains. Additionally, we observe the spatial distribution of DPPC and CHOL observed in domains to be consistent with the formation of 6:1 DPPC:CHOL complexes. Similar complexes are observed in the phase formed by DIPC:CHOL in sufficiently large systems. Finally, we observe the preferential formation of CHOL-CHOL dimers over monomers in the phase.
Taken together these observations demonstrate the importance of finite size effects in lipid phase separations. The importance of this observation is two-fold. There is a need to consider finite size effects when modeling phase behavior in lipid mixtures that is experimentally observed on the thermodynamic scale. In addition, when considering the biological importance of phase separation, as in discussions of the existence and relevance of liquid-ordered “raft” domains, the observations made in this work suggest a lower limit on the size of domain formation in biological membrane.
SUPPLEMENTARY MATERIAL
See supplementary material for system composition and dimensions, molar fractions (), interaction penalties (), line tensions (), critical system sizes (Nc), histograms of liquid crystal (P2), and absolute value of bond-orientational order parameters () at equilibrium, visualizations of and P2, distributions of intra- (n) and inter-leaflet (m) clusters of DPPC-CHOL and DIPC-CHOL at equilibrium, and domain impurities at equilibrium, and CHOL-lipid nearest neighbor distributions at equilibrium. Additionally, it describes the binary Flory-Huggins model in detail.
ACKNOWLEDGMENTS
G.A.P. thanks the NSF GRFP for support under NSF Grant No. DGE-1247312. T.N. gratefully acknowledges the support by a Grant-in-Aid for Young Scientists (B) under Grant No. 26790083. J.E.S. is grateful to the Japan Society for the Promotion of Science (JSPS) Invitation Fellowship (Grant No. L13523) and BRIDGE Fellowship (Grant No. BR160401) during his stay at Nagoya University and thanks Professor Y. Okamoto for helpful discussions. We also acknowledge the generous support of the National Science Foundation (Grant No. CHE-1362524) and the National Institutes of Health (Grant No. R01 GM107703).
REFERENCES
- 1.Carquin M., D’Auria L., Pollet H., Bongarzone E. R., and Tyteca D., Prog. Lipid Res. 62, 1 (2016). 10.1016/j.plipres.2015.12.004 [DOI] [PMC free article] [PubMed] [Google Scholar]
- 2.Nicolson G. L., “The Fluid—Mosaic model of membrane structure: Still relevant to understanding the structure, function and dynamics of biological membranes after more than 40 years,” Biochim. Biophys. Acta, Biomembr. 1838, 1451 (2014). 10.1016/j.bbamem.2013.10.019 [DOI] [PubMed] [Google Scholar]
- 3.Sampaio J. L., Gerl M. J., Klose C., Ejsing C. S., Beug H., Simons K., and Shevchenko A., Proc. Natl. Acad. Sci. U. S. A. 108, 1903 (2011). 10.1073/pnas.1019267108 [DOI] [PMC free article] [PubMed] [Google Scholar]
- 4.Giang H., Shlomovitz R., and Schick M., Essays Biochem. 57, 21 (2015). 10.1042/bse0570021 [DOI] [PubMed] [Google Scholar]
- 5.Saliba A.-E., Vonkova I., Deghou S., Ceschia S., Tischer C., Kugler K. G., Bork P., Ellenberg J., and Gavin A.-C., Nat. Protoc. 11, 1021 (2016). 10.1038/nprot.2016.059 [DOI] [PubMed] [Google Scholar]
- 6.Edidin M., Curr. Opin. Struct. Biol. 7, 528 (1997). 10.1016/s0959-440x(97)80117-0 [DOI] [PubMed] [Google Scholar]
- 7.Eggeling C., Ringemann C., Medda R., Schwarzmann G., Sandhoff K., Polyakova S., Belov V. N., Hein B., von Middendorff C., Schönle A., and Hell S. W., Nature 457, 1159 (2009). 10.1038/nature07596 [DOI] [PubMed] [Google Scholar]
- 8.Toulmay A. and Prinz W. A., J. Cell Biol. 202, 35 (2013). 10.1083/jcb.201301039 [DOI] [PMC free article] [PubMed] [Google Scholar]
- 9.Sonnino S. and Prinetti A., Curr. Med. Chem. 20, 4 (2012). 10.2174/0929867311302010004 [DOI] [PubMed] [Google Scholar]
- 10.Koynova R. and Caffrey M., Biochim. Biophys. Acta, Rev. Biomembr. 1376, 91 (1998). 10.1016/s0304-4157(98)00006-9 [DOI] [PubMed] [Google Scholar]
- 11.McConnell H. M. and Vrljic M., Annu. Rev. Biophys. Biomol. Struct. 32, 469 (2003). 10.1146/annurev.biophys.32.110601.141704 [DOI] [PubMed] [Google Scholar]
- 12.Feigenson G. W. G., Annu. Rev. Biophys. Biomol. Struct. 36, 63 (2007). 10.1146/annurev.biophys.36.040306.132721 [DOI] [PMC free article] [PubMed] [Google Scholar]
- 13.Feigenson G. W., Biochim. Biophys. Acta, Biomembr. 1788, 47 (2009). 10.1016/j.bbamem.2008.08.014 [DOI] [PMC free article] [PubMed] [Google Scholar]
- 14.Ackerman D. G. and Feigenson G. W., J. Phys. Chem. B 119, 4240 (2015). 10.1021/jp511083z [DOI] [PMC free article] [PubMed] [Google Scholar]
- 15.Lingwood D. and Simons K., Science 327, 46 (2010). 10.1126/science.1174621 [DOI] [PubMed] [Google Scholar]
- 16.Simons K. and Ikonen E., Nature 387, 569 (1997). 10.1038/42408 [DOI] [PubMed] [Google Scholar]
- 17.Bray A. J., Adv. Phys. 43, 357 (1994). 10.1080/00018739400101505 [DOI] [Google Scholar]
- 18.Yanagisawa M., Imai M., Masui T., Komura S., and Ohta T., Biophys. J. 92, 115 (2007). 10.1529/biophysj.106.087494 [DOI] [PMC free article] [PubMed] [Google Scholar]
- 19.Levental I. and Veatch S., J. Mol. Biol. 428, 4749 (2016). 10.1016/j.jmb.2016.08.022 [DOI] [PMC free article] [PubMed] [Google Scholar]
- 20.Pathak P. and London E., Biophys. J. 109, 1630 (2015). 10.1016/j.bpj.2015.08.029 [DOI] [PMC free article] [PubMed] [Google Scholar]
- 21.Edidin M., Nat. Rev. Mol. Cell Biol. 4, 414 (2003). 10.1038/nrm1102 [DOI] [PubMed] [Google Scholar]
- 22.Simons K. and Vaz W. L. C., Annu. Rev. Biophys. Biomol. Struct. 33, 269 (2004). 10.1146/annurev.biophys.32.110601.141803 [DOI] [PubMed] [Google Scholar]
- 23.Chan Y.-H. M. and Boxer S. G., Curr. Opin. Chem. Biol. 11, 581 (2007). 10.1016/j.cbpa.2007.09.020 [DOI] [PMC free article] [PubMed] [Google Scholar]
- 24.Seelig J., Q. Rev. Biophys. 10, 353 (1977). 10.1017/s0033583500002948 [DOI] [PubMed] [Google Scholar]
- 25.Davis J. H., Biochim. Biophys. Acta, Rev. Biomembr 737, 117 (1983). 10.1016/0304-4157(83)90015-1 [DOI] [PubMed] [Google Scholar]
- 26.Grélard A., Loudet C., Diller A., and Dufourc E. J., “NMR spectroscopy of lipid bilayers,” in Membrane Protein Structure Determination: Methods and Protocols, edited by Lacapére J.-J. (Humana Press, Totowa, NJ, 2010), pp. 341–359. [DOI] [PubMed] [Google Scholar]
- 27.Opella S. J., Acc. Chem. Res. 46, 2145 (2013). 10.1021/ar400067z [DOI] [PMC free article] [PubMed] [Google Scholar]
- 28.Veatch S. L. and Keller S. L., Biophys. J. 85, 3074 (2003). 10.1016/s0006-3495(03)74726-2 [DOI] [PMC free article] [PubMed] [Google Scholar]
- 29.Veatch S. L., Cicuta P., Sengupta P., Honerkamp-Smith A., Holowka D., and Baird B., ACS Chem. Biol. 3, 287 (2008). 10.1021/cb800012x [DOI] [PubMed] [Google Scholar]
- 30.Klymchenko A. S. and Kreder R., Chem. Biol. 21, 97 (2014). 10.1016/j.chembiol.2013.11.009 [DOI] [PubMed] [Google Scholar]
- 31.Basit H., Lopez S. G., and Keyes T. E., Methods 68, 286 (2014). 10.1016/j.ymeth.2014.02.005 [DOI] [PubMed] [Google Scholar]
- 32.Hermann E., Ries J., and García-Sáez A. J., “Scanning fluorescence correlation spectroscopy on biomembranes,” in Methods in Membrane Lipids, edited by Owen D. M. (Springer, New York, NY, 2015), pp. 181–197. [DOI] [PubMed] [Google Scholar]
- 33.Nagle J. F. and Tristram-Nagle S., Biochim. Biophys. Acta 1469, 159 (2000). 10.1016/s0304-4157(00)00016-2 [DOI] [PMC free article] [PubMed] [Google Scholar]
- 34.Pabst G., Kučerka N., Nieh M.-P., Rheinstädter M. C., and Katsaras J., Chem. Phys. Lipids 163, 460 (2010). 10.1016/j.chemphyslip.2010.03.010 [DOI] [PubMed] [Google Scholar]
- 35.Nagle J. F., Faraday Discuss. 161, 11 (2013). 10.1039/c2fd20121f [DOI] [PMC free article] [PubMed] [Google Scholar]
- 36.Marquardt D., Geier B., and Pabst G., Membranes 5, 180 (2015). 10.3390/membranes5020180 [DOI] [PMC free article] [PubMed] [Google Scholar]
- 37.Müller D. J. and Anderson K., Trends Biotechnol. 20, S45 (2002). 10.1016/s0167-7799(02)02000-012570160 [DOI] [Google Scholar]
- 38.Dimova R., Aranda S., Bezlyepkina N., Nikolov V., Riske K. A., and Lipowsky R., J. Phys.: Condens. Matter 18, S1151 (2006). 10.1088/0953-8984/18/28/s04 [DOI] [PubMed] [Google Scholar]
- 39.Andrecka J., Spillane K. M., Ortega-Arroyo J., and Kukura P., ACS Nano 7, 10662 (2013). 10.1021/nn403367c [DOI] [PubMed] [Google Scholar]
- 40.Bagatolli L. A. and Needham D., Chem. Phys. Lipids 181, 99 (2014). 10.1016/j.chemphyslip.2014.02.009 [DOI] [PubMed] [Google Scholar]
- 41.Komura S., Shirotori H., Olmsted P. D., and Andelman D., Europhys. Lett. 67, 321 (2004). 10.1209/epl/i2004-10057-1 [DOI] [Google Scholar]
- 42.Radhakrishnan A. and McConnell H., Proc. Natl. Acad. Sci. U. S. A. 102, 12662 (2005). 10.1073/pnas.0506043102 [DOI] [PMC free article] [PubMed] [Google Scholar]
- 43.Tumaneng P. W., Pandit S. A., Zhao G., and Scott H. L., Phys. Rev. E: Stat., Nonlinear, Soft Matter Phys. 83, 031925 (2011). 10.1103/physreve.83.031925 [DOI] [PMC free article] [PubMed] [Google Scholar]
- 44.Tumaneng P. W., Pandit S. A., Zhao G., and Scott H. L., J. Chem. Phys. 132, 065104 (2010). 10.1063/1.3314729 [DOI] [PMC free article] [PubMed] [Google Scholar]
- 45.Idema T., Van Leeuwen J. M. J., and Storm C., Phys. Rev. E: Stat., Nonlinear, Soft Matter Phys. 80, 04192 (2009). 10.1103/physreve.80.041924 [DOI] [PubMed] [Google Scholar]
- 46.Reigada R., Buceta J., Gómez J., Sagués F., and Lindenberg K., J. Chem. Phys. 128, 025102 (2008). 10.1063/1.2817333 [DOI] [PubMed] [Google Scholar]
- 47.Pastor R. W., Curr. Opin. Struct. Biol. 4, 486 (1994). 10.1016/s0959-440x(94)90209-7 [DOI] [Google Scholar]
- 48.Tobias D. J., Tu K., and Klein M. L., Curr. Opin. Colloid Interface Sci. 2, 15 (1997). 10.1016/s1359-0294(97)80004-0 [DOI] [Google Scholar]
- 49.Tieleman D. P., Marrink S. J., and Berendsen H. J. C., Biochim. Biophys. Acta, Rev. Biomembr 1331, 235 (1997). 10.1016/s0304-4157(97)00008-7 [DOI] [PubMed] [Google Scholar]
- 50.Jakobsson E., Trends Biochem. Sci. 22, 339 (1997). 10.1016/s0968-0004(97)01096-7 [DOI] [PubMed] [Google Scholar]
- 51.Forrest L., Curr. Opin. Struct. Biol. 10, 174 (2000). 10.1016/s0959-440x(00)00066-x [DOI] [PubMed] [Google Scholar]
- 52.Pastor R. W., Venable R. M., and Feller S. E., Acc. Chem. Res. 35, 438 (2002). 10.1021/ar0100529 [DOI] [PubMed] [Google Scholar]
- 53.Marrink S. J., de Vries A. H., and Tieleman D. P., Biochim. Biophys. Acta, Biomembr. 1788, 149 (2009). 10.1016/j.bbamem.2008.10.006 [DOI] [PubMed] [Google Scholar]
- 54.Bennett W. F. D. and Tieleman D. P., Biochim. Biophys. Acta, Biomembr. 1828, 1765 (2013). 10.1016/j.bbamem.2013.03.004 [DOI] [PubMed] [Google Scholar]
- 55.Zhuang X., Makover J. R., Im W., and Klauda J. B., Biochim. Biophys. Acta, Biomembr. 1838, 2520 (2014). 10.1016/j.bbamem.2014.06.010 [DOI] [PubMed] [Google Scholar]
- 56.Ollila O. H. S. and Pabst G., Biochim. Biophys. Acta, Biomembr. 1858, 2512 (2016). 10.1016/j.bbamem.2016.01.019 [DOI] [PubMed] [Google Scholar]
- 57.Mori T., Miyashita N., Im W., Feig M., and Sugita Y., Biochim. Biophys. Acta, Biomembr. 1858, 1635 (2016). 10.1016/j.bbamem.2015.12.032 [DOI] [PMC free article] [PubMed] [Google Scholar]
- 58.Bandara A., Panahi A., Pantelopulos G. A., and Straub J. E., J. Comput. Chem. 38, 1479 (2017). 10.1002/jcc.24516 [DOI] [PMC free article] [PubMed] [Google Scholar]
- 59.Patel D. S., Park S., Wu E. L., Yeom M. S., Widmalm G., Klauda J. B., and Im W., Biophys. J. 111, 1987 (2016). 10.1016/j.bpj.2016.09.021 [DOI] [PMC free article] [PubMed] [Google Scholar]
- 60.Marrink S. J., Risselada J., and Mark A. E., Chem. Phys. Lipids 135, 223 (2005). 10.1016/j.chemphyslip.2005.03.001 [DOI] [PubMed] [Google Scholar]
- 61.Schafer L. V., de Jong D. H., Holt A., Rzepiela A. J., de Vries A. H., Poolman B., Killian J. A., and Marrink S. J., Proc. Natl. Acad. Sci. U. S. A. 108, 1343 (2011). 10.1073/pnas.1009362108 [DOI] [PMC free article] [PubMed] [Google Scholar]
- 62.Perlmutter J. D. and Sachs J. N., J. Am. Chem. Soc. 133, 6563 (2011). 10.1021/ja106626r [DOI] [PubMed] [Google Scholar]
- 63.Duncan S. L., Dalal I. S., and Larson R. G., Biochim. Biophys. Acta, Biomembr. 1808, 2450 (2011). 10.1016/j.bbamem.2011.06.026 [DOI] [PubMed] [Google Scholar]
- 64.Domański J., Marrink S. J., and Schäfer L. V., Biochim. Biophys. Acta, Biomembr. 1818, 984 (2012). 10.1016/j.bbamem.2011.08.021 [DOI] [PubMed] [Google Scholar]
- 65.Hakobyan D. and Heuer A., J. Phys. Chem. B 117, 3841 (2013). 10.1021/jp312245y [DOI] [PubMed] [Google Scholar]
- 66.Davis R. S., Sunil Kumar P. B., Sperotto M. M., and Laradji M., J. Phys. Chem. B 117, 4072 (2013). 10.1021/jp4000686 [DOI] [PubMed] [Google Scholar]
- 67.Yeh I.-C., J. Phys. Chem. B 108, 15873 (2004). 10.1021/jp0477147 [DOI] [Google Scholar]
- 68.Takemura K. and Kitao A., J. Phys. Chem. B 111, 11870 (2007). 10.1021/jp0756247 [DOI] [PubMed] [Google Scholar]
- 69.Chandramouli B., Zazza C., Mancini G., and Brancato G., J. Phys. Chem. A 119, 5465 (2015). 10.1021/jp511824t [DOI] [PubMed] [Google Scholar]
- 70.Klauda J. B., Brooks B. R., and Pastor R. W., J. Chem. Phys. 125, 144710 (2006). 10.1063/1.2354486 [DOI] [PMC free article] [PubMed] [Google Scholar]
- 71.Castro-Román F., Benz R. W., White S. H., and Tobias D. J., J. Phys. Chem. B 110, 24157 (2006). 10.1021/jp064746g [DOI] [PubMed] [Google Scholar]
- 72.Camley B. A., Lerner M. G., Pastor R. W., and Brown F. L. H., J. Chem. Phys. 143, 243113 (2015). 10.1063/1.4932980 [DOI] [PMC free article] [PubMed] [Google Scholar]
- 73.Scott W., Müller-Plathe F., and Gunsteren W. F. V., Mol. Phys. 82, 1049 (1994). 10.1080/00268979400100744 [DOI] [Google Scholar]
- 74.Huang J. and Feigenson G. W., Biophys. J. 65, 1788 (1993). 10.1016/s0006-3495(93)81234-7 [DOI] [PMC free article] [PubMed] [Google Scholar]
- 75.Nagai T., Ueoka R., and Okamoto Y., J. Phys. Soc. Jpn. 81, 024002 (2012). 10.1143/jpsj.81.024002 [DOI] [Google Scholar]
- 76.Melo M. N., Ingólfsson H. I., and Marrink S. J., J. Chem. Phys. 143, 243152 (2015). 10.1063/1.4937783 [DOI] [PubMed] [Google Scholar]
- 77.Marrink S. J., Risselada H. J., Yefimov S., Tieleman D. P., and Vries A. H. D., J. Phys. Chem. B 111, 7812 (2007). 10.1021/jp071097f [DOI] [PubMed] [Google Scholar]
- 78.Dvinskikh S. V., Castro V., and Sandström D., Phys. Chem. Chem. Phys. 7, 3255 (2005). 10.1039/b508190d [DOI] [PubMed] [Google Scholar]
- 79.Wassenaar T. A., Ingólfsson H. I., Böckmann R. A., Tieleman D. P., and Marrink S. J., J. Chem. Theory Comput. 11, 2144 (2015). 10.1021/acs.jctc.5b00209 [DOI] [PubMed] [Google Scholar]
- 80.Pronk S., Páll S., Schulz R., Larsson P., Bjelkmar P., Apostolov R., Shirts M. R., Smith J. C., Kasson P. M., Van Der Spoel D., Hess B., and Lindahl E., Bioinformatics 29, 845 (2013). 10.1093/bioinformatics/btt055 [DOI] [PMC free article] [PubMed] [Google Scholar]
- 81.De Jong D. H., Baoukina S., Ingólfsson H. I., and Marrink S. J., Comput. Phys. Commun. 199, 1 (2016). 10.1016/j.cpc.2015.09.014 [DOI] [Google Scholar]
- 82.Camesasca M., Kaufman M., and Manas-Zloczower I., Macromol. Theory Simul. 15, 595 (2006). 10.1002/mats.200600037 [DOI] [Google Scholar]
- 83.Brandani G. B., Schor M., MacPhee C. E., Grubmüller H., Zachariae U., and Marenduzzo D., PLoS ONE 8, e65617 (2013). 10.1371/journal.pone.0065617 [DOI] [PMC free article] [PubMed] [Google Scholar]
- 84.Liang Q., Wu Q.-Y., and Wang Z.-Y., J. Chem. Phys. 141, 074702 (2014). 10.1063/1.4891931 [DOI] [PubMed] [Google Scholar]
- 85.Parton D. L., Tek A., Baaden M., and Sansom M. S. P., PLoS Comput. Biol. 9, e1003034 (2013). 10.1371/journal.pcbi.1003034 [DOI] [PMC free article] [PubMed] [Google Scholar]
- 86.Rosetti C. and Pastorino C., J. Phys. Chem. B 115, 1002 (2011). 10.1021/jp1082888 [DOI] [PubMed] [Google Scholar]
- 87.Komura S., Shirotori H., and Olmsted P. D., J. Phys.: Condens. Matter 17, S2951 (2005). 10.1088/0953-8984/17/31/023 [DOI] [Google Scholar]
- 88.Flory P. J., J. Chem. Phys. 10, 51 (1942). 10.1063/1.1723621 [DOI] [Google Scholar]
- 89.Curtis E. M., Xiao X., Sofou S., and Hall C. K., Langmuir 31, 1086 (2015). 10.1021/la504082x [DOI] [PMC free article] [PubMed] [Google Scholar]
- 90.Basu I. and Mukhopadhyay C., Phys. Chem. Chem. Phys. 17, 17130 (2015). 10.1039/c5cp01970b [DOI] [PubMed] [Google Scholar]
- 91.Hong C., Tieleman D. P., and Wang Y., Langmuir 30, 11993 (2014). 10.1021/la502363b [DOI] [PMC free article] [PubMed] [Google Scholar]
- 92.MacDermaid C. M., Kashyap H. K., DeVane R. H., Shinoda W., Klauda J. B., Klein M. L., and Fiorin G., J. Chem. Phys. 143, 243144 (2015). 10.1063/1.4937153 [DOI] [PubMed] [Google Scholar]
- 93.Rosetti C. and Pastorino C., J. Phys. Chem. B 116, 3525 (2012). 10.1021/jp212406u [DOI] [PubMed] [Google Scholar]
- 94.Sodt A. J., Sandar M. L., Gawrisch K., Pastor R. W., and Lyman E., J. Am. Chem. Soc. 136, 725 (2014). 10.1021/ja4105667 [DOI] [PMC free article] [PubMed] [Google Scholar]
- 95.Almeida P. F. F., Biochim. Biophys. Acta, Biomembr. 1788, 72 (2009). 10.1016/j.bbamem.2008.08.007 [DOI] [PubMed] [Google Scholar]
- 96.Zhang Z., Sperotto M. M., Zuckermann M. J., and Mouritsen O. G., Biochim. Biophys. Acta, Biomembr. 1147, 154 (1993). 10.1016/0005-2736(93)90326-u [DOI] [PubMed] [Google Scholar]
- 97.Risbo J., Sperotto M. M., and Mouritsen O. G., J. Chem. Phys. 103, 3643 (1995). 10.1063/1.470041 [DOI] [Google Scholar]
- 98.Javanainen M., Martinez-Seara H., and Vattulainen I., Sci. Rep. 7, 1143 (2017). 10.1038/s41598-017-01247-9 [DOI] [PMC free article] [PubMed] [Google Scholar]
- 99.Kim K., Choi S. Q., Zell Z. A., Squires T. M., and Zasadzinski J. A., Proc. Natl. Acad. Sci. U. S. A. 110, E3054 (2013). 10.1073/pnas.1303304110 [DOI] [PMC free article] [PubMed] [Google Scholar]
- 100.Song Y., Mittendorf K. F., Lu Z., and Sanders C. R., J. Am. Chem. Soc. 136, 4093 (2014). 10.1021/ja4114374 [DOI] [PMC free article] [PubMed] [Google Scholar]
- 101.Winkler E., Julius A., Steiner H., and Langosch D., Biochemistry 54, 6149 (2015). 10.1021/acs.biochem.5b00986 [DOI] [PubMed] [Google Scholar]
- 102.Song Y., Hustedt E. J., Brandon S., and Sanders C. R., Biochemistry 52, 5051 (2013). 10.1021/bi400735x [DOI] [PMC free article] [PubMed] [Google Scholar]
- 103.Panahi A., Bandara A., Pantelopulos G. A., Dominguez L., and Straub J. E., J. Phys. Chem. Lett. 7, 3535 (2016). 10.1021/acs.jpclett.6b01624 [DOI] [PMC free article] [PubMed] [Google Scholar]
- 104.Ehehalt R., Keller P., Haass C., Thiele C., and Simons K., J. Cell Biol. 160, 113 (2003). 10.1083/jcb.200207113 [DOI] [PMC free article] [PubMed] [Google Scholar]
Associated Data
This section collects any data citations, data availability statements, or supplementary materials included in this article.
Supplementary Materials
See supplementary material for system composition and dimensions, molar fractions (), interaction penalties (), line tensions (), critical system sizes (Nc), histograms of liquid crystal (P2), and absolute value of bond-orientational order parameters () at equilibrium, visualizations of and P2, distributions of intra- (n) and inter-leaflet (m) clusters of DPPC-CHOL and DIPC-CHOL at equilibrium, and domain impurities at equilibrium, and CHOL-lipid nearest neighbor distributions at equilibrium. Additionally, it describes the binary Flory-Huggins model in detail.


