

Abstract
Purpose
ABY-029, a synthetic Affibody peptide, Z03115-Cys, labeled with a near-infrared fluorophore, IRDye® 800CW, targeting epidermal growth factor receptor has been produced under Good Manufacturing Practices for an FDA approved first-in-use human study during surgical resection of glioma, as well as other tumors. Here, the pharmacology, phototoxicity, receptor activity and biodistribution studies of ABY-029 were completed in rats, prior to the intended human use.
Procedures
Male and female Sprague-Dawley rats were administered a single intravenous dose of varying concentrations (0, 245, 2449, and 24,490 µg/kg corresponding to 10X, 100X, and 1000X an equivalent human microdose level) of ABY-029 and observed for up to 14 days. Histopathological assessment of organs and tissues, clinical chemistry and hematology were performed. In addition, pharmacokinetic clearance, and biodistribution of ABY-029 were studied in sub-groups of the animals. Phototoxicity and ABY-029 binding to human and rat EGFR were assessed in cell culture and on immobilized receptors, respectively.
Results
Histopathological assessment, and hematological and clinical chemistry analysis demonstrated that single-dose ABY-029 produced no pathological evidence of toxicity at any dose level. No phototoxicity was observed in EGFR positive and negative glioma cell lines. Binding strength and pharmacokinetics of the anti-EGFR Affibody molecules were retained after labeling with the dye.
Conclusion
Based on the successful safety profile of ABY-029, the 1000X human microdose 24.5 mg/kg was identified as the no observed adverse effect level (NOAEL) following intravenous administration. Conserved binding strength and no observed light toxicity also demonstrated ABY-029 safety for human use.
Keywords: Affibody, IRDye 800CW, ABY-029, fluorescence guided surgery, epidermal growth factor receptor, EGFR, glioma
Introduction
Oncological surgery to remove tumor masses is highly reliant on the complete and accurate removal of tumor tissue, while sparing normal tissues. The use of fluorescently-labeled molecular targeting agents to increase the sensitivity of tumor margin detection in gliomas and other tumor tissues has been proposed, and here the pharmacological activity and biological safety profile were assayed for IRDye 800CW maleimide labeled anti-EGFR Affibody molecule (ABY-029). An exploratory investigational new drug (eIND) application for ABY-029 (eIND application 122681) has been approved with the US Food and Drug Administration (FDA) for first-in-human neurosurgery clinical trial using an injection level increasing slightly above the microdose range.
In recent years there has been a strong push to develop both fluorescence imaging systems [1] and platforms of fluorescent, molecular targeted compounds for surgical guidance [2]. The goal of these systems and targeted compounds is to supplement a surgeon’s view of the operative field with additional structural or functional information that would aid in further detecting tissues of interest. Fluorescence-guided surgery (FGS) using the orally administered pro-drug 5-aminolevulinic acid (5-ALA), which converts to the fluorescent protoporphyrin IX (PpIX) in vivo, has been extensively used to demonstrate a clear clinical benefit over white-light resection both in Germany [3–4] and in the USA at Dartmouth College (FDA IND #77,751) [5–7] for neurosurgical tumor resection. ALA-PpIX FGS has become the standard-of-care in many parts of the world for high-grade glioma resection after positive outcomes evaluation in a randomized Phase III trial [8] and assessment of standard-of-care treatment bias [9].
Although ALA-PpIX FGS has significantly and positively affected patient outcomes with high-grade gliomas, it is not necessarily ideal in surgical resection. Contrast from ALA-induced PpIX in glioma tumors is based on increased delivery of ALA to the tumor from blood-brain-barrier breakdown and production of PpIX from high cell metabolism. While this is beneficial for high-grade gliomas, low tumor-to-normal brain contrast is observed for low-grade gliomas; in addition, extacellular PpIX diffusion potentially causes misinterpretation of tumor boundaries. Moreover, contrast is reduced outside of the brain where normal tissue accumulation of ALA and subsequent production of PpIX is not limited by the blood-brain-barrier. Thus, there is clinical motivation for the development of new fluorescent probes that bind specifically to tumor cells, regardless of tumor grade, and could be extended to tissues outside of the brain.
Epidermal growth factor receptor (EGFR) is overexpressed in approximately 50% of malignant gliomas [10], and highly overexpressed in a wealth of other tumor types, such as head and neck cancers (~90%) [11]. Moreover, a vast amount of literature exists on targeting EGFR overexpression [12–19]. A large effort has been put forth for EGFR targeted imaging of head and neck cancers at Stanford University using IRDye 800CW labeled anti-EGFR antibodies cetuximab and panitumumab [13, 16, 20–23] and has been met with great success. Recently, this group published a first-in-human safety and tumor specificity study of Cetuximab-IRDye800 [17], which successfully detected head and neck cancers with 3–4 times tumor to normal tissue contrast ratios; however, imaging occurs 3–4 days post-surgery due to the long plasma half-life and slow tissue penetration of antibodies.
A new class of synthetic peptides, called Affibody molecules, are non-immunoglobulin proteins based on a 58 amino acid, three-alpha-helical scaffold, can be produced using recombinant or protein synthesis techniques, and can be modified post-synthesis with functional groups for fluorescent or radioactive labeling, in this case with a single C-terminal cysteine [24–26]. In addition, their small size, stability, high affinity for their targets, rapid biodistribution, and normal tissue clearance make them ideal for in vivo imaging, especially when compared to antibodies. The majority of literature published on labeled Affibody molecules for tumor detection involves radiolabeled HER2-targeted moieties, several of which have been tested in humans with no adverse effects [27–30]. IRDye 800CW dye can be conjugated to proteins/peptides through several different chemistries, and the maleimide reactive form has the advantage of reacting to the unique C-terminal cysteine on the Affibody molecule. In addition, a near infrared fluorophore for optical imaging in tissues is ideal because the long wavelengths allow tissue autofluorescence to be avoided and increased depth penetration. IRDye 800CW carboxylate, the starting material for the maleimide reactive group, has undergone single-dose intravenous toxicity studies in rats, and demonstrated no adverse effects [31]. IRDye 800CW can be imaged in the indocyanine green channel that is already incorporated into many surgical microscopes, allowing for clinical use without large technological modifications. In addition, IRDye 800CW is currently being tested in humans in a number of clinical trials, including labeling of cetuximab [17], bevacizumab [32], and girentuiximab [33]. Pre-clinical studies of the IRDye 800CW labeled Affibody molecule targeting epidermal growth factor receptor (EGFR) have shown significant tumor detection using microdose levels [34], and increased detectability of the tumor margin in EGFR overexpressing tumors [35].
In this study, a drug product version of IRDye 800CW maleimide labeled anti-EGFR Affibody molecule (ABY-029) was produced under pre-Good Manufacturing Practice (pre-GMP) conditions, in preparation for a GMP production run matching all production conditions and expected tolerances. This pre-GMP batch was used to study the binding characteristics, safety profile, and biodistribution properties in normal Sprague-Dawley rats under Good Laboratory Practices (GLP). The results of this study were used to obtain FDA eIND approval for the first-in-human Phase 0 studies using a GMP batch of ABY-029 for tumor targeting and tumor boundary delineation during surgical resection of human glioma. This approach provided a relatively inexpensive development pipeline that can be used in the future for more early-phase imaging agents, within the funding framework provided by a NIH grant.
Material and Methods
ABY-029
ABY-029 (molecular weight of 7914.95 g/mol) is composed of an anti-EGFR Affibody molecule (Affibody, Sweden), a 58 amino acid synthetic peptide (Z03115) and IRDye 800CW (LI-COR Biosciences, Inc, Lincoln, NE). The synthetic peptide, Z03115-Cys, developed by Affibody, was synthesized at Bachem AG (Switzerland) as a subcontractor. IRDye 800CW maleimide conjugation to the Z03115-Cys molecule was performed at the University of Alabama Birmingham (UAB) Vector Production Facility (Birmingham, AL) and tested for purity, long-term stability during storage. The ABY-029 molecule was received solubilized in PBS at concentrations of 0.036, 0.42 and 4.9 mg/ml for administration of 245, 2449, and 24,490 µg/kg doses (10, 100 and 1000X times the human equivalent dose, respectively, calculated using the method of Reagan-Shaw, et al. (2008) [36]).
Binding Assays
A Biacore X100 instrument (GE Healthcare, Pittsburg PA) was used for real-time bio-specific interactions between ABY-029 and both rat and human EGFR. The detailed methods on chip preparation and running conditions are provided in the Electronic Supplementary Material (ESM). The dissociation equilibrium (KD, where KD = koff/kon), the dissociation (koff), and the association (kon) rate constants determined.
Phototoxicity Assay
The photoxicity of ABY-029 was compared to the known photosensitizer benzoporphyrin derivative (BPD, verteporfin) in an EGFR negative (F98) and EGFR positive (F98-EGFR) rat undifferentiated malignant glioma cell line (ATCC, Manassas, VA). The phototoxicity assay was performed in triplicate. Cells were plated in 96-well plates at 5×10⁴ cells/well 48 hours prior to irradiation. One hour prior to irradiation, the cells were incubated with 70 nM of ABY-029 or BPD in cell culture media. Control cells were incubated without addition of either ABY-029 or BPD. A 690 nm laser, at 100 mW/cm2, was used to irradiate 4 wells simultaneously in order to deliver a total of 0–200 J/cm2 light dose. The 0 J/cm2 group did not receive any light but underwent the same procedures as the light dose groups. The cells were returned to the incubator for a 24-hour period when an MTT assay was performed according to manufacturer’s instructions (Sigma-Aldrich, St. Louis, MO). The colorimetric results from the MTT assay were normalized to the zero drug, 0 J/cm2 dose for each of the three trials. Statistical significance was determined for each cell line between control and ABY-029 or BPD, and between cell lines for each treatment group using a two-tailed, unpaired equal variance Student’s t-test, where p < 0.05.
Animals
All animal procedures were performed according to a protocol approved by the Institutional Animal Care and Use Committee at Dartmouth College. In addition, the animal study was conducted according to the US FDA Good Laboratory Practice regulations 21CFR Part 58 at the Surgical Research Laboratories, a GLP facility at Dartmouth College under the direction of Dr. P. Jack Hoopes. Male and female Sprague Dawley rats (Charles River Laboratories Inc., Wilmington, MA) were obtained and were between the ages of 5–8 weeks and 176–300 g at dosing. A total of 134 rats (67 male and 67 female) were used for the following studies: Safety Study and Clinical Pathology (n=96, 48 male and 48 female), Biodistribution (n=12, 6 male and 6 female), Pharmacokinetics (n=26, 13 male and 13 female).
Safety Study and Clinical Pathology
Animals were weighed prior to ABY-029 administration, on Day 1, 7 and 14 prior to necropsy. The animals were injected intravenously on Day 0 in the tail vein with 0, 245, 2449, or 24,490 µg/kg of the ABY-029 molecule in phosphate buffer solution. Animals were observed twice daily for the first 3 days during the study period and then once daily for the remainder of the study. Half the animals (n=48, 24 male and 24 female) were sacrificed on Day 1 and the other half (n=48, 24 male and 24 female) were sacrificed on Day 14 followed by a complete necropsy.
Safety Study
Euthanasia was performed by exsanguination under isofluorane anesthesia (2%, 1 l/min oxygen). The tissues and organs collected from each animal were processed for pathological evaluation using Standard Operating Protocols of the Research Pathology Services at Dartmouth College. Prior to fixation the brain, heart, lungs, kidneys, pancreas, liver, and testes, or ovaries, and uterus/vagina/uterine horns were weighed and normalized to body weight to account for large size differences. Hematoxylin and eosin stained tissues slices were prepared and evaluated microscopically by a veterinarian pathologist, Dr. Roger Wells, DVM, MS, DACVP (Consulting Tox/Path Services, LLC, Kittery ME).
Clinical Pathology
Animals were fasted with unlimited fluid supply for 12 h prior to euthanasia. Blood samples were collected under anesthesia and during exsanguination for analysis by Antech (Weymouth, MA). Approximately 0.5 ml of blood was collected for hematology and placed in a tube containing K2EDTA (Becton, Dickinson & Co., Franklin Lakes, NJ) and 1.0 ml was collected for clinical chemistry and placed in a BP Microcontainer PST tube with lithium heparin (Becton, Dickinson & Co., Franklin Lakes, NJ). The tubes were centrifuged in a microcentrifuge at max speed for 5 min. Normal values for 5–8 week old rat hematology and clinical chemistries were obtained from several literature sources [31, 37–38].
Biodistribution
Animals were administered 2,449 µg/kg ABY-029 via tail vein injection 1 hour before sacrifice by cervical dislocation under isofluroane anesthesia (2%, 1 l/min oxygen). The brain, heart, lungs, liver, kidneys, duodenum, skin, muscle, mesenteric lymph nodes, testes and/or ovaries were removed, placed on a glass slide and imaged in the 800-nm channel of the Pearl Imaging System. Average bulk fluorescence signal from ABY-029 for each organ was determined using ImageJ (NIH) without correcting for tissue optical properties.
Pharmacokinetics
Sprague Dawley rats were purchased from Charles River with jugular vein catheters surgically implanted. Care for the animals and the catheters were performed as described by Charles River instructions (ESM). Animals were bled with no more than 10% of their total blood volume removed within a 24 h time frame. The animals were bled in 2 separate groups: Group 1- 0, 1, 10, 30 min, 1, 2, 6, 48 h and Group 2- 0, 5, 15 min, 1, 4, 12, 24 h where data was normalized to the 1 h time point to account for injection differences. ABY-029 (2449 µg/kg) was administered via the rail vein and at selected time points, the blood was sampled via IV catheter. All syringes, pipette tips, and vials used to collect blood were pre-rinsed with Heparin (Sagent Pharmaceuticals, Schaumburg, IL) to prevent coagulation. Each blood sample was centrifuged (10 min, 2500 rpm, 4 °C) to separate red blood cells from plasma and the resulting plasma layer removed for fluorescence analysis (ESM). Standard curve production and analysis is described in detail in the ESM.
Results
Binding Assays
The binding parameters and fitting results for both rat and human EGFR are summarized in Table 1. The binding between ABY-029 and human EGFR displays a higher rate constant than that between ABY-029 and rat EGFR.
Table 1.
Binding parameters of ABY-029 with human and rat EGFR, as measured by surface plasmon resonance.
| Fit Parameter |
Human EGFR | Rat EGFR | ||
|---|---|---|---|---|
| Average | St. Dev. | Average | St. Dev. | |
| kon (1/Ms) | 8×10⁵ | 2×10⁵ | 7×10⁵ | 2×10⁵ |
| koff (1/s) | 1.9×10⁻³ | 0.5×10⁻³ | 2×10⁻² | 3×10⁻² |
| KD(M) | 3×10⁻⁹ | 1×10⁻⁹ | 0.7×10⁻⁹ | 0.1×10⁻⁹ |
Phototoxicity Assay
There was a strong phototoxic effect observed with BPD in both F98 and F98-EGFR tumor cell lines (Fig. 1). In the F98 cell line BPD group, light doses at and exceeding 25 J/cm2 demonstrated statistical significance to both the No Drug + 0 J/cm2 group and the No Drug within each light dose group (p < 0.05), whereas in the F98-EGFR cell line all light doses above 0 J/cm2 displayed statistical significance to the No Drug + 0 J/cm2 group. For the cells treated with ABY-029, there was no phototoxic effect observed in either F98 or F98-EGFR cell lines. In the F98 group there was a positive significant difference in the 200 J/cm2 ABY-029 treatment group as compared to the No Drug + 0 J/cm2. There was no statistically significant effect of the ABY-029 alone on the growth of either cell lines as compared to the No Drug control.
Figure 1.
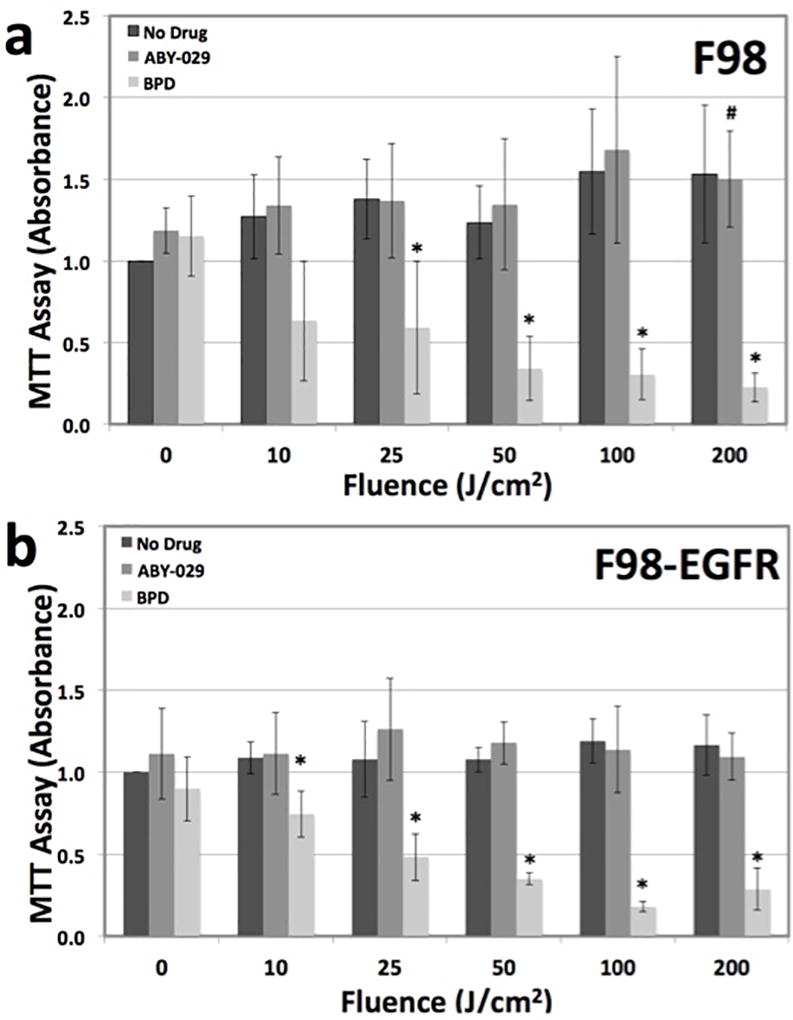
In vitro phototoxicity of ABY-029 compared to BPD, a common photosensitizing agent. a F98, an EGFR(−) cell line, demonstrates phototoxicity to BPD but not ABY-029. b F98-EGFR, an EGFR(+) cell line, also demonstrates phototoxicity to BPD and not ABY-029. * = statistical significance from No Drug + 0 J/cm2 group and No Drug within each light dose group, where p < 0.05. # = statistical significance from No Drug + 0 J/cm2 group, where p < 0.05. There was no statistical significance between any F98 and F98-EGFR group.
Safety Study and Clinical Pathology
Body weight
The body weight for all male and female rats are summarized in Table 2. For all treatment groups, both male and female rats gained weight between arrival and dosing. At dosing, the male, 24 h 2,449 µg/kg group (p=0.007) and the 14 day 2,449 and 24,490 µg/kg groups (p=0.01 and 0.002, respectively) had a significantly increased weight gain as compared to the control 0 µg/kg group. Additionally, at the time of necropsy, both male and female rats regardless of treatment group had lost weight within the 24 h from ABY-029 dosing. At the 24 h necropsy, the male 2,449 and 24,490 µg/kg groups were significantly heavier (p < 0.0004 and 0.02, respectively) than the control group; however, there was no significant difference in the amount of weight lost between any of the ABY-029 dosed groups and the control groups. At 7 days post-ABY-029 dosing, the male 24,490 µg/kg group was statistically heavier than the control (p < 0.006). At the 14-day necropsy, there was no statistical difference in any of the animal weights, although the male 2,449 and 24,490 µg/kg groups had a smaller change in weight from dosing than the controls (p < 0.02 and 0.01, respectively).
Table 2.
Body weight of male and female rats during ABY-029 safety study.
| WEIGHT (g, mean ± standard deviation) | ||||||||
|---|---|---|---|---|---|---|---|---|
| ABY-029 Dose (µg/kg) |
At Arrival |
At Dosing | At 7 Days | At Necropsy |
Δ Dosing to 7 Days |
Δ Dosing to Necropsy |
||
| 24 HOURS | FEMALE | 0 | 212±6 | 231±7 | 213±6 | −19±3 | ||
| 245 | 211±9 | 230±20 | 220±10 | −16±6 | ||||
| 2449 | 205±6 | 230±20 | 210±20 | −14±5 | ||||
| 24,490 | 206±6 | 230±10 | 217±9 | −16±4 | ||||
| MALE | 0 | 211±10 | 245±7 | 229±5 | −16±3 | |||
| 245 | 210±10 | 250±10 | 230±10 | −14±4 | ||||
| 2449 | 208±9 | 260±8* | 248±7* | −13±5 | ||||
| 24,490 | 206±6 | 260±10 | 240±10* | −16±4 | ||||
| 14 DAYS | FEMALE | 0 | 210±7 | 223±10 | 240±10 | 240±10 | 19±5 | 18±6 |
| 245 | 210±9 | 230±10 | 250±10 | 246±9 | 20±3 | 16±8 | ||
| 2449 | 205±6 | 231±9 | 250±7 | 252±9 | 18±5 | 20±10 | ||
| 24,490 | 202 ±7 | 230±7 | 245±8 | 242±9 | 15±3 | 12±6 | ||
| MALE | 0 | 204±10 | 240±10 | 294±13 | 330±20 | 54±4 | 90±10 | |
| 245 | 204±6 | 250±10 | 298±16 | 330±20 | 50±10 | 80±10 | ||
| 2449 | 207±6 | 260±10* | 308±13 | 330±20 | 47±6* | 70±9* | ||
| 24,490 | 202±9 | 270±10* | 320±10* | 330±20 | 49±9 | 70±10* | ||
p < 0.05, two-tailed even distribution Student’s T-test as compared to 0 µg/kg in each test group
Organ weight
For all animals, the weights of each organ was normalized to body weight at necropsy (Table 2) and are summarized in Table 3. All organ weights for both males and females were the same as the control group, with the following exceptions: 24-h, 24,490 µg/kg uterus (p < 0.04), 24 h 2,449 and 24,490 µg/kg brains (p < 0.05 and 0.04, respectively) and the 14-day 245 µg/kg lungs (p < 0.03).
Table 3.
Female organ weight normalized to body weight.
| ORGAN WEIGHT/BODY WEIGHT (×10−3, mean ± standard deviation) | ||||||||||||
|---|---|---|---|---|---|---|---|---|---|---|---|---|
|
|
||||||||||||
| ABY-029 Dose (µg/kg) |
Heart | Lung | Uterus | Ovary/ Testes 1 |
Ovary/ Testes 2 |
Spleen | Liver | Left Kidney + Adrenal |
Right Kidney + Adrenal |
Brain | ||
|
| ||||||||||||
| 24 HOURS | FEMALE | 0 | 3.8±0.4 | 6.1±0.3 | 3.0±0.7 | 0.20±0.05 | 0.23±0.04 | 2.1±0.1 | 31±2 | 4.5±0.2 | 4.3±0.2 | 9.6±0.5 |
|
| ||||||||||||
| 245 | 4.1±0.2 | 6.1±0.3 | 2.9±0.8 | 0.19±0.04 | 0.20±0.05 | 2.7±0.5 | 30±2 | 4.4±0.3 | 4.4±0.3 | 9.7±0.4 | ||
|
| ||||||||||||
| 2449 | 3.9±0.1 | 6.1±0.5 | 2.5±0.3 | 0.20±0.03 | 0.22±0.04 | 2.4 ± 0.3 | 29.7±0.9 | 4.4±0.3 | 4.3±0.3 | 10±1 | ||
|
| ||||||||||||
| 24,490 | 4.1±0.4 | 6.0±0.3 | 2.2±0.2* | 0.21±0.03 | 0.20±0.02 | 2.2±0.4 | 31±2 | 4.2±0.2 | 4.2 ±0.2 | 9.4±0.2 | ||
|
|
||||||||||||
| MALE | 0 | 4.0±0.2 | 5.5±0.2 | 6±1 | 5.6±0.2 | 2.6±0.3 | 32±2 | 4.9±0.6 | 5.2±7 | 9.0±0.7 | ||
|
| ||||||||||||
| 245 | 4.1±0.2 | 5.3±0.3 | 5.4±0.8 | 5.3±0.3 | 2.7±0.4 | 33±1 | 4.9±0.2 | 4.8±0.4 | 9.2±0.3 | |||
|
| ||||||||||||
| 2449 | 3.9±0.2 | 5.7±0.4 | 5.2±0.3 | 5.3±0.3 | 2.4±0.2 | 33±4 | 4.4±0.3 | 4.5±0.3 | 8.3±0.4* | |||
|
| ||||||||||||
| 24,490 | 4.0±0.3 | 5.6±0.5 | 5.1±0.5 | 5.1±0.6 | 2.5±0.3 | 30±1 | 4.6±0.3 | 4.4±0.2 | 8.1±0.6* | |||
|
| ||||||||||||
| 14 DAYS | FEMALE | 0 | 3.6±0.3 | 5.8±0.4 | 3.1±0.1 | 0.20±0.04 | 0.19±0.04 | 2.0±0.4 | 29±1 | 4.0 ±0.3 | 4.0±0.3 | 8.5±0.5 |
|
| ||||||||||||
| 245 | 3.5±0.1 | 5.6±0.4 | 2.7±0.6 | 0.19±0.03 | 0.21±0.02 | 2.3±0.2 | 29±2 | 3.8±0.2 | 3.8±0.3 | 8.8±0.3 | ||
|
| ||||||||||||
| 2449 | 3.4±0.3 | 5.7±0.5 | 2.7±0.9 | 0.18±0.02 | 0.19±0.04 | 2.1±0.2 | 31±5 | 3.9±0.3 | 3.9±0.2 | 8.3±0.7 | ||
|
| ||||||||||||
| 24,490 | 3.7±0.2 | 5.7±0.4 | 4±1 | 0.22±0.04 | 0.18±0.03 | 2.1±0.4 | 29±3 | 4.2±0.4 | 4.1±0.2 | 8.7±0.4 | ||
|
|
||||||||||||
| MALE | 0 | 3.6±0.3 | 4.5±0.4 | 4.5±0.3 | 4.6±0.4 | 2.2±0.4 | 31±3 | 3.9±0.4 | 3.9±0.2 | 6.4±0.4 | ||
|
| ||||||||||||
| 245 | 3.4±0.2 | 4.9±0.1* | 4.5±0.4 | 4.5±0.4 | 2.0±0.2 | 30.7±0.4 | 3.9±0.3 | 3.8±0.2 | 6.9±0.6 | |||
|
| ||||||||||||
| 2449 | 3.5±0.4 | 4.8±0.4 | 4.8±0.4 | 4.7±0.4 | 2.0±0.2 | 33±5 | 3.9±0.4 | 3.8±0.3 | 6.5±0.4 | |||
|
| ||||||||||||
| 24,490 | 3.7±0.4 | 5.0±0.5 | 4.7±0.4 | 4.7±0.4 | 2.5±0.7 | 29±1 | 3.9±0.3 | 3.9±0.5 | 6.2±0.5 | |||
p < 0.05, two-tailed even distribution Student’s T-test as compared to 0 µg/kg in each test group
Pathology
There was no evidence of toxicity of single-dose ABY-029 or delivery vehicle, in any of the treatment groups for 24 h or 14 days. All of the recorded microscopic findings are considered to be incidental or spontaneous in nature when compared to normal rat histology and control groups. The complete pathologist assessment of each organ can be found in the ESM. It was noted upon necropsy that the 24,490 µg/kg ABY-029 dose group for both the 24 h and 14-day treatment groups had distinctively emerald green colored kidneys, but were determined to be pathologically normal.
Hematology
ABY-029 individual animal and dose group average data for hematology are summarized in the ESM. Eighteen blood samples out of the 96 were clotted and hematology only samples were performed again in 17 replacement rats in order to obtain complete data sets. One clotted sample was missed initially and was not repeated. The vast majority of values reported were in the normal range [31, 37–38], and statistically the same as the control groups. There were several exceptions where the values were significantly different than the control group, based on p < 0.05 two-tailed Student’s t-test, but still within the normal range. Several values were outside of the normal ranges provided, mostly included in the cell count and cell percentages; however, in vast majority of cases the control groups were also outside of the normal range or the values clinically similar to the normal range. There were seven instances where the group averages were significantly different than the control group and outside the normal range but four of these (platelets – 2,449 µg/kg 24-h female, 245 µg/kg 14-day male; percent monocytes – 2,449 µg/kg 24-h female; and monocytes – 2,449 µg/kg 14-day male) did not appear to have any trend; whereas all of the ABY-029 dose groups (245, 2,449, and 24,490 µg/kg) in the 14 day female eosinophils group were different than the control. In this instance, it appears that the 14 day female control group, although in the normal range, was elevated above all other control and ABY-029 dosed groups.
Clinical Chemistries
ABY-029 individual animal and dose group average data for clinical chemistries are summarized in the ESM with normal range value for each clinical value [31, 37–38]. All group average values were found to be in the normal range with the exception of albumin for all groups, creatine phosphokinase for the male 14-day control group, and lactate dehydrogenase for all female 24-h groups, male 24-h control group, and the male and female 14-day 0, 245, and 24,490 µg/kg groups. Looking at the individual data for creatine phosphokinase, the male 14-day control group average was skewed by a single animal. In the case of albumin, all averages and individual data (with the exception of one female 14-day 245 µg/kg animal) were below the normal range, indicating the normal range may not be a suitable representation for these animals. In addition, the majority of the lactate dehydrogenase animals were above the normal range. All male group averages were statistically the same as the control groups with the exception of creatinine in the 24-h 2,449 and 24,490 µg/kg ABY-029 dose groups, glucose in the 2,449 µg/kg group, chloride in the 14-day 24,490 µg/kg group and phosphorous in the 14-day 2,449 and 24,490 µg/kg groups. All female group averages were statistically the same as the control groups, with the exception of 24 h blood urea nitrogen (2,449 and 24,490 µg/kg), creatinine (245, 2,449, and 24,490 µg/kg), sodium (24,490 µg/kg), potassium (24,490 µg/kg), chloride (2,449 and 24,490 µg/kg), lactate dehydrogenase (245 µg/kg), and cholesterol (24,490 µg/kg), and the 14 day glucose (24,490 µg/kg), bicarbonate (2,449 µg/kg), and lactate dehydrogenase (2,449 µg/kg). Although these groups were statistically different than the controls, with the exception of one, they were within the normal range provided and no clinically significant dose-related differences were observed. The only value statistically different than the control group and outside of the normal range was the female lactate dehydrogenase 24-h 245 µg/kg group (p = 0.02).
Biodistribution
The biodistribution of ABY-029 (2,449 µg/kg) in both male and female rats is shown in Fig. 2. As anticipated the liver, kidneys and lungs had the highest fluorescence but these organs have high EGFR levels and/or are involved in clearance. The spleen, heart, muscle, duodenum, mesenteric lymph nodes, and sex organs (testes or ovaries) had similar levels of ABY-029, while the brain demonstrated very little ABY-029 fluorescence, which was expected, as ABY-029 should not cross the intact blood-brain-barrier. There were no statistically significant differences in the biodistribution of ABY-029 between male and female rats.
Figure 2.
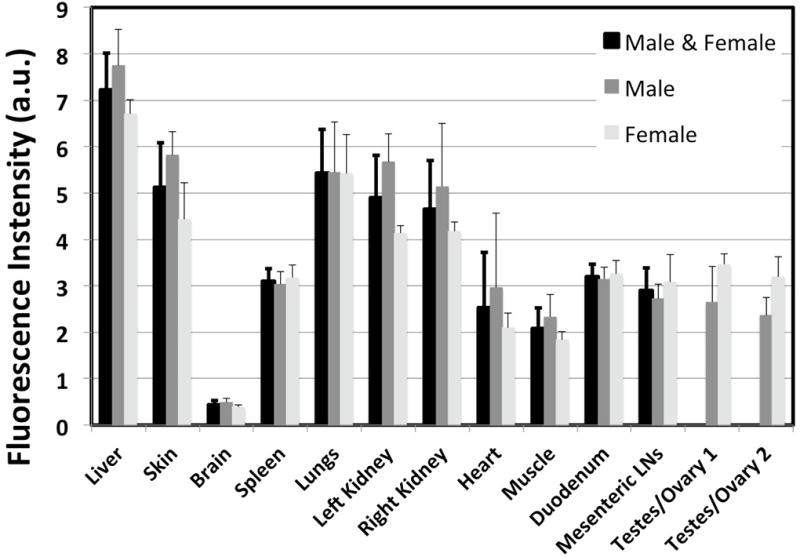
The biodistribution of ABY-029 (2,449 µg/kg) in key organs one hour after intravenous injection as measured in the Pearl Imaging System. The values for male and female are presented separately and averaged together for all organs with the exception of the sex organs.
Pharmacokinetics
The ABY-029 plasma bi-exponential decay function (Fig. 3) was determined as shown in Equation 1.
| (1) |
where A1 and A2 are the amplitudes of the first and second exponential (nM), t1 and t2 are the exponential decay constants (min−1) and y0 is the baseline offset (nM). The individual male and female standard plasma concentration curves and pharmacokinetic curves can be found in the ESM.
Figure 3.
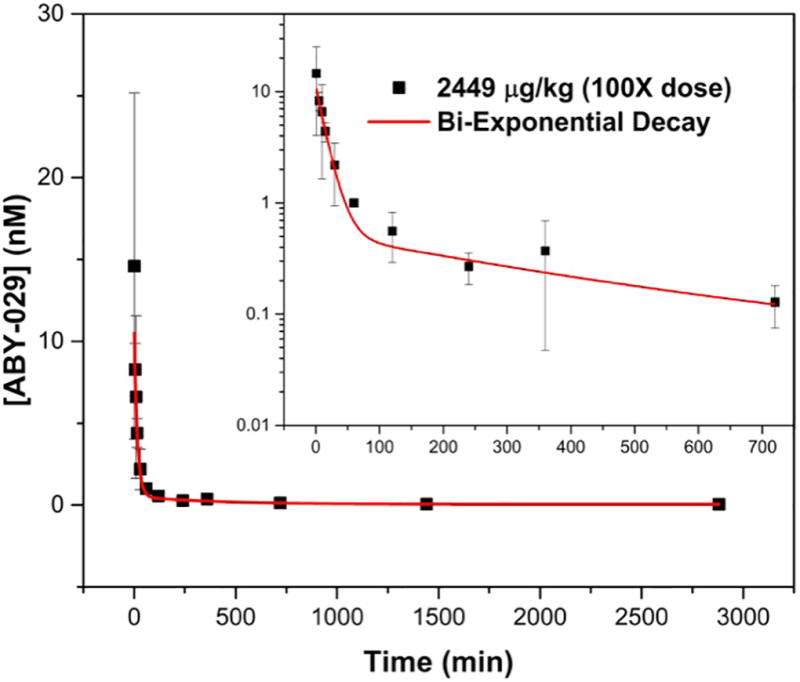
The pharmacokinetic clearance of 2449 µg/kg ABY-029 from the plasma of normal Sprague Dawley rats. The inset shows the log-log plot of the concentration of ABY-029 in blood for 0–720 minutes to visualize the short time periods more clearly.
Discussion
The goal of this work was to produce a fluorescently-labeled molecular targeted agent that had high probability to be used successfully in a clinical setting to aid surgeons in removal of tumor tissue. ABY-029 binding to rat EGFR proved that the rat is a relevant species for toxicity studies, since it allows for detecting both potential on- and off-target toxicity. The dissociation constants for both ABY-029 to human and rat EGFR were lower than those observed in surface plasmon resonance studies performed previously, where a library of anti-EGFR Affibody molecules were determined to have KD values in the 5–10 nM range [39]. However, flow cytometry KD determination of the commercially available ZEGFR:1907 bound to Alexa Fluor 488 in A431 cells was found to be 2.8 nM, which is quite similar to the human value determined here. It can be concluded that the covalent linkage of IRDye 800CW to the Z03115-Cys anti-EGFR Affibody molecule did not significantly change the binding characteristics, and indeed the binding is stronger than in previous versions of the peptide. In future, the Biacore binding affinities will be used to validate binding capabilities of subsequently produced GMP batches of ABY-029.
Administration of ABY-029 will occur within minutes to hours of the start of surgery and therefore, there is high potential for whole body phototoxicity if ABY-029 is photoreactive. Mitsunaga et al. reported phototoxicity of IRDye 700DX (a phthalocyanine derived fluorochrome), when conjugated to monoclonal antibodies (cetuximab or panitumumab) and bound to membrane based EGFR [40]. However, the unconjugated version of IRDye 700DX did not cause phototoxicity [40]. Here, we compared the phototoxicity of the ABY-029 (IRDye 800CW, a cyanine derived fluorochrome) to a well-known photosensitizing agent BPD (verteporfin, a porphyrin) that is clinically approved for use in photodynamic therapy of age-related macular degeneration in the lipid formulation, Visudyne® [41–43]. There was no evidence of phototoxicity in either the EGFR positive or negative cells when treated with ABY-029 but significant cellular death was observed, as expected, from treatment with the BPD photosensitizing agent. The increase in cell growth in the No Drug and ABY-029 groups compared to the 0 J/cm2 group in both F98 and F98-EGFR is caused by low-light stimulation phenomenon. Low-level light therapy occurs when red and near-infrared light is used alone at low power to induce cell growth, wound healing and reduce pain and inflammation [44]. Excitation of both fluorophores was performed at same irradiance and excitation wavelength, 690 nm, which is the therapeutic excitation light source for BPD when performing photodynamic therapy. At 690 nm, BPD was excited at ~50% of the Soret band maxima (420 nm) and IRDye 800CW was excited at 25–30% of the absorption maxima (776 nm as reported by LI-COR Biosciences, Inc). However, high concentrations of each fluorophore and high irradiance were used to overcome this limitation.
The safety and biodistribution properties of ABY-029 were studied here with the intention of progressing into first-in-human Phase 0 microdose studies for fluorescence-guided resection of EGFR positive gliomas. The microdose level is important to the study because it allowed an exploratory investigational new drug (eIND) to be filed with the FDA and to use a single mammalian species, here Sprague Dawley rats, for toxicity testing. The eIND defines a microdose for a protein products as ≤30 nanomoles which corresponds to a human ABY-029 dose of 237 µg and by dose conversion to a rat dose of 24.5 µg/kg [36]. The administered doses were selected up to 1000X the microdose to establish a large margin of safety.
There were no ABY-029 dose-related effects observed in any groups in the toxicity study including histopathological, clinical chemistry and hematology data. It was determined through histopathologic evaluation of rat tissues that no acute systemic or local toxicity was observed either 24 hours or 14 days post-injection of ABY-029 at doses up to 24,490 µg/kg, which is equivalent to 1000X the human microdose. The emerald green color in the kidneys arising from IRDye 800CW was not observable on pathology. No pathological toxicity or tissue response was associated with this finding, and it is well known that the kidneys are responsible for the rapid clearance of the Affibody molecules, in part lending to their optimal use as imaging agents. For clinical chemistry results, all control groups were found to have values outside of the normal range for both albumin and lactate dehydrogenase, indicating that the literature determined normal range is not suitable for reporting, and the control animals are the most reliable values to compare to. In the hematology results, several instances of blood counts in the control rats were observed outside of the normal range, indicating that the literature values were not valid for the rats tested here. Blood cell counts are highly dependent on dilution and can vary largely between days. However, it does not appear that any of these changes are related to ABY-029 dose.
ABY-029 was determined to have a fast plasma clearance with no detectable ABY-029 after 24 hours. The time decay constants (t1 and t2 were 0.065±0.009 and 0.0026±0.0006 min−1, respectively) match closely with the results we previously published on commercially purchased anti-EGFR Affibody molecule and conjugated to IRDye 800CW in our laboratory and injected intravenously in mice (t1 and t2 were 0.06 and 0.0015 min−1, respectively [35]). The biodistribution study demonstrated that the normal brain retains very little ABY-029 at 1-hour after administration, likely due to the blood-brain-barrier, although higher levels are observed in other organs. The fast plasma clearance, rapid tissue distribution phase and low uptake in the normal brain suggest that ABY-029 is a strong candidate for fluorescence-guided surgery for glioma resection. Indeed, these characteristics lend to high tumor to normal brain contrast levels at even short periods. It was recently demonstrated that rats bearing orthotopic xenograft U251 tumors displayed a tumor-to-normal brain contrast of ~8 at only 1-hour post ABY-029 administration and fluorescence was still observable at 48-hours post-administration with a contrast ratio of ~3 [34]. This contrast ratio value increased to ~16 when five-times the human equivalent microdose was administered. Additionally, the tumor-to-normal brain contrast ratio in the human equivalent microdose remained nearly constant over a 4-hour period suggesting that this contrast level could be maintained for the entire surgical procedure.
Conclusions
It was demonstrated here that ABY-029 has no measurable toxicity effects at any dose administered here, and therefore the no observed adverse effect level (NOAEL) was 24,490 µg/kg, which is equivalent to 1000X the FDA stated human microdose level of 30 nanomoles or 237 µg per human. Binding strength of ABY-029 to human and rat EGFR was maintained after covalently linking the anti-EGFR Affibody molecule and IRDye 800CW. Biodistribution studies indicate low uptake in normal brain and rapid plasma clearance make ABY-029 an ideal imaging agent for monitoring glioma to normal brain contrast during neurosurgical tumor resection. The production and testing of ABY-029 demonstrate the ability to bring a fluorescently-labeled synthetic peptide to clinical trial within the framework of a NIH funding grant and industry partnerships. The toxicology and safety study published here represents a pipeline for fast development of these fluorescently-labeled imaging agents to clinical settings.
Supplementary Material
Acknowledgments
This work has been funded from National Institutes of Health grant R01CA167413.
Footnotes
Conflict of Interest Statement
Authors K.S.S., J.R.G., K.M., S.M.H., K.L.M., T.V.S., D.R.D., P.J.H., D.W.R., K.D.P., and B.W.P. have no conflicts of interest to disclose.
Author J.F. is affiliated with Affibody AB and has an intentional conflict of interest for the development and commercialization of the anti-epidermal growth factor receptor Affibody molecule.
References
- 1.DSouza AV, Lin H, Elliott JT, et al. Review of fluorescence guidance systems: Identification of key performance capabilities beyond indocyanine green imaging. JBO. 2016;21:080901. doi: 10.1117/1.JBO.21.8.080901. [DOI] [PMC free article] [PubMed] [Google Scholar]
- 2.Vahrmeijer AL, Frangioni JV. Seeing the invisible during surgery. Br J Surg. 2011;98:749. doi: 10.1002/bjs.7538. [DOI] [PMC free article] [PubMed] [Google Scholar]
- 3.Stummer W, Stepp H, Möller G, Ehrhardt A, Leonhard M, Reulen H. Technical principles for protoporphyrin-IX-fluorescence guided microsurgical resection of malignant glioma tissue. Acta Neurochir. 1998;140:995–1000. doi: 10.1007/s007010050206. [DOI] [PubMed] [Google Scholar]
- 4.Stummer W, Tonn J-C, Goetz C, et al. 5-Aminolevulinic acid-derived tumor fluorescence: the diagnostic accuracy of visible fluorescence qualities as corroborated by spectrometry and histology and postoperative imaging. Neurosurgery. 2014;74:310–320. doi: 10.1227/NEU.0000000000000267. [DOI] [PMC free article] [PubMed] [Google Scholar]
- 5.Roberts DW, Valdés PA, Harris BT, et al. Coregistered fluorescence-enhanced tumor resection of malignant glioma: relationships between δ-aminolevulinic acid–induced protoporphyrin IX fluorescence, magnetic resonance imaging enhancement, and neuropathological parameters. J Neurosurg. 2011;114:595. doi: 10.3171/2010.2.JNS091322. [DOI] [PMC free article] [PubMed] [Google Scholar]
- 6.Roberts DW, Valdés PA, Harris BT, et al. Glioblastoma multiforme treatment with clinical trials for surgical resection (aminolevulinic acid) Neurosurg Clin N Am. 2012;23:371–377. doi: 10.1016/j.nec.2012.04.001. [DOI] [PMC free article] [PubMed] [Google Scholar]
- 7.Valdés PA, Kim A, Brantsch M, et al. δ-aminolevulinic acid–induced protoporphyrin IX concentration correlates with histopathologic markers of malignancy in human gliomas: the need for quantitative fluorescence-guided resection to identify regions of increasing malignancy. Neuro Oncol. 2011;13:846–856. doi: 10.1093/neuonc/nor086. [DOI] [PMC free article] [PubMed] [Google Scholar]
- 8.Stummer W, Pichlmeier U, Meinel T, et al. Fluorescence-guided surgery with 5-aminolevulinic acid for resection of malignant glioma: a randomised controlled multicentre phase III trial. Lancet Oncol. 2006;7:392–401. doi: 10.1016/S1470-2045(06)70665-9. [DOI] [PubMed] [Google Scholar]
- 9.Stummer W, Reulen H-J, Meinel T, et al. Extent of resection and survival in glioblastoma multiforme: identification of and adjustment for bias. Neurosurgery. 2008;62:564–576. doi: 10.1227/01.neu.0000317304.31579.17. [DOI] [PubMed] [Google Scholar]
- 10.Ekstrand AJ, James CD, Cavenee WK, Seliger B, Pettersson RF, Collins VP. Genes for Epidermal Growth Factor Receptor, Transforming Growth Factor α, and Epidermal Growth Factor and Their Expression in Human Gliomas in Vivo. Cancer Res. 1991;51:2164–2172. [PubMed] [Google Scholar]
- 11.Zimmermann M, Zouhair A, Azria D, Ozsahin M. The epidermal growth factor receptor (EGFR) in head and neck cancer: its role and treatment implications. Radiat Oncol J. 2006;1:11. doi: 10.1186/1748-717X-1-11. [DOI] [PMC free article] [PubMed] [Google Scholar]
- 12.Barrett T, Koyama Y, Hama Y, et al. In vivo diagnosis of epidermal growth factor receptor expression using molecular imaging with a cocktail of optically labeled monoclonal antibodies. Clin Cancer Res. 2007;13:6639–6648. doi: 10.1158/1078-0432.CCR-07-1119. [DOI] [PubMed] [Google Scholar]
- 13.Gleysteen JP, Newman JR, Chhieng D, Frost A, Zinn KR, Rosenthal EL. Fluorescent labeled anti-EGFR antibody for identification of regional and distant metastasis in a preclinical xenograft model. Head Neck. 2008;30:782–789. doi: 10.1002/hed.20782. [DOI] [PMC free article] [PubMed] [Google Scholar]
- 14.Helman EE, Newman JR, Dean NR, Zhang W, Zinn KR, Rosenthal EL. Optical imaging predicts tumor response to anti-EGFR therapy. Cancer Biol Ther. 2010;10:166–171. doi: 10.4161/cbt.10.2.12164. [DOI] [PMC free article] [PubMed] [Google Scholar]
- 15.Koyama Y, Barrett T, Hama Y, Ravizzini G, Choyke PL, Kobayashi H. In vivo molecular imaging to diagnose and subtype tumors through receptor-targeted optically labeled monoclonal antibodies. Neoplasia. 2007;9:1021–1029. doi: 10.1593/neo.07787. [DOI] [PMC free article] [PubMed] [Google Scholar]
- 16.Kulbersh BD, Duncan RD, Magnuson JS, Skipper JB, Zinn K, Rosenthal EL. Sensitivity and specificity of fluorescent immunoguided neoplasm detection in head and neck cancer xenografts. Arch Otolaryngol Head Neck Surg. 2007;133:511–515. doi: 10.1001/archotol.133.5.511. [DOI] [PubMed] [Google Scholar]
- 17.Rosenthal EL, Warram JM, de Boer E, et al. Safety and Tumor-specificity of Cetuximab-IRDye800 for Surgical Navigation in Head and Neck Cancer. Clin Cancer Res. 2015;21:3658–3666. doi: 10.1158/1078-0432.CCR-14-3284. [DOI] [PMC free article] [PubMed] [Google Scholar]
- 18.Verbeek FP, van der Vorst JR, Tummers QR, et al. Near-infrared fluorescence imaging of both colorectal cancer and ureters using a low-dose integrin targeted probe. Ann Surg Oncol. 2014;21:528–537. doi: 10.1245/s10434-014-3524-x. [DOI] [PMC free article] [PubMed] [Google Scholar]
- 19.Wang K, Wang K, Li W, et al. Characterizing breast cancer xenograft epidermal growth factor receptor expression by using near-infrared optical imaging. Acta Radiol. 2009;50:1095–1103. doi: 10.3109/02841850903008800. [DOI] [PMC free article] [PubMed] [Google Scholar]
- 20.Day K, Sweeny L, Kulbersh B, Zinn K, Rosenthal E. Preclinical Comparison of Near-Infrared-Labeled Cetuximab and Panitumumab for Optical Imaging of Head and Neck Squamous Cell Carcinoma. Mol Imaging Biol. 2013;15:722–729. doi: 10.1007/s11307-013-0652-9. [DOI] [PMC free article] [PubMed] [Google Scholar]
- 21.Heath CH, Deep N, Sweeny L, Zinn K, Rosenthal E. Use of Panitumumab-IRDye800 to Image Microscopic Head and Neck Cancer in an Orthotopic Surgical Model. Ann Surg Oncol. 2012;19:3879–3887. doi: 10.1245/s10434-012-2435-y. [DOI] [PMC free article] [PubMed] [Google Scholar]
- 22.Rosenthal EL, Kulbersh BD, Duncan RD, et al. In Vivo Detection of Head and Neck Cancer Orthotopic Xenografts by Immunofluorescence. Laryngoscope. 2006;116:1636–1641. doi: 10.1097/01.mlg.0000232513.19873.da. [DOI] [PubMed] [Google Scholar]
- 23.Rosenthal EL, Kulbersh BD, King T, Chaudhuri TR, Zinn KR. Use of fluorescent labeled anti–epidermal growth factor receptor antibody to image head and neck squamous cell carcinoma xenografts. Mol Cancer Res. 2007;6:1230–1238. doi: 10.1158/1535-7163.MCT-06-0741. [DOI] [PubMed] [Google Scholar]
- 24.Löfblom J, Feldwisch J, Tolmachev V, Carlsson J, Ståhl S, Frejd FY. Affibody molecules: engineered proteins for therapeutic, diagnostic and biotechnological applications. FEBS Lett. 2010;584:2670–2680. doi: 10.1016/j.febslet.2010.04.014. [DOI] [PubMed] [Google Scholar]
- 25.Feldwisch J, Tolmachev V. Engineering of affibody molecules for therapy and diagnostics. Therapeutic Proteins: Methods and Protocols. 2012:103–126. doi: 10.1007/978-1-61779-921-1_7. [DOI] [PubMed] [Google Scholar]
- 26.Tolmachev V, Orlova A, Nilsson FY, Feldwisch J, Wennborg A, Abrahmsén L. Affibody molecules: potential for in vivo imaging of molecular targets for cancer therapy. Expert Opin Biol Ther. 2007;7:555–568. doi: 10.1517/14712598.7.4.555. [DOI] [PubMed] [Google Scholar]
- 27.Sandström M, Lindskog K, Velikyan I, et al. Biodistribution and radiation dosimetry of the anti-HER2 Affibody molecule 68Ga-ABY-025 in breast cancer patients. J Nucl Med. 2016;57:867–871. doi: 10.2967/jnumed.115.169342. [DOI] [PubMed] [Google Scholar]
- 28.Sörensen J, Sandberg D, Sandström M, et al. First-in-human molecular imaging of HER2 expression in breast cancer metastases using the 111In-ABY-025 affibody molecule. J Nucl Med. 2014;55:730–735. doi: 10.2967/jnumed.113.131243. [DOI] [PubMed] [Google Scholar]
- 29.Sörensen J, Velikyan I, Sandberg D, et al. Measuring HER2-Receptor Expression In Metastatic Breast Cancer Using [68 Ga] ABY-025 Affibody PET/CT. Theranostics. 2015;6:262–271. doi: 10.7150/thno.13502. [DOI] [PMC free article] [PubMed] [Google Scholar]
- 30.Baum RP, Prasad V, Müller D, et al. Molecular imaging of HER2-expressing malignant tumors in breast cancer patients using synthetic 111In-or 68Ga-labeled affibody molecules. J Nucl Med. 2010;51:892–897. doi: 10.2967/jnumed.109.073239. [DOI] [PubMed] [Google Scholar]
- 31.Marshall MV, Draney D, Sevick-Muraca E, Olive DM. Single-Dose Intravenous Toxicity Study of IRDye 800CW in Sprague-Dawley Rats. Mol Imaging Biol. 2010;12:583–594. doi: 10.1007/s11307-010-0317-x. [DOI] [PMC free article] [PubMed] [Google Scholar]
- 32.van Scheltinga AGT, van Dam GM, Nagengast WB, et al. Intraoperative near-infrared fluorescence tumor imaging with vascular endothelial growth factor and human epidermal growth factor receptor 2 targeting antibodies. J Nucl Med. 2011;52:1778–1785. doi: 10.2967/jnumed.111.092833. [DOI] [PubMed] [Google Scholar]
- 33.Hekman M, Mulders P, de Weijert M, et al. Ex vivo perfusion of tumorous kidneys with a dual-modality imaging probe. J Nucl Med. 2015;56:1209. [Google Scholar]
- 34.Ribeiro de Souza AL, Marra K, Gunn J, et al. Fluorescent affibody molecule administered in vivo at a microdose level labels EGFR expressing glioma tumor regions. Mol Imaging Biol First Online. 2016 Jul 05;2016:1–8. doi: 10.1007/s11307-016-0980-7. [DOI] [PMC free article] [PubMed] [Google Scholar]
- 35.Sexton K, Tichauer K, Samkoe KS, Gunn J, Hoopes PJ, Pogue BW. Fluorescent Affibody Peptide Penetration in Glioma Margin Is Superior to Full Antibody. PLoS One. 2013;8:e60390. doi: 10.1371/journal.pone.0060390. [DOI] [PMC free article] [PubMed] [Google Scholar]
- 36.Reagan-Shaw S, Nihal M, Ahmad N. Dose translation from animal to human studies revisited. FASEB J. 2008;22:659–661. doi: 10.1096/fj.07-9574LSF. [DOI] [PubMed] [Google Scholar]
- 37.Giknis M, Clifford C. Clinical laboratory parametes for Crl:CD(SD) rats. Charles River Laboratories. 2006:1–14. [Google Scholar]
- 38.Lillie LE, Temple NJ, Florence LZ. Reference values for young normal Sprague-Dawley rats: weight gain, hematology and clinical chemistry. Hum Exp Toxicol. 1996;15:612–616. doi: 10.1177/096032719601500802. [DOI] [PubMed] [Google Scholar]
- 39.Friedman M, Orlova A, Johansson E, et al. Directed evolution to low nanomolar affinity of a tumor-targeting epidermal growth factor receptor-binding affibody molecule. J Mol Biol. 2008;376:1388–1402. doi: 10.1016/j.jmb.2007.12.060. [DOI] [PubMed] [Google Scholar]
- 40.Mitsunaga M, Ogawa M, Kosaka N, Rosenblum LT, Choyke PL, Kobayashi H. Cancer cell-selective in vivo near infrared photoimmunotherapy targeting specific membrane molecules. Nat Med. 2011;17:1685–1691. doi: 10.1038/nm.2554. [DOI] [PMC free article] [PubMed] [Google Scholar]
- 41.Group ToA-rMDWPTS. Photodynamic therapy of subfoveal choroidal neovascularization in age-related macular degeneration with verteporfin: one-year results of 2 randomized clinical trials--TAP report 1. Arch Ophthalmol. 1999;117:1329. [PubMed] [Google Scholar]
- 42.Miller JW, Schmidt-Erfurth U, Sickenberg M, et al. Photodynamic therapy with verteporfin for choroidal neovascularization caused by age-related macular degeneration: results of a single treatment in a phase 1 and 2 study. Arch Ophthalmol. 1999;117:1161–1173. doi: 10.1001/archopht.117.9.1161. [DOI] [PubMed] [Google Scholar]
- 43.Schmidt-Erfurth U, Miller JW, Sickenberg M, et al. Photodynamic therapy with verteporfin for choroidal neovascularization caused by age-related macular degeneration: results of retreatments in a phase 1 and 2 study. Arch Ophthalmol. 1999;117:1177–1187. doi: 10.1001/archopht.117.9.1177. [DOI] [PubMed] [Google Scholar]
- 44.Chung H, Dai T, Sharma SK, Huang Y-Y, Carroll JD, Hamblin MR. The nuts and bolts of low-level laser (light) therapy. Ann Biomed Eng. 2012;40:516–533. doi: 10.1007/s10439-011-0454-7. [DOI] [PMC free article] [PubMed] [Google Scholar]
Associated Data
This section collects any data citations, data availability statements, or supplementary materials included in this article.