Abstract
Enzymatic reactions usually occur in several steps: A step of substrate binding to the surface of the protein, a step of protein re-organization around the substrate and conduction of a chemical reaction, and a step of product release. The release of inorganic phosphate - PPi - from the matrix of the protein HIV reverse transcriptase is investigated computationally. Atomically detailed simulations with explicit solvent are analyzed to obtain the free energy profile, mean first passage time, and detailed molecular mechanisms of PPi escape. A challenge for the computations is of time scales. The experimental time scale of the process of interest is in milliseconds and straightforward Molecular Dynamics simulations are in sub-microseconds. To overcome the time scale gap we use the algorithm of Milestoning along a reaction coordinate to compute the overall free energy profile and rate. The methods of Locally Enhanced Sampling and Steered Molecular Dynamics determine plausible reaction coordinates. The observed molecular mechanism couples the transfer of the PPi to positively charged lysine side chains that are found on the exit pathway and to an exiting magnesium ion. In accord with experimental finding the release rate is comparable to the chemical step, allowing for variations in substrate (DNA or RNA template) in which the release becomes rate determining.
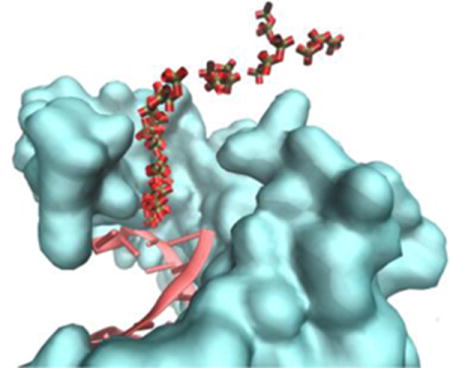
TOC image
I. Introduction
HIV reverse transcriptase (HIV-RT) is a remarkable molecular machine that copies genetic code from one polynucleotide strand to another at moderately high efficiency and precision. It belongs to the A family of DNA polymerases and its function is presented by a sequence of reactions:
| (1) |
We use the following notations: EDn is the complex of the enzyme HIV-RT with a DNA of n nucleotides and N is a nucleotide we wish to add. FDnN is the protein bound to the DNA and to the nucleotide substrate after a conformational transition. PPi is the byproduct, an inorganic pyrophosphate. In the past, we1,2 and Radhakrishnan and Schlick3 have studied the conformational transition (step 2) and provided a rationale to explain how it makes a dominant contribution to the specificity of the enzyme.4 The chemical reaction (step 3) is slower and rate-determining for processive synthesis, but specificity is determined by the first two steps involving weak nucleotide binding (step 1) and a fast conformational change (step 2). In the present manuscript we focus on the last step of PPi release (step 4). Experimentally the last step was shown to be faster but nevertheless comparable (a factor of ~10) to the overall rate4 for polymerization with a DNA template. Moreover, if RNA template (instead of DNA) is considered, step (4) was shown experimentally to be slower than step (3).6 The time scales of the chemical and the escape steps are therefore not very different and changes in templates (for example) can modify the rate-determining event.
Others have studied this step computationally.7–9 However, previous investigations focused on mechanisms and structural features of the transition and did not estimate parameters of kinetics and thermodynamics. In particular, experiments interpreted in terms of Eq. (1) in6 allow for extraction of time scales for PPi escape, compare it to other steps in the reactions in terms of contribution to rate and specificity, and suggest a useful independent comparison between experiments and simulations.
There are several processes that are included in step (4) that complete the operation cycle of the enzyme: (i) PPi escape, (ii) the conformational transition of the protein to the open state and (iii) DNA sliding to free space for a new substrate. The relative ordering of the different steps is not clear, but some considerations are given below. The DNA cannot slide before the PPi moves away from its original position (even though simultaneous and coupled motions are possible). Moreover, the degree in which the protein needs to open up to free a pathway for the PPi escape is not obvious either. Experimental measurement shows that enzyme opening and PPi release are coincident, so the order of events cannot be determined (reference 6). In the present investigation we consider a simple reaction coordinates that focus on the PPi degrees of freedom and not on the DNA or overall protein relaxation (see Methods). The computed reaction coordinate is then used in a Milestoning calculation10 that provides an ensemble of transitional trajectories. The trajectories enable the computations of the kinetic and thermodynamic characteristics of the process. They also make it possible to examine the coupling of PPi escape to protein motions and to DNA sliding, providing a new perspective on the dynamics of the transition and its verification by kinetics data.
II. Methods
Structural models
A model of the closed form of enzyme was constructed based on the entry 1RTD11 of the Protein Data Bank12 and a model of an incoming nucleotide (TTP), which was built and discussed in in our previous paper.1 We model the PPi according to the earlier coordinates of the TTP. We did not use the open state as a model. Instead we “drove” the trapped PPi to the solvent and examine the pathway for changes to the protein and DNA structures.
LES Calculations
Our first tool of path exploration was the use of the Locally Enhanced Sampling (LES).13 In the LES methodology, multiple copies of a small part of the system, of particular interest, are used to enhance the sampling. The multiple copies do not see each other and the rest of the system “sees” an average force rising from all the multiple copies. The trajectories provide a statistically enhanced view of alternative escape pathways of the ligand at significantly reduced cost. Let L denotes the LES Part and R the rest of the system, the usual equations of motion are modified in LES to:
| (2) |
where X is a Cartesian coordinate vector, is the acceleration vector, and M a mass matrix. The number of copies is l.
The LES methodology was introduced to explore diffusion pathways of carbon monoxide in myoglobin,13 and was used later in other systems.14–16 It is particularly useful to examine path multiplicity and degeneracy, which play an important role in the diffusion of small molecules like CO.13,17 However, as we illustrate in Results for PPi release, in the present study we detect only one dominant path.
Simulation Protocol for LES simulations in MOIL
The LES calculations were performed with the MOIL suit of programs.18 The OPLS all-atom force-field19 was used with real space cutoff for electrostatics interactions of 10 Å and van der Waals cutoff of 9 Å. The entire complex is embedded in a periodic box of 130 × 130 × 130 Å3 and 64,039 TIP3 water molecules. Sodium ions were added to ensure system neutrality. The geometry of individual water molecules was fixed with matrix SHAKE algorithm.20 Particle mesh Ewald summation21 was used to compute electrostatic interactions with a grid size of 128 Å in each direction. The system was prepared and equilibrated using the following protocol: (i) the water molecules and sodium ions were relaxed and heated up from 3 K to 300 K in 80 ps linear-heating run while fixing the protein, nucleic acids and the PPi. (ii) The system was heated from 3 to 300 K in another 80 ps run with all the atoms free to move. (iii) Equilibration (using velocity scaling) of the entire system at 300 K for another 80 ps. After system preparation and relaxation, 50 copies of the pyrophosphate group were created at the same spatial coordinates but different velocities for LES simulations. Three simulations (different by their initial velocities) were conducted for 450 ps and structures were saved every 0.5 ps.
We analyze the results by counting the average number of collisions of PPi copies with protein residues as a function of time. A collision is defined between two groups if heavy atoms, one in each group, have a distance smaller or equal to 3Å. The atomic collisions are summed up to provide the collision numbers between residues and are normalized by the number of structures sampled.
LES is a mean field approximation. As was discussed in the past22,23 one consequence is that in equilibrium the LES part (here the PPi molecule) has a higher temperature than the rest of the system. Such local “heating” can be useful to explore maximal number of alternative pathways. However, the “energetic” PPi may hit and distort portions of the protein structure and accelerate the escape. LES, in its present form, cannot be used for quantitative estimates of kinetics and thermodynamics. Once a sample of suggestive paths was obtained we continue to compute reaction coordinates with a gentler approach.
Steered Molecular Dynamics
We conducted Steered Molecular Dynamics (SMD) simulations along the general direction of the LES pathway to pull the PPi group from the active site to the aqueous solution. The simulations were conducted with NAMD 2.10 package24 with a force constant of 10 kcal/mol Å2. The initial structure was prepared with VMD25 building on the relaxed structure obtained from simulations with the MOIL program. The system was solvated in a periodic box of 128 × 128 × 128 Å3 of TIP3 molecules. Na+ and Cl- ions were added to obtain salt concentration of 0.15 mol/L. The CHARMM36 force field was used for the DNA and the protein.26,27 TIP3P parameters for water molecules and adjusted ion parameters were taken from Jorgensen et al.28 and Beglov et al.29 respectively.
Langevin dynamics with 1 fs integration step, damping parameter of 5 ps−1 and T=300 K provided constant temperature simulations. Pressure was set to 1 atm. The covalent bonds were fixed. Van der Waals interactions were gradually switched off between 10 and 12 Å. Long-range electrostatic forces were computed with the PME method with grid spacing of 1 Å, cubic spline interpolation, 12 Å real space cutoff distance, and direct space tolerance of 10−6. The preparation phase include: (i) 5000 steps of energy minimization and 10 ns relaxation with protein, pyrophosphate, magnesium ions and DNA fixed, (ii) 100,000 relaxation steps with all the atoms allowed to move. Production simulations (SMD) were of 10 ns. Trajectory frames were saved every 1 ps.
Milestoning
The Milestoning theory and algorithm10 are used to obtain free energy profile and releasing time of PPi along a reaction coordinate. Milestoning requires the partition of coarse space into cells, where the milestones are the dividers between cells (Fig. 1).
Fig. 1.
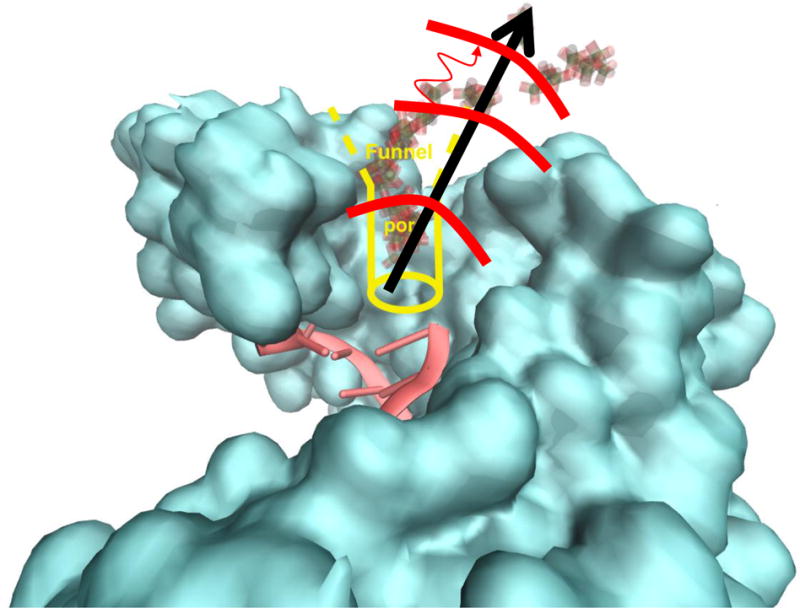
A schematic representation of PPi escape pathway. The blue surface includes the open protein and DNA molecules. In yellow we sketch the “funnel” that guides the escape of the inorganic phosphate. The sequence of molecules shaded gray and pink are PPi configurations from the SMD simulations. The black arrow denotes the simplified reaction coordinate and the thick red lines the milestones. The milestones are spheres with a constant distance from the initial position of the PPi. The thin curved red line is a sketch of a trajectory between milestones. It is initiated in the middle milestone and terminates at the milestone on top.
A simple reaction coordinate is used, which is the distance from the original position of the PPi (black arrow in Fig. 1). We created 72 milestones, dividing the PPi path into segments of about 0.5 Å each. The milestones span a range of 1.5 to 35 Å distances from the initial coordinates. Every milestone is a sphere with a center at the origin of the PPi molecule. However, due to protein confinement, the initial sampling of the PPi inside the protein matrix is highly restricted and obviously does not span the whole surface of the sphere.
Once a reaction coordinate is determined the Milestoning calculation is conducted in two steps10,30: (i) sampling initial coordinates at the milestone to start short trajectories between milestones and (ii) run trajectories between the milestones. In (i) the structures that were saved every 10ps of 5ns SMD runs provided initial configurations in the milestones’ spheres. Sampling trajectories are then computed in the canonical ensemble and are restrained to the milestone by a harmonic potential with a force constant of 10 kcal/molÅ-2. These simulations generate 500 initial coordinates for trajectories between the milestones. At the end of the pathway, (Milestones 63 to 72), only 100 trajectories per milestone were sufficient. In (ii) trajectories are conducted from the points sampled at the milestone in (i) until they hit for the first time another milestone and terminate. A cartoon example of a trajectory is a thin red curved arrow in Fig. 1. The length of individual trajectories was the longest in the first milestone (<71ps) and in the rest of the milestones was shorter than 57ps. This is a clear illustration of the efficiency of the Milestoning calculations, even with 70 milestones and 500 trajectories for each milestone the accumulated simulation time is about 60×70×500=2,100,000 ps = 2.1μs for simulation of processes at tens of milliseconds.
The short trajectories between the milestones provide the data we need to compute the thermodynamics and kinetics along the reaction coordinate.10 The two functions we focus on are the transition probability matrix (also called the kernel), Kij, and the lifetime of a milestone, ti. The kernel is the probability that a trajectory initiated at milestone i will hit milestone j before crossing any other milestone different from i. Let ni be the number of trajectories initiated at milestone i, let nij be the number of trajectories initiated at milestone i that hit milestone j before any other milestone. The kernel is estimated numerically from the trajectories as . The lifetime of milestone i is the average time of a trajectory initiated at the milestone and hitting any other milestone, where til is the termination time of trajectory l initiated at milestone i. With the kernel at hand we can compute the stationary flux q as the eigenvector of the kernel with eigenvalue one: qt = qtK where Kij ≡ (K)ij. The stationary flux and the lifetime are used to compute the free energy: Fi = −kBT log(qiti). The overall mean first passage time (MFPT) is the average time that it takes the system to reach the milestone at the boundary of the product state given an initial milestone. Here the MFPT is the average escape time and it is given by where qf is the flux at the final milestone (product state). In the calculations of the free energy the final milestone is set to be reflecting (hence the net flux is zero), while in the calculation of the MFPT the flux is periodic. The amount lost in the product state is returned through the reactant to ensure stationary flux. More detailed description of Milestoning calculations can be found in the literature.10,30,31
To suggest an experimental test of the calculations, we also considered a mutation. As is discussed in Results, the interactions of PPi with lysine residues play a significant role in the computed escape pathway. We consider a gentle mutation of Lysine to Arginine to explore subtle kinetics effect. We modeled arginine residues to three lysine positions and repeated the calculations. For arginine, we used a smaller sample of trajectories for a milestone (100 trajectories). Estimates of error bars (see end of Results and Discussions) suggest that this number is adequate for the task at hand.
III. Results and Discussions
Our calculations are divided into three phases: (a) LES simulations, (b) Steered Molecular Dynamics, and (c) Milestoning. In phase (a) we explore plausible pathways by using an approximate enhanced sampling technique. In phase (b) we use a general direction obtained from (a) to generate more detailed and focused paths. It is of interest to examine if the path generated in the LES simulations is indeed similar to the more refined path of the SMD study (Fig. 2).
Fig. 2.
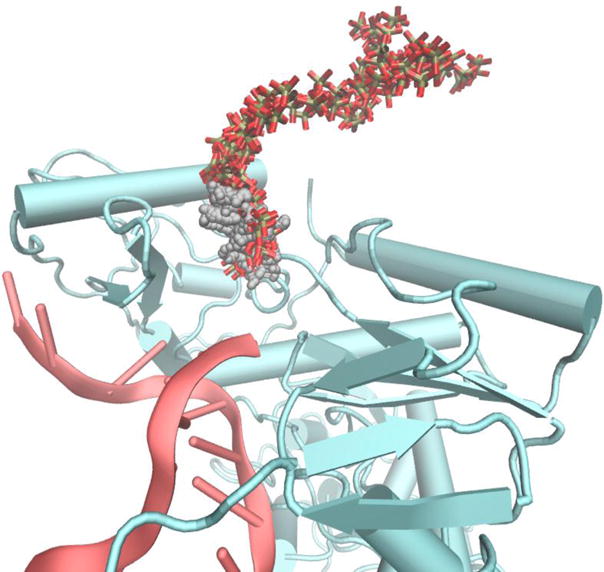
Comparison of LES and SMD trajectories of PPi escape from the protein matrix. The gray small spheres are PPi sampled in a LES trajectory. The red-gray stick models follow the SMD trajectory. Note that the PPi in the LES simulation did not leave the protein to the same extent shown in the SMD trajectory. However, The SMD trajectory overlaps with the LES trajectory until it exits from contact with the protein matrix.
In contrast to LES simulations of other ligands and other proteins,13,32 only a single dominant pathway was detected. This is likely to be a result of the size of the escaping molecule (PPi is larger than carbon monoxide) that requires larger free space to pass through and limits the directions it could go. The SMD was set in a direction that roughly follow the LES trajectories (Fig. 1).
The LES trajectories were examined to determine important residues along the escape pathway. We define a collision between two residues if the distance between any pair of atoms, each in a different residue, is less than 3 Å. Residue-residue collision number is a sum over all the atomic collisions and averaged over time. The residues with maximum number of collisions are listed in Table 1.
Table 1.
Collision numbers during a LES trajectory of protein residues with PPi
| Residue type | Residue index | Collision No. after 40ps | Collisions No. after 450ps |
|---|---|---|---|
| Lysine | 220 | 85 | 297 |
| Lysine | 71 | 242 | 189 |
| Lysine | 66 | 354 | 186 |
| Magnesium | 1033 | 112 | 10 |
In Table 1 we report the time averaged collision number of different residues with PPi. We report the collision numbers after 40 ps and after 450 ps to appreciate the shift in location of the byproduct as time progresses. Of the two magnesium ions found in the active site one remains in the active site at all times and the second (Mg2) is attached to the PPi during the escape process. PPi returns back to the binding site if Mg2 is not displaced with it. These observables are consistent with other investigations reported in the literature.8
A few structural observations from the LES trajectories: Mg2 is leaving the protein matrix before PPi after about 30 ps. Lysine 66 is close to the binding site and shows a large number of collisions early. In contrast, Lysine 220 is an important supporting player for the escape of the PPi but it is engaged only at later times. Lysine interactions with the PPi play an important role in the escape from the protein matrix, in addition to prior suggestions that they are important as proton donors for the chemical step.33
The LES configurations with multiple copies of the ligand can lead to distorted and high energy structures as the ligand pushed on the protein matrix that encloses it. It was shown22,23 that the equilibrium temperature of the LES copies when the protein is maintained at temperature T is L·T where L is the number of copies. One expectation is that the LES simulations with excess energy will exaggerate the number of accessible pathways. It is likely that LES will sample pathways with significant barriers that are not accessible at room temperature to the single copy system. The observation that the LES copies follow a single path is therefore a strong argument in favor of the path uniqueness.
The LES calculations are fast and cheap but the approximate nature of the calculations may make them uncertain. It is worth using an alternative approach to path calculation that builds on and verifies what we learned from the LES simulations. We therefore conducted Steered Molecular Dynamics (SMD) trajectories to re-investigate the escape pathways of PPi.
The SMD calculations in NAMD24 require as input the direction of the applied steering force. We set this direction to be along the vector connecting the initial configuration of the PPi and the center of the LES copy cloud at the end of the simulation. The use of input from LES makes it, perhaps, not surprising that the LES and SMD pathways share a number of features. For example the same critical lysine residues are observed in the SMD and LES runs (Fig. 3). Note that only the coordinates of the PPi are biased and hence the lysine coupling to the PPi pathways was not built to the assumed reaction coordinate. It is therefore a result of the simulations and not an input. In Fig. 3 we followed the important lysine residues and the PPi as a function of time of the SMD trajectory.
Figure 3.
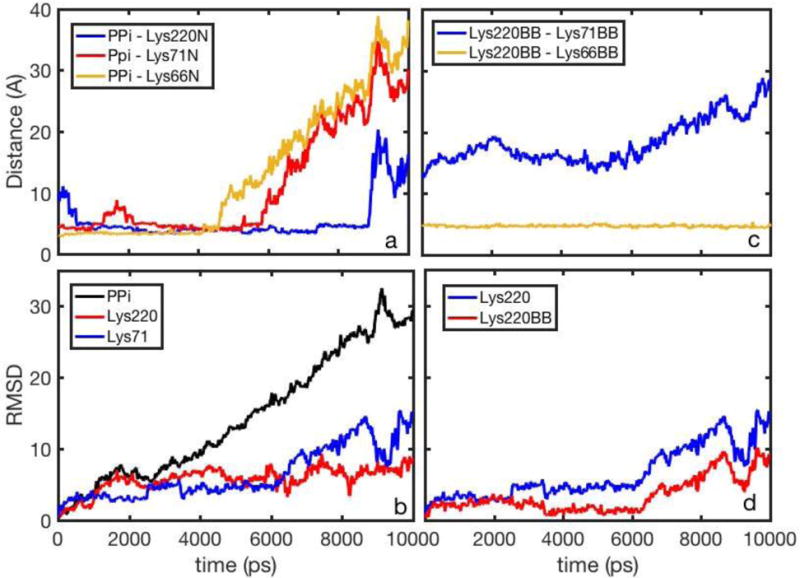
The inorganic phosphate PPi and lysine side chains as a function of time in an SMD trajectory: a) Distances between the PPi center of mass and the nitrogen atoms of the lysine side chains b) The Root Mean Square Distances (RMSD) as a function of time with respect to the initial structures of PPi, Lys220 and Lys71, c) distances between Lys220 and Lys71/Lys66 backbones, d) RMSD for Lys220 and Lys220 backbone.
The RMSD with respect to the original structure are plotted in panel 3.b. PPi is increasing its distance from the origin, on the average, as expected from the restraint we enforce during the SMD simulation. Lysine 220 has a similar RMSD curve to PPi at early times while lysine 71 changes more slowly at the beginning and more rapidly towards the end of the simulation. Panel 3.a is, perhaps, the most striking. After an initial relaxation, the distance between PPi and Lysine 220 remains about 5 Å throughout the simulations, indicating a persisting contact pair. Pairing with lysine residues reduces the effective charge of the two groups and makes it easier for the PPi to leave the protein matrix and escape to the aqueous solution. Similar pairing with PPi is observed for lysine 71 and 66, however, the last PPi-lysine pairs dissociate at about half of the SMD trajectory while the pair with lysine 220 persists closer to the escape event. Panel 3.c illustrate a significant difference between lysine 71 and 66 backbones. Lysine 66 remains near Lysine 220 at all times while lysine 71 is drifting away. Finally panel 3.d illustrates the significant contribution of the backbone motions of Lysine 220 in determining more than half of the motions along the pathway as determined by the RMSD to the origin.
The escape pathway of PPi is illustrated by a sequence of structural snapshots from the SMD trajectory in Fig. 4.
Figure 4.
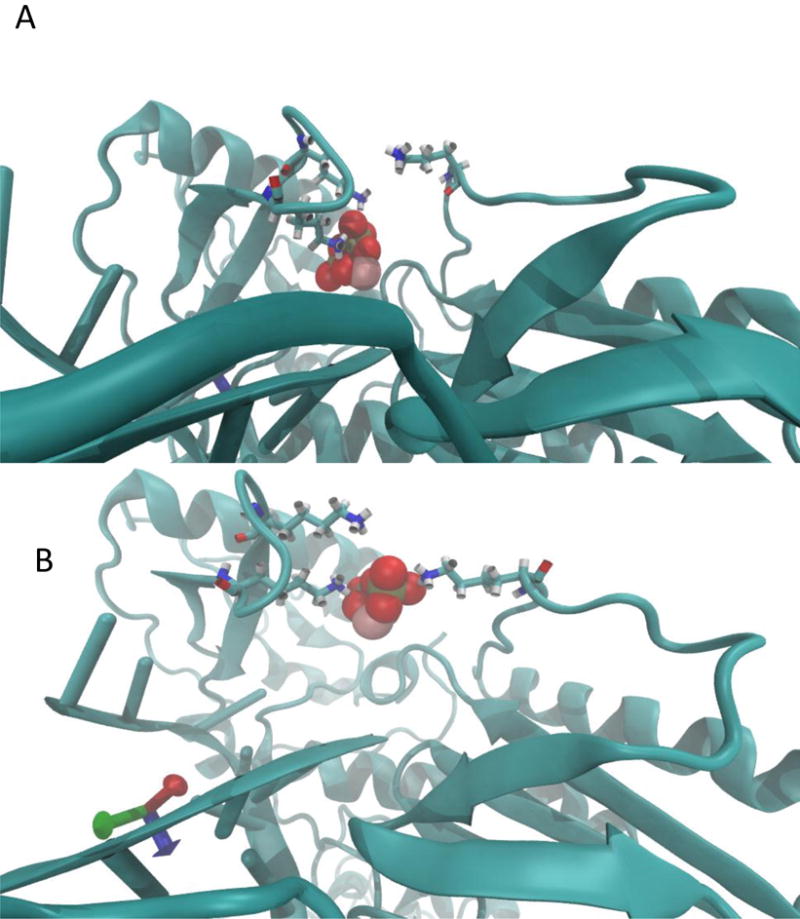
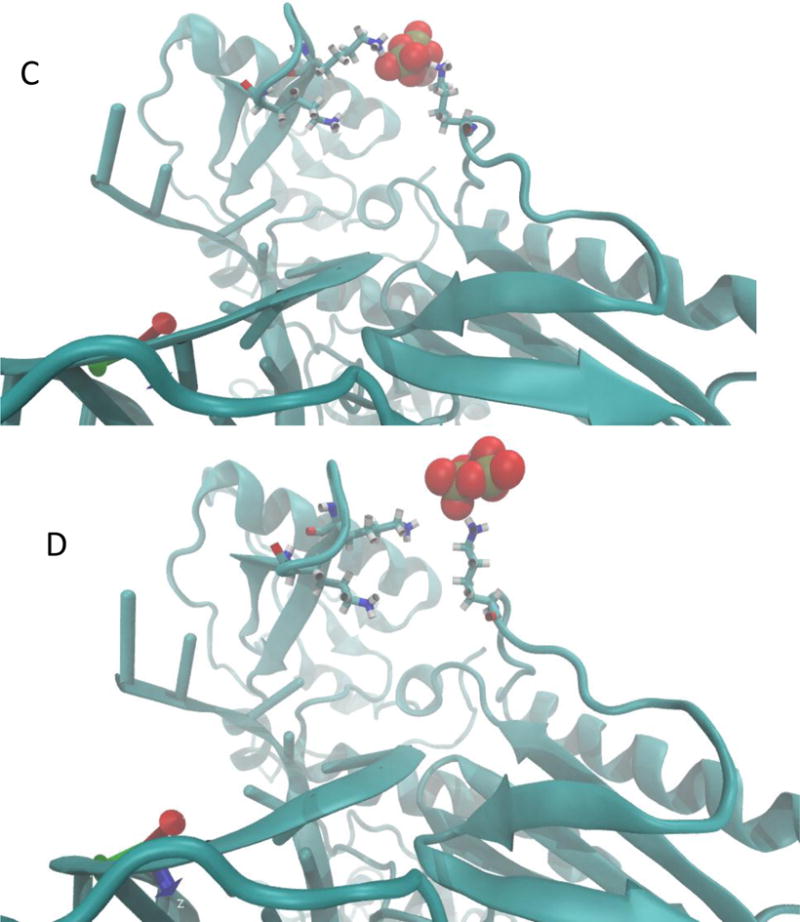
Structural snapshots along the escape pathway of PPi as a function of the milestone number. The cartoon models the backbone of the protein and DNA. The red and gray space-filling model is the PPi. The stick models are the three lysine side-chains (66, 71, and 220). (A) the initial structure, (B) milestone 10, (C) milestone 27, (D) milestone 32.
In figure 5 we compare lysine distances to those found in X-ray structures of the open and closed forms (lysine 220 to 66 and to 71). The progression of these distances illustrates the transitions of the two states of the protein, though protein coordinates are not part of the reaction coordinate. The protein responds to the enforced PPi displacement. The initiation of the open state (we used PDB id IJ50 as a model of the open structure34) can be probed by following a few lysine distances in Fig. 5.
Figure 5.
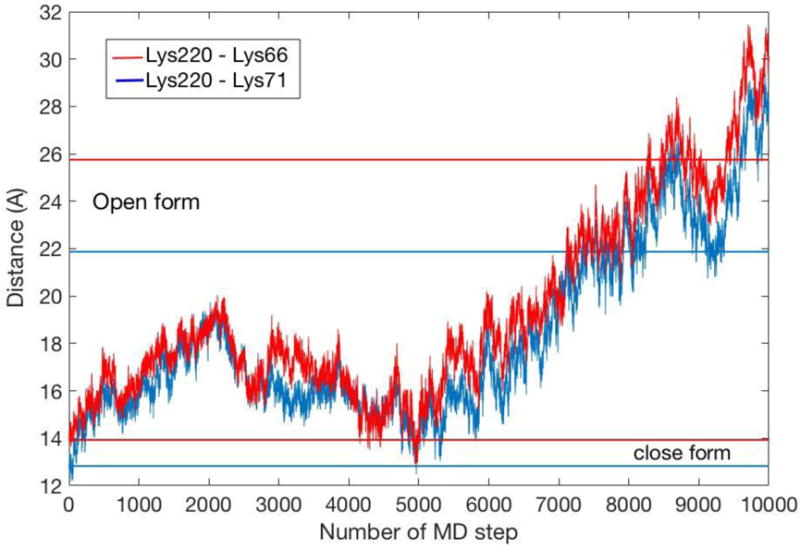
The distances between critical lysine residues (66, 71 and 220) are shown as a function of the SMD trajectory. The starting position is the closed form.
Another structural feature of the escape mechanism is revealed when we examine the behavior of magnesium binding to PPi during the escape event. In Fig. 6 we show that only one of the magnesium ions is attached to the PPi when the inorganic pyrophosphate exits the protein. One magnesium remains in the active site.
Figure 6.
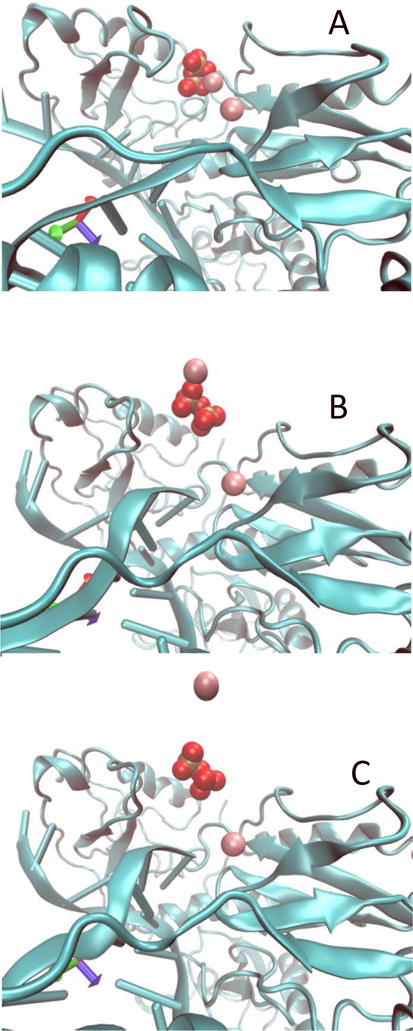
The coupled motions of PPi and a magnesium ion during the escape process from the protein matrix. The purple spheres are the magnesium ions and the red space-filling model is the PPi. Only one magnesium ion is leaving with the PPi. The second magnesium ion retains its position. (A) Initial coordinates, (B) Coordinated motion of PPi and magnesium, (C) Magnesium ion is released before the PPi.
Another mechanistic question we examine is the displacement of the DNA with respect to the active site. As we illustrate in Fig. 7 the upper part of the DNA is recoiling backward at the end of the reaction pathway, suggesting that “pushing” PPi outside is coupled to DNA displacement in the opposite direction. While the process of DNA translocation is not complete after the PPi exit in our trajectories, it suggests an initial event and a drive. For example, it is not necessary for the DNA translocation to be complete before the exit of the PPi, or it is not necessary for the protein to be fully open when the DNA starts to move to free space.
Figure 7.
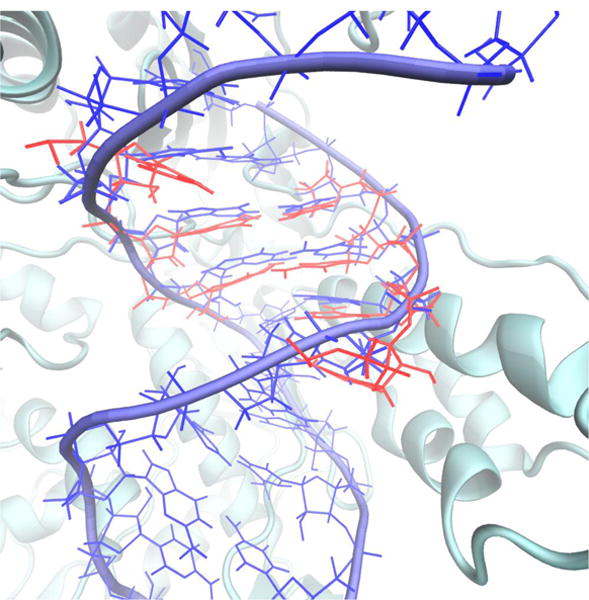
The DNA shift from the active site as PPi leaves the protein. The initial and final structures of the SMD trajectory are overlapped. Only the initial protein structure is shown and the beginning and final position of the DNA. The base pairs near the active site are compressed downward in the final structure (red) compared to the initial structure (blue). The structural displacement suggests the onset of the DNA translocation and freeing space for the next nucleotide.
To summarize, the following mechanism emerges from these plots. To begin with, and after a short relaxation of lysine 220, the PPi interacts strongly with all three lysine residues and one of the magnesium ions. The positively charged residues with their overall side chain flexibility and the doubly charged magnesium ion support the migration of the negatively charged group from the binding site. Roughly half the way out from the protein matrix Lysine 66 and 71 break their contact with the PPi. The magnesium ion and lysine 220 retain their close interactions. Then the magnesium leaves to the aqueous solution and the PPi breaks its contact with lysine 220 to finally escape into the solvent. At the same time the DNA “recoils” to free space for the next nucleotide to enter the active site.
As discussed in the Methods section we use the distance of the PPi from its original binding site as a coarse variable and initiate sampling in the milestones with structures sampled from the SMD trajectory. The trajectory information was processed according to the Milestoning theory and the results are summarized in Fig. 8 and Fig. 9.
Figure 8.
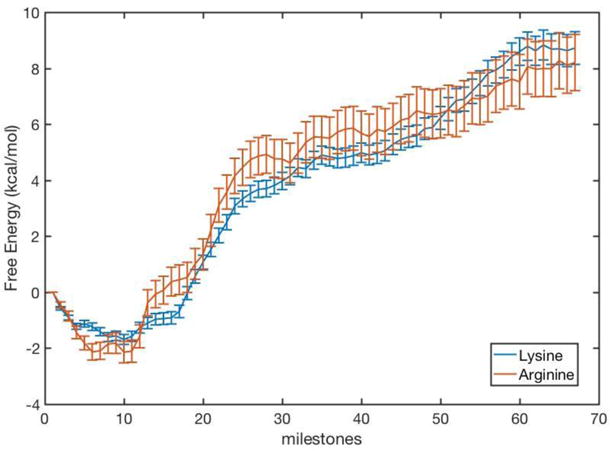
The free energy profile for the escape of PPi from HIV-RT binding site as computed with Milestoning. The curves of the native protein (lysine) and the mutant (arginine) are similar and suggest comparable kinetic behaviors (see also MFPT results in Fig. 9).
Figure 9.
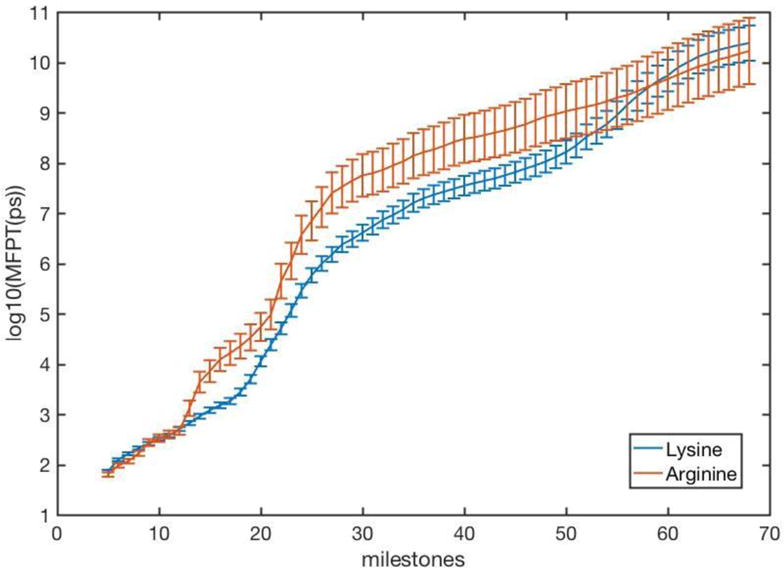
The Mean First Passage Time (MFPT) in a logarithmic scale, as a function of the milestone number. The blue line shows the MFPT of the native protein. The red line is for a mutant protein in which lysine residues 66, 71, and 220 are mutated to arginine residues. The overall mean first passage for the native protein was 33.5ms and 56ms for the arginine mutant, which corresponds closely to the measured PPi release rate of 27 s-1 with an RNA template.6
In Fig. 8 we show the free energy profiles for the escape of byproduct for the native protein, and for the case in which the critical lysine residues (66, 71 and 220) are replaced by arginine.
The free energy profile of Fig. 8 was computed with reflecting boundary conditions at milestones 1 and 68. These boundary conditions ensure that there is no net flux within the system and an equilibrium state with zero net flux can be reached, and meaningful free energy can be computed. The free energy profile in Fig. 8 shows two domains: (i) A well with a rather steep slope to climb out in the range from milestone 1 to ~25. (ii) A milder slope of free energy from milestone 26 to 68 leads to the exit from the protein matrix. These two phases correlate with the behavior of the lysine contacts. The exit from the deep well coincides with breaking the electrostatic bond with lysine 66 and 71. The final shallower slope is associated with the interactions only with lysine 220.
In Fig. 9 we show the Mean First Passage Time for trajectories initiated at the binding site and continuing up to a particular milestone. As in Fig. 8 the native protein and the arginine mutant re considered.
Similarly to the free energy plot the MFPT also shows two phases. The first phase ends when the electrostatic attraction between the PPi and lysine residues 66 and 71 (or arginine residues) is broken. The second phase continues until the electrostatic interaction between lysine or arginine 220 and the PPi is no longer effective. The difference in the escape kinetics for the lysine and arginine variants is probably too small to be predicted meaningfully by computations and detected by experiment.
The error bars are computed by sampling transition matrix elements, Kij, from the beta distribution35,36 and local mean first passage times, ti from the normal distribution. The parameters of the beta distribution are estimated from moments computed with Milestoning trajectories. One thousand random matrices and local mean first passage times, ti, are sampled. Each sample is used to compute the free energy and the MFPT. The first and the second moments of the last distributions are used to estimate the values and the standard deviation of the observables. The standard deviations are reported as error bars. These error bars are statistical and do not reflect systematic errors like inaccuracies in the force field.
IV. Conclusions
In this manuscript we outlined a detailed investigation of the reaction pathway, dynamics, kinetics, and thermodynamics, of the escape of pyrophosphate from the active site of HIV-RT. We were able to directly connect simulations of kinetics and thermodynamics with specific structural features, such as the sequential binding and dissociation of lysine residues and the coupled escape of one magnesium ion from the active site. A diverse set of computational and theoretical tools were required to bridge the time scale gap of straightforward Molecular Dynamics and the experimental time scale. This was achieved by multistep calculations. We first search for plausible reaction coordinate and escape pathways by a combination of the Locally Enhanced Sampling method13 and Steered Molecular Dynamics available in NAMD.24 The structures sampled from the algorithms for path searches were used in Milestoning simulations that generated short trajectories between milestones and computed the overall kinetics and thermodynamics of the system. Analyzing the trajectories and the free energy illustrated the significant coupling between the positively charged ion (magnesium) and the lysine with the leaving group of PPi. The computational time scales of a few tens of milliseconds are similar to experimental rates.6 However, the calculations are not accurate enough to differentiate between mutants of lysine and arginine residues or to decide which step is rate-determining, chemical reaction or PPi escape. This is since the chemical reaction is of a comparable time scale as well.
We expect that the same combination of different theoretical tools for path searching (LES), path refinement (SMD), and sampling within a path (Milestoning), will be useful in addressing other complex processes in macromolecular biophysics.
Acknowledgments
This research was supported by NIH grants GM059796 and by a Welch Foundation grant F-1896 to RE.
References
- 1.Kirmizialtin S, Nguyen V, Johnson Kenneth A, Elber R. How Conformational Dynamics of DNA Polymerase Select Correct Substrates: Experiments and Simulations. Structure. 2012;20:618–627. doi: 10.1016/j.str.2012.02.018. [DOI] [PMC free article] [PubMed] [Google Scholar]
- 2.Kirmizialtin S, Johnson KA, Elber R. Enzyme Selectivity of HIV Reverse Transcriptase: Conformations, Ligands, and Free Energy Partition. J Phys Chem B. 2015;119(35):11513–11526. doi: 10.1021/acs.jpcb.5b05467. [DOI] [PMC free article] [PubMed] [Google Scholar]
- 3.Radhakrishnan R, Schlick T. Orchestration of Cooperative Events in DNA Synthesis and Repair Mechanism Unraveled by Transition Path Sampling of DNA Polymerase Beta’s Closing. P Natl Acad Sci USA. 2004;101(16):5970–5975. doi: 10.1073/pnas.0308585101. [DOI] [PMC free article] [PubMed] [Google Scholar]
- 4.Kellinger MW, Johnson KA. Nucleotide-Dependent Conformational Change Governs Specificity and Analog Discrimination by HIV Reverse Transcriptase. Proceedings of the National Academy of Sciences. 2010;107:7734–7739. doi: 10.1073/pnas.0913946107. [DOI] [PMC free article] [PubMed] [Google Scholar]
- 5.Malinen AM, Turtola M, Parthiban M, Vainonen L, Johnson MS, Belogurov GA. Active Site Opening and Closure Control Translocation of Multisubunit RNA Polymerase. Nucleic Acids Res. 2012;40:7442–7451. doi: 10.1093/nar/gks383. [DOI] [PMC free article] [PubMed] [Google Scholar]
- 6.Li A, Gong S, Johnson KA. Rate-limiting Pyrophosphate Release by HIV Reverse Transcriptase Improves Fidelity. The Journal of biological chemistry. 2016;291:26554–26565. doi: 10.1074/jbc.M116.753152. [DOI] [PMC free article] [PubMed] [Google Scholar]
- 7.Da LT, Wang D, Huang XH. Dynamics of Pyrophosphate Ion Release and Its Coupled Trigger Loop Motion from Closed to Open State in RNA Polymerase II. J Am Chem Soc. 2012;134(4):2399–2406. doi: 10.1021/ja210656k. [DOI] [PMC free article] [PubMed] [Google Scholar]
- 8.Genna V, Gaspari R, Dal Peraro M, De Vivo M. Cooperative Motion of a Key Positively Charged Residue and Metal Ions for DNA Replication Catalyzed by Human DNA Polymerase-eta. Nucleic Acids Res. 2016;44(6):2827–2836. doi: 10.1093/nar/gkw128. [DOI] [PMC free article] [PubMed] [Google Scholar]
- 9.Golosov AA, Warren JJ, Beese LS, Karplus M. The Mechanism of the Translocation Step in DNA Replication by DNA Polymerase I: A Computer Simulation Analysis. Structure. 2010;18(1):83–93. doi: 10.1016/j.str.2009.10.014. [DOI] [PMC free article] [PubMed] [Google Scholar]
- 10.Elber R. A New Paradigm for Atomically Detailed Simulations of Kinetics in Biophysical Systems. Q Rev Biophys. 2017;50 doi: 10.1017/S0033583517000063. [DOI] [PubMed] [Google Scholar]
- 11.Huang HF, Chopra R, Verdine GL, Harrison SC. Structure of a Covalently Trapped Catalytic Complex of HIV-I Reverse Transcriptase: Implications for Drug Resistance. Science. 1998;282(5394):1669–1675. doi: 10.1126/science.282.5394.1669. [DOI] [PubMed] [Google Scholar]
- 12.Berman HM, Westbrook J, Feng Z, Gilliland G, Bhat TN, Weissig H, Shindyalov IN, Bourne PE. The Protein Data Bank. Nucleic Acids Res. 2000;28:235–42. doi: 10.1093/nar/28.1.235. [DOI] [PMC free article] [PubMed] [Google Scholar]
- 13.Elber R, Karplus M. Enhanced Sampling in Molecular Dynamics: Use of the Time-Dependent Hartree Approximation for a Simulation of Carbon Monoxide Diffusion Through Myoglobin. J Am Chem Soc. 1990;112:9161–9175. [Google Scholar]
- 14.Roitberg A, Elber R. Modeling Side-Chains in Peptides and Proteins - Application of the Locally Enhanced Sampling and the Simulated Annealing Methods to Find Minimum Energy Conformations. J Chem Phys. 1991;95(12):9277–9287. [Google Scholar]
- 15.Verkhivker G, Elber R, Nowak W. Locally Enhanced Sampling in Free-Energy Calculations - Application of Mean Field Approximation to Accurate Calculation of Free-Energy Differences. J Chem Phys. 1992;97(10):7838–7841. [Google Scholar]
- 16.Simmerling C, Fox T, Kollman PA. Use of Locally Enhanced Sampling in Free Energy Calculations: Testing and Application to the Alpha ->Beta Anomerization of Glucose. J Am Chem Soc. 1998;120(23):5771–5782. [Google Scholar]
- 17.Chiancone E, Elber R, Royer WE, Regan R, Gibson QH. Ligand-Binding and Conformation Change in the Dimeric Hemoglobin of the Clam Scapharca-Inaequivalvis. J Biol Chem. 1993;268(8):5711–5718. [PubMed] [Google Scholar]
- 18.Elber R, Roitberg A, Simmerling C, Goldstein R, Li H, Verkhivker G, Keasar C, Zhang J, Ulitsky A. MOIL: A Program for Simulations of Macromolecules. Computer Physics Communications. 1995;91:159–189. [Google Scholar]
- 19.Jorgensen WL, Tiradorives J. The OPLS Potential Functions for Proteins - Energy Minimizations for Crystals of Cyclic-Peptides and Crambin. J Am Chem Soc. 1988;110(6):1657–1666. doi: 10.1021/ja00214a001. [DOI] [PubMed] [Google Scholar]
- 20.Weinbach Y, Elber R. Revisiting and Parallelizing SHAKE. Journal of Computational Physics. 2005;209:193–206. [Google Scholar]
- 21.Darden T, York D, Pedersen L. Particle mesh Ewald: An Nlog(N) method for Ewald sums in large systems. The Journal of Chemical Physics. 1993;98:10089–10092. [Google Scholar]
- 22.Straub JE, Karplus M. Energy Equipartitioning in the Classical Time-Dependent Hartree Approximation. J Chem Phys. 1991;94(10):6737–6739. [Google Scholar]
- 23.Ulitsky A, Elber R. The Thermal-Equilibrium Aspects of the Time-Dependent Hartree and the Locally Enhanced Sampling Approximations - Formal Properties, a Correction, and Computational Examples for Rare-Gas Clusters. J Chem Phys. 1993;98(4):3380–3388. [Google Scholar]
- 24.Phillips JC, Braun R, Wang W, Gumbart J, Tajkhorshid E, Villa E, Chipot C, Skeel RD, Kalé L, Schulten K. Scalable Molecular Dynamics with NAMD. Journal of Computational Chemistry. 2005;26:1781–1802. doi: 10.1002/jcc.20289. [DOI] [PMC free article] [PubMed] [Google Scholar]
- 25.Humphrey W, Dalke A, Schulten K. VMD: Visual Molecular Dynamics. Journal of Molecular Graphics. 1996;14:33–38. doi: 10.1016/0263-7855(96)00018-5. [DOI] [PubMed] [Google Scholar]
- 26.Hart K, Foloppe N, Baker CM, Denning EJ, Nilsson L, MacKerell AD. Optimization of the CHARMM Additive Force Field for DNA: Improved Treatment of the BI/BII Conformational Equilibrium. J Chem Theory Comput. 2012;8(1):348–362. doi: 10.1021/ct200723y. [DOI] [PMC free article] [PubMed] [Google Scholar]
- 27.Best RB, Zhu X, Shim J, Lopes PEM, Mittal J, Feig M, Mackerell AD., Jr Optimization of the Additive CHARMM All-Atom Protein Force Field Targeting Improved Sampling of the Backbone φ, ψ and Side-Chain χ(1) and χ(2) Dihedral Angles. J Chem Theory Comput. 2012;8:3257–3273. doi: 10.1021/ct300400x. [DOI] [PMC free article] [PubMed] [Google Scholar]
- 28.Jorgensen WL, Chandrasekhar J, Madura JD, Impey RW, Klein ML. Comparison of Simple Potential Functions for Simulating Liquid Water. The Journal of Chemical Physics. 1983;79:926–935. [Google Scholar]
- 29.Beglov D, Roux B. Finite Representation of an Infinite Bulk System: Solvent Boundary Potential for Computer Simulations. The Journal of Chemical Physics. 1994;100:9050–9063. [Google Scholar]
- 30.Faradjian AK, Elber R. Computing Time Scales from Reaction Coordinates by Milestoning. J Chem Phys. 2004;120(23):10880–10889. doi: 10.1063/1.1738640. [DOI] [PubMed] [Google Scholar]
- 31.Bello-Rivas JM, Elber R. Exact Milestoning. J Chem Phys. 2015;142:9. doi: 10.1063/1.4913399. [DOI] [PMC free article] [PubMed] [Google Scholar]
- 32.Czerminski R, Elber R. Computational Studies of Ligand Diffusion in Globins. 1. Leghemoglobin. Proteins. 1991;10(1):70–80. doi: 10.1002/prot.340100107. [DOI] [PubMed] [Google Scholar]
- 33.Castro C, Smidansky E, Maksimchuk KR, Arnold JJ, Korneeva VS, Gotte M, Konigsberg W, Cameron CE. Two Proton Transfers in the Transition State for Nucleotidyl Transfer Catalyzed by RNA- and DNA-Dependent RNA and DNA Polymerases. Proceedings of the National Academy of Sciences. 2007;104:4267–4272. doi: 10.1073/pnas.0608952104. [DOI] [PMC free article] [PubMed] [Google Scholar]
- 34.Sarafianos SG, Das K, Clark AD, Ding JP, Boyer PL, Hughes SH, Arnold E. Lamivudine (3TC) Resistance in HIV-1 Reverse Transcriptase Involves Steric Hindrance with Beta-Branched Amino Acids. P Natl Acad Sci USA. 1999;96:10027–10032. doi: 10.1073/pnas.96.18.10027. [DOI] [PMC free article] [PubMed] [Google Scholar]
- 35.Ma Piao, Cardenas Alfredo E, Chaudhari Mangesh I, Elber Ron, Rempe Susan B. The Impact of Protonation on Early Translocation of the Anthrax Lethal Factor: Kinetics From Molecular Dynamics Simulations and Milestoning Theory. J Amer Chem Soc. doi: 10.1021/jacs.7b07419. (submitted) [DOI] [PMC free article] [PubMed] [Google Scholar]
- 36.Mugnai ML, Elber R. Extracting the Diffusion Tensor from Molecular Dynamics Simulation with Milestoning. J Chem Phys. 2015;142:014105. doi: 10.1063/1.4904882. [DOI] [PMC free article] [PubMed] [Google Scholar]


