Abstract
Goal
This research aims to validate a new biomarker of breast cancer by introducing electromechanical coupling factor of breast tissue samples as a possible additional indicator of breast cancer. Since collagen fibril exhibits a structural organization that gives rise to a piezoelectric effect, the difference in collagen density between normal and cancerous tissue can be captured by identifying the corresponding electromechanical coupling factor.
Methods
The design of a portable diagnostic tool and a microelectromechanical systems(MEMS)-based biochip, which is integrated with a piezoresistive sensing layer for measuring the reaction force as well as a microheater for temperature control, is introduced. To verify that electromechanical coupling factor can be used as a biomarker for breast cancer, the piezoelectric model for breast tissue is described with preliminary experimental results on five sets of normal and invasive ductal carcinoma (IDC) samples in the 25–45°C temperature range.
Conclusion
While the stiffness of breast tissues can be captured as a representative mechanical signature which allows one to discriminate among tissue types especially in the higher strain region, the electromechanical coupling factor shows more distinct differences between the normal and IDC groups over the entire strain region than the mechanical signature. From the two-sample t-test, the electromechanical coupling factor under compression shows statistically significant differences (p ≤ 0.0039) between the two groups.
Significance
The increase in collagen density in breast tissue is an objective and reproducible characteristic of breast cancer. Although characterization of mechanical tissue property has been shown to be useful for differentiating cancerous tissue from normal tissue, using a single parameter may not be sufficient for practical usage due to inherent variation among biological samples. The portable breast cancer diagnostic tool reported in this manuscript shows the feasibility of measuring multiple parameters of breast tissue allowing for practical application.
I. Introduction
The American Cancer Society estimates 255,180 (252,710 females and 2,470 males) new cases of breast cancer and 41,070 deaths from breast cancer in 2017 in the United States alone [1]. Early detection of breast cancer is one of the key factors for increasing survival rates and improving patients’ quality of life [2]. Given the importance of early detection of breast cancer, investigators throughout the clinical and research communities are working to develop new biomarkers for facilitating more accurate breast cancer diagnosis.
One of the single largest risk factors for breast cancer is high density breast tissue [3]–[5]. It is known that breast tissue gets stiffer due to increased collagen during the process of transforming from benign to malignant [6], [7], however the reason why breast tissue with dense collagen increases the risk of breast cancer is not yet clearly understood at the molecular level [8], [9]. Provenzano et al. has visualized increased collagen on cancerous breast tissue as well as difference of collagen fibril organization on normal and cancerous breast tissue using nonlinear microscopy techniques such as multiphoton laser-scanning microscopy (MPLSM) and second harmonic generation (SHG) which provide powerful tools to image cellular autofluorescence and extracellular matrix (ECM) structure [8]. Though these imaging techniques do not measure the absolute amount of collagen, the results clearly show increased collagen in a tumor through a collagen distribution map based on the intensity of the fluorescent signal. As ECM undergoes changes with the progression of breast cancer, the electrical properties of breast tissue are also changing. Based on these property changes in cancerous breast tissue, researchers in the engineering community including our group have used mechanical and electrical characterization to discriminate breast tissue as normal or cancerous. Elasticity and electric impedance have both been used as representative biomarkers of breast cancer [10]–[18]. With the help of nanotechnology, phenotyping breast cancer at the cellular level has been recognized as one of the main research areas. However, the investigation of breast cancer at the cellular scale requires not only a bulky system but also a skilled operator. To translate the outcome from laboratory to clinical use, development of a portable and easy-to-use device is critical for clinical application.
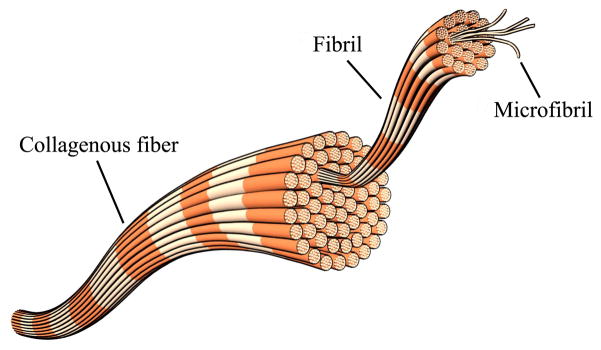
The increased density of collagen is a significant factor for diagnosing breast cancer. Individual collagen fibers are bundles of collagen fibrils as shown in Fig. 1 [19]. Since the highly oriented structure of collagen fibrils plays a role as the crystal lattice generates electric dipole moments under mechanical pressure, collagen has the piezoelectric effect like crystalline materials [20], [21]. From the observation that high collagen density is found in cancerous breast tissue, our team has been systematically investigating whether the electromechanical coupling factor can be used as an additional criterion to diagnose breast cancer.
Fig. 1.
Schematic of collagen structure.
Although various diagnostic methods for breast cancer have been developed, current techniques including mammography and visual inspection of the tissue specimen taken by needle biopsy are largely qualitative approaches. Elastography, an imaging technique using the mechanical characterization of breast tissue has also been widely used for breast cancer diagnosis in the clinic. However, it is often difficult to differentiate benign and malignant tissue through elastography, mainly due to the high variability of lesions [22]–[24]. As an extension of our previous study [25], which was the development of a microelectromechanical systems (MEMS) based sensor that enables simultaneous electrical and mechanical property measurement of breast tissue, electromechanical coupling factor of breast tissue is introduced as a biomarker of breast cancer. This research aims to develop a portable diagnostic tool, which provides an automated diagnostic procedure with one-click operation so that involvement in the procedure by the operator can be minimized. Knowledge of available diagnostic methods for breast cancer and challenges encountered by current and past techniques were taken into account during the developing of a prototype. This paper will discuss the design of a portable diagnostic tool with the disposable 3-D printed package, a piezoelectric model of breast tissue, histological staining techniques, and experimental results to show the feasibility of electromechanical coupling factor as a biomarker for breast cancer.
II. Materials and Methods
A. Portable Diagnostic Tool
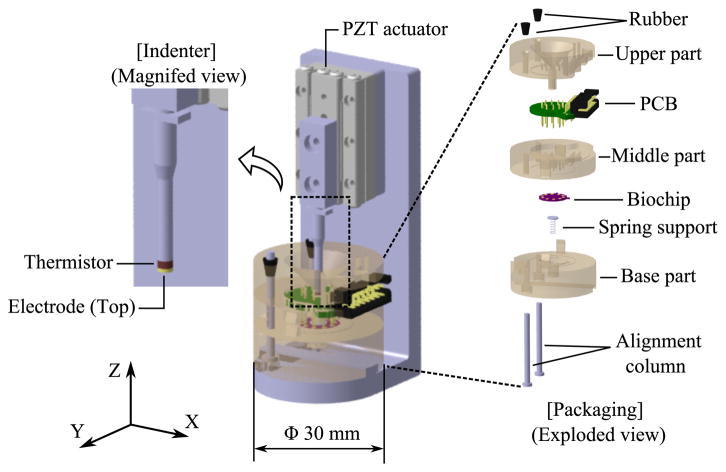
Figure 2 shows the schematic of the portable diagnostic tool which can phenotype mechanical and electrical property of breast tissue simultaneously. Linear piezoelectric actuator (SLC2490, SmarAct, Germany) with sub-nanometer resolution sensor drives the indenter for mechanical indentation, while MEMS-based biochip in a disposable package measures compression force of indentation and voltage across the tissue sample. 3-D printed structural parts of the package hold the biochip and printed circuit board (PCB), and tissue sample tight for stable measurement.
Fig. 2.
Schematic of the portable diagnostic tool.
The biochip consists of a microheater, the electrode (bottom), and a piezoresistive sensing layer. The microheater on the biochip generates the appropriate amount of heat to control the temperature of the tissue sample with the feedback signal from the thermistor at the tip of the indenter. The electrode (bottom) on the biochip and the electrode (top) at the tip of the indenter allow electric current to flow through the tissue sample located in between these two electrodes. Germanium based piezoresistive sensing layer serves as a force sensor. Details about dimensions of the sensor and the fabrication process can be found in our previous work [25].
B. Piezoelectric Model
The general constitutive equation for piezoelectric material at constant temperature is given by [26]:
| (1) |
where, ε is the 6×1 strain vector , SE [m2/N] is the 6×6 elastic compliance tensor at zero electric field, σ [N/m2] is the 6×1 stress vector, d [m/V or C(Coulomb)/m] is the 6×3 piezoelectric modulus tensor, E [V/m] is the 3×1 electric vector field vector, D [C/m2] is the 3×1 electric displacement vector, and Kσ [F (Farad)/m] is the 3×3 dielectric tensor at zero stress.
Two assumptions are made to simplify the model into a one-dimensional case and to allow our team to design the portable diagnostic tool according to the assumptions: 1) the tissue sample and the tube which holds the sample are perfectly cylindrical in shape and 2) the circumferential boundary of the tissue sample fits tightly inside the tube so that the tissue sample deforms only in the longitudinal direction (i.e. along the Z-axis as shown in Fig. 2) without changing its cross-sectional area while being indented. Under these assumptions, the variables D and E can be replaced by i (current vector) and V (voltage vector), respectively, when the model is represented in the Laplace domain. Considering the model only in Z-direction, which is parallel to the direction of indentation and current path through the tissue sample, we get an equation with scalar variables along the Z-axis as:
| (2) |
where t and A are the thickness and the cross-sectional area of the tissue sample, respectively, while s is the complex Laplace variable and the subscript, z, represents a parameter along the Z-axis.
The electromechanical coupling factor, kz, is an indicator of the effectiveness of energy conversion from electrical to mechanical energy along the Z-axis, and is defined as [26]:
| (3) |
where (SD)z is the compliance at zero electric displacement along the Z-axis.
Based on the piezoelectric model, kz can be obtained by comparing the compliance values of the sample tissue at electrically shorted (Vz = 0) and opened (iz = 0) condition along the Z-axis as shown in Fig. 3, instead of identifying parameters of d, SE, and Kσ.
Fig. 3.
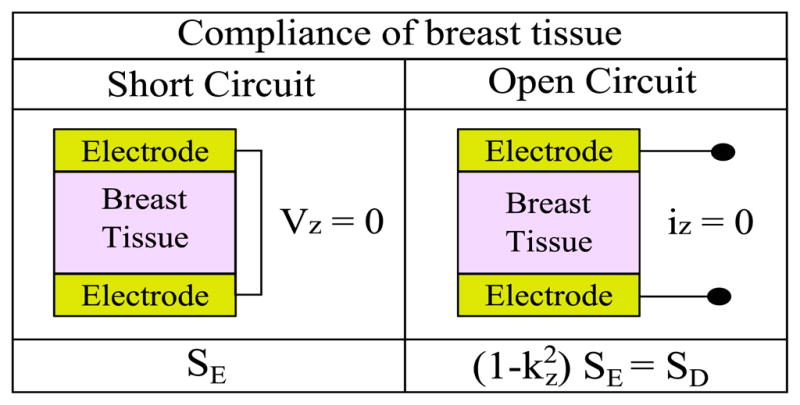
Compliance of breast tissue for two different electrical circuits for obtaining the electromechanical coupling factor (kz) of the tissue along the Z-axis using tissue indentation tests.
C. Breast Tissue Sample Preparation
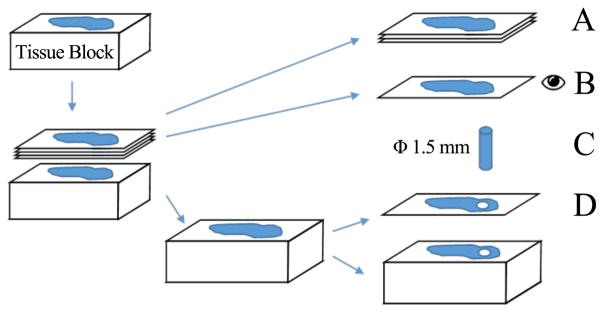
Invasive ductal carcinoma (IDC) and normal breast tissue specimens were carefully selected and extracted from Rutgers Cancer Institute of New Jersey Biospecimen Repository Shared Resource. Even though our specimens from a biobank went through preparation and preservation, our previous efforts showed the same trend of mechanical characteristics when compared with studies on fresh tissues from biopsy [27], [28]. Therefore, we chose to prototype and experiment with our new devices on banked human breast tissues which are easily accessible over fresh tissues. Due to the inherent limitation of biopsy for achieving aligned tissue samples from different persons, the orientation of the sampled tissues is not consistent. Figure 4 describes breast tissue sample preparation process for staining and indentation experiment. Five consecutive 4–5 μm sections were taken from each tissue block. The top sections were reserved for immunohistochemistry (IHC) staining and special staining, while the last section was stained with hematoxylin and eosin (H&E). These H&E sections were examined under a microscope by a certified pathologist to identify optimum sampling regions for breast cancer and normal breast glandular structure, and subsequently used to guide the extraction of a cylinder of 1.5 mm diameter for experimentation. The tissue block was sectioned once more and stained H&E to confirm that the sampling regions contain desired tissue component. Five specimens each of normal and IDC were prepared and the samples were kept hydrated with phosphate-buffered saline (PBS) at room temperature (23°C ± 2°C) for 2 hours before pre-conditioning.
Fig. 4.
Breast tissue sample preparation. (Legend A: adjacent sections for IHC staining and special staining. Legend B: H&E stained “before/pre” section. Legend C: cylinder sample to be indented. Legend D: H&E stained “after/post” section.
D. Histological Staining Protocols
Several histological staining techniques were selected to visualize key relevant molecules contributing to the change of supportive structure of the breast tissue and surrounding stroma. The normal breast glandular structure is comprised of two-layered breast lobules and ducts. This parenchyma is surrounded by mesenchymal-stroma that provides mechanical support and a tightly controlled biochemical microenvironment [29], [30]. Cancer not only affects the breast parenchyma cells, but also significantly alters the mesenchymal homeostat and the resulting fibrous mesenchymal reaction often creates the stiff stromal environment that facilitates cancer progression and metastasis. Signs of the so-called desmoplastic change often include an abundance of myofibroblasts and anisotropic collagen, especially type-I collagen, as well as an increase of TGF-β signaling [31]. To visualize the marker proteins in such a molecular microenvironment, we selected Masson’s trichrome to show collagen, smooth-muscle actin (SMA) and fibronectin [32]. SMA is normally seen on myoepithelial cells that form the outer layer of breast parenchyma. In invasive carcinoma, on the other hand, the myoepithelial cells are often absent, and SMA visualizes myofibroblasts in the desmoplastic stroma. Fibronectin is secreted in cells in an inactive form and binds extracellular matrix through integrin on the cell surface when folded and assumed dimer formation. It is also upregulated during desmoplasia or fibrotic response.
1) H&E staining Protocol
H&E staining was conducted on TISSUE-TEK DRS 2000 (Sakura Finetek USA, Inc., CA, USA) with the Richard-Allan histology signature series stains following the recommended protocol: deparaffinize and rehydrate; hematoxylin solution 3–4 minutes, clarifier solution 1 minute, blueing reagent 1 minute, with rinsing in between; 95% alcohol; Eosin-Y solution 1.5–2 minutes; alcohol and xylene before coverslip.
2) General IHC Protocol
All IHC are performed using Ventana Discovery XT automated IHC/ISH slide staining system. Slides are cut at 4–5 μm. Deparaffinization and antigen retrieval are performed using CC1 (Cell Conditioning I, Ventana Medical Systems, Cat #950-124). All primary antibodies are incubated at 37°C for 1 hour. Universal Secondary Antibody (Ventana Medical Systems, Cat #760-4205) is incubated for 12 minutes followed by chromogenic detection kit DAB Map (Ventana Medical Systems, Cat #760-124) or RedMap (Ventana Medical Systems, Cat #760-123). Slides are counterstained with Hematoxylin, then dehydrated and cleared before coverslipping from xylene.
3) Trichrome Stain
Deparaffinized specimens were hydrated to deionized water and mordant in preheated Bouin’s solution at 56°C or overnight at room temperature. After mordanting, wash in running water until yellow color disappears from sections. Staining steps include Working Weigert’s Iron Hematoxylin solution for 5–10 minutes, Biebrich Scarlet-Acid Fuchsin Solution for 5 minutes, Working Phosphotungstic/Phosphomolybdic Acid Solution for 5 minutes, Aniline Blue Solution for 5 minutes, 1% Acetic Acid for 2 minutes, with rinsing in between. The slides were finally rinsed in running water, then dehydrated, cleared, mounted and coverslipped.
4) SMA-Redmap
Paraffin slides were cut at 4-5 μm. Deparaffinization and antigen retrieval are performed using CC1 (Cell Conditioning Solution, Ventana Medical Systems, Cat #950-124). Anti-SMA (Ventana Medical Systems, Cat #760-2833, mouse monoclonal antibody, [Available Online] http://ventana.com/product/9?type=4) is applied and slides are incubated at 37°C for 1 hour. Universal Secondary antibody (Ventana Medical Systems, Cat #760-4205) is incubated for 12 minutes followed by RedMap detection kit (Ventana Medical Systems, Cat #760-123).
5) Fibronectin-DABmap
Paraffin slides were cut at 4–5 μm. Deparaffinization and antigen retrieval are performed using CC1 (Cell Conditioning Solution, Ventana Medical Systems, Cat #950-124). Anti-Fibronectin (Millipore, Cat #AB2033, rabbit polyclonal antibody, [Available Online] https://www.emdmillipore.com/US/en/product/Anti-Fibronectin-Antibody,MM_NF-AB2033) is applied at 1:1500 and slides are incubated at 37°C for 1 hour. Universal Secondary antibody (Ventana Medical Systems, Cat #760-4205) is incubated for 12 minutes followed by chromogenic detection kit DABMap (Ventana Medical Systems, Cat #760-124).
E. Pre-conditioning
Generally, preconditioning of biological specimen is required for obtaining repeatable result during mechanical loading experiment, since internal structure of the specimen changes with repeated loading until it reaches a steady state for the given routine [33]. When any loading condition such as the upper/lower strain limit or strain rate changes, the specimen should be preconditioned again [33]. All breast tissue samples were preconditioned 15 times in compression with a maximum strain of 0.2 and strain rate of 0.01/s. These parameters were the same during the actual indentation experiments.
III. Experiments and Results
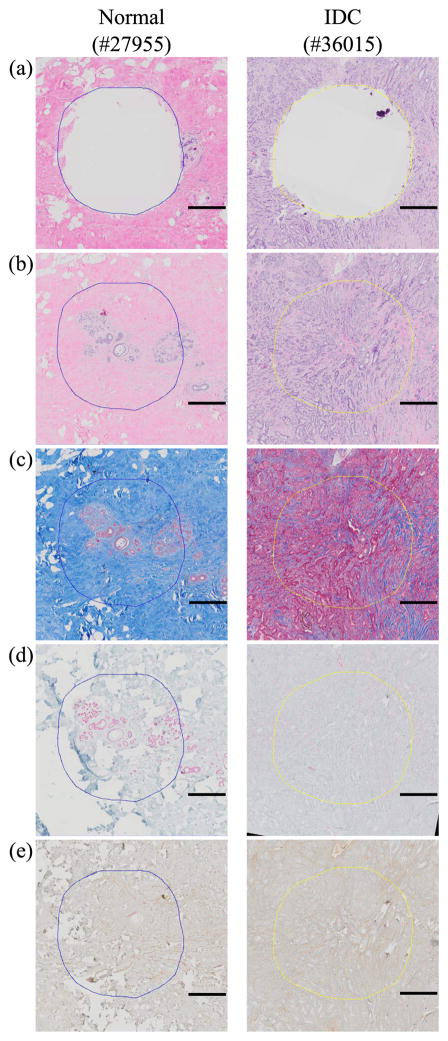
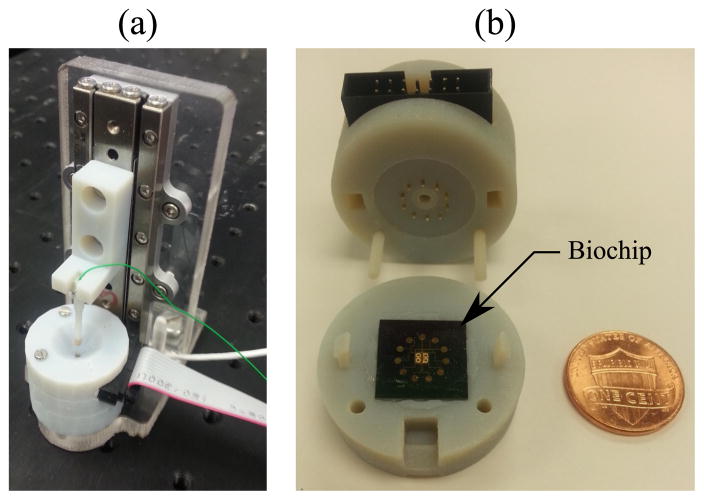
By digitally aligning whole slide images of stained sections, we can accurately identify tissue structure and molecular marker on the samples that underwent the indentation experiments. Histological and immunohistological staining results of each normal and IDC sample are shown in Fig. 5. The normal specimen images confirmed accurate sampling of normal breast tissue lobules that are surrounded by fibrotic stroma, in which collagen-fibronectin are distributed in a similar pattern, as visualized with Trichrome and Fibronectin stains. SMA staining highlights the present myoepithelial layer. The cancer specimens, on the other hand, show loss of lobular architecture. Trichrome staining shows increased collagen deposition and uneven pattern of fibronectin staining accompanying infiltrating malignant glands. The desmoplastic stroma also displays SMA expression in a haphazard pattern. Figure 6 shows the overall experimental setup for measuring responses of the tissues and the biochip in the package. 16 bits data acquisition (DAQ) card (Model 626, Sensoray, USA) was used for recording data. Analog signal amplifier and low pass filter were implemented for conditioning signals from the biochip. The tissue sample was placed at the center of the biochip and cylindrical tube of 3D printed structure allowed the tissue to deform in the Z-axis only. For the indentation experiment, the maximum strain of 0.2 and strain rate of 0.01/s were applied. Using two electrodes, which are the electrode on the biochip and the electrode at the tip of the indenter, electrical circuit through the tissue can be opened or shorted to enable the measurement of SD and SE .
Fig. 5.
Example histological and immunohistrological images of normal (#27955) and IDC (#36015) breast tissue: (a) H&E after sampling (b) H&E before sampling (c) trichrome, (d) SMA, (e) fibronectin. Scale bar on each image indicates 500 μm.
Fig. 6.
Experimental setup: (a) overall view of the diagnostic tool (b) fabricated biochip in the package.
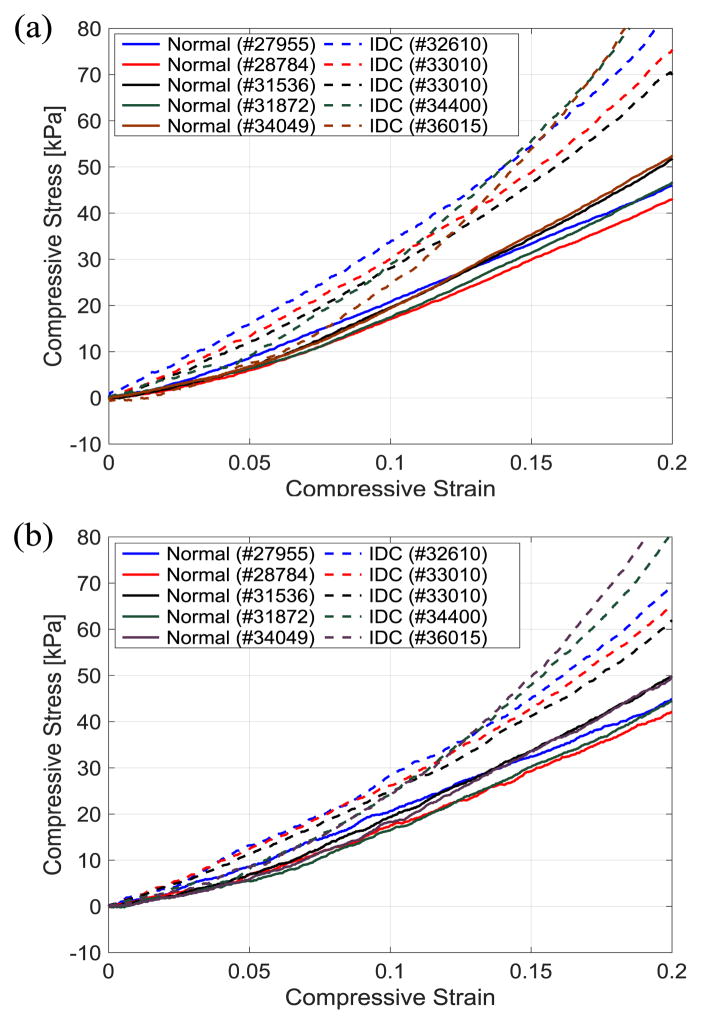
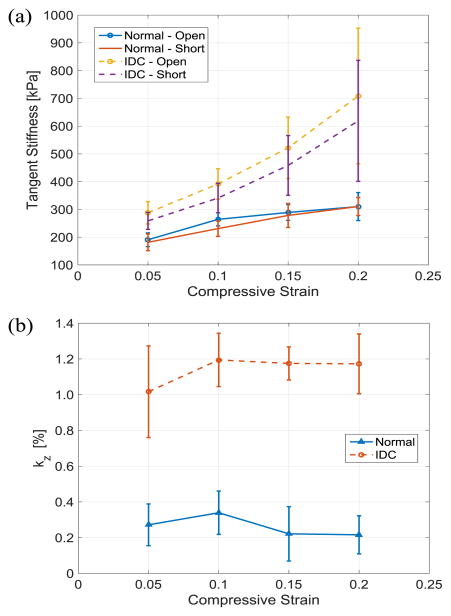
Stress-strain curves of the tissues under compression with electrically opened and shorted cases are shown in Fig. 7. The stress of the tissue samples in IDC group tends to increase drastically compared to the normal tissues in both open and short circuit cases as the induced strain gets higher. Using the stress-strain data set, tangent stiffness and electromechanical coupling factor of the tissue are calculated at every compressive strain of 0.05 and plotted as shown in. Fig. 8(a) and (b), respectively. To reduce noise amplification effect during calculation of tangent stiffness, the first order central differentiation method with eleven data points are used except for the last point of data at the maximum strain of 0.2 in which backward method is applied.
Fig. 7.
Stress-strain curves of the breast tissues under compression 25°C: (a) with electrically opened (b) with electrically shorted.
Fig. 8.
Experimental result of breast tissue signatures in Z-axis at 25°C: (a) tangent stiffness (b) electromechanical coupling factor.
The entire experimental results in tangent stiffness and electromechanical factor of the breast tissue samples at 25–45°C of the range are shown in Table I for the comparison between normal and IDC group. Regarding with the tangent stiffness, we can observe two features which are consistent with previous researches on mechanical characterization of breast tissue [34]–[37] : 1) much bigger difference between normal and IDC samples at higher strain level and 2) smaller temperature effect at the given range than the variation between samples. On the other hand, resources about electromechanical coupling factor for breast cancer specimen are extremely limited. Moreover, a consensus even for the study of bone, which one of the most active areas of research using human tissues, is required since there are inconsistent results among the piezoelectric constants measured by different research groups [38]–[42].
TABLE I.
Experimental Results
| Strain | Temp. | T.S (O.C) [kPa] | T.S (S.C) [kPa] | kz | [%] | ||
|---|---|---|---|---|---|---|---|
|
| |||||||
| Normal | IDC | Normal | IDC | Normal | IDC | ||
|
| |||||||
| 0.05 | 25°C | 190.7±24.6 | 288.0±40.2 | 181.5±30.1 | 258.9±30.7 | 0.27 ±0.12 | 1.02±0.26 |
| 30°C | 188.8±27.4 | 271.2±51.3 | 183.1±34.2 | 249.1±32.6 | 0.20 ±0.08 | 1.12±0.32 | |
| 35°C | 187.2±16.1 | 287.0±31.2 | 189.0±29.1 | 260.1±39.1 | 0.29 ±0.09 | 1.06±0.27 | |
| 40°C | 190.0±20.4 | 293.0±30.8 | 177.8±33.1 | 255.4±29.2 | 0.24 ±0.11 | 1.08±0.20 | |
| 45°C | 189.2±17.4 | 277.0±34.8 | 180.3±31.0 | 261.1±25.9 | 0.30 ±0.17 | 1.07±0.28 | |
|
| |||||||
| 0.10 | 25°C | 264.2±23.6 | 391.6±54.8 | 230.9±28.0 | 341.0±53.1 | 0.34±0.12 | 1.19±0.15 |
| 30°C | 258.2±25.1 | 393.1±55.7 | 240.2±25.5 | 333.3±50.9 | 0.30±0.18 | 1.02±0.20 | |
| 35°C | 255.1±19.2 | 380.9±48.1 | 226.2±20.5 | 322.0±39.8 | 0.37±0.17 | 1.13±0.16 | |
| 40°C | 260.6±27.0 | 399.2±60.7 | 232.2±22.3 | 351.0±49.6 | 0.36±0.15 | 1.27±0.19 | |
| 45°C | 248.9±19.9 | 379.0±44.1 | 241.9±22.0 | 334.0±44.0 | 0.36±0.13 | 1.26±0.19 | |
|
| |||||||
| 0.15 | 25°C | 289.0±28.6 | 522.0±110.7 | 278.3±43.2 | 458.4±107.7 | 0.22±0.15 | 1.18±0.09 |
| 30°C | 280.2±30.7 | 502.0±119.1 | 274.1±44.3 | 452.1±111.3 | 0.29±0.16 | 1.14±0.15 | |
| 35°C | 283.2±27.7 | 519.0±103.1 | 280.0±44.5 | 460.5±100.1 | 0.17±0.12 | 1.17±0.14 | |
| 40°C | 276.8±22.0 | 509.0±100.2 | 269.9±38.8 | 448.5±113.6 | 0.25±0.19 | 1.26±0.17 | |
| 45°C | 278.0±33.1 | 512.0±101.0 | 274.8±36.9 | 466.4±102.3 | 0.26±0.17 | 1.16±0.08 | |
|
| |||||||
| 0.20 | 25°C | 310.2±50.4 | 708.6±244.0 | 310.4±32.4 | 619.1±217.9 | 0.22±0.11 | 1.17±0.17 |
| 30°C | 300.9±58.2 | 725.0±206.2 | 298.8±40.1 | 611.3±199.5 | 0.23±0.12 | 1.08±0.15 | |
| 35°C | 299.2±44.1 | 695.4±212.2 | 313.4±30.3 | 623.3±200.2 | 0.23±0.11 | 1.26±0.17 | |
| 40°C | 301.7±45.9 | 703.2±201.3 | 300.4±33.3 | 608.9±211.0 | 0.27±0.09 | 1.16±0.26 | |
| 45°C | 308.2±39.4 | 700.9±198.9 | 311.4±29.1 | 620.2±205.3 | 0.28±0.12 | 1.17±0.14 | |
T.S : Tangent Stiffness, O.C: Open Circuit, S.C: Short Circuit.
Higher stiffness in the IDC group can be found on the stiffness plot, especially at higher strain levels. This result is consistent with the observations in previous research as one of the well-known mechanical signatures of breast cancer [13]. Compared to the stiffness result, electromechanical coupling factor shows a clear distinction between normal and IDC group without overlapping data within one standard deviation for the entire strain range. The result of the two-sample t-test shows that there is a significant difference in electromechanical coupling factor between the normal and IDC group and it can distinguish normal from IDC sample more effectively than mechanical stiffness. While tangent stiffness falls within p-value of 0.02 for both open and short circuit cases for the entire temperature range, p-value of electromechanical coupling factor has one or two orders of smaller magnitude as shown in Table II.
TABLE II.
p-value of the two-sample t-test
| Strain | Temp. | p-value from T.S (O.C) | p-value from T.S (S.C) | p-value from kz |
|---|---|---|---|---|
|
| ||||
| 0.05 | 25°C | 0.0108 | 0.0155 | 0.0039 |
| 30°C | 0.0140 | 0.0122 | 0.0026 | |
| 35°C | 0.0116 | 0.0136 | 0.0034 | |
| 40°C | 0.0133 | 0.0148 | 0.0019 | |
| 45°C | 0.0156 | 0.0139 | 0.0033 | |
|
| ||||
| 0.10 | 25°C | 0.0100 | 0.0135 | 0.0022 |
| 30°C | 0.0111 | 0.0120 | 0.0019 | |
| 35°C | 0.0096 | 0.0109 | 0.0021 | |
| 40°C | 0.0087 | 0.0140 | 0.0008 | |
| 45°C | 0.0123 | 0.0133 | 0.0015 | |
|
| ||||
| 0.15 | 25°C | 0.0082 | 0.0102 | 0.0001 |
| 30°C | 0.0098 | 0.0100 | 0.0017 | |
| 35°C | 0.0078 | 0.0083 | 0.0002 | |
| 40°C | 0.0101 | 0.0099 | 0.0010 | |
| 45°C | 0.0079 | 0.0093 | 0.0008 | |
|
| ||||
| 0.20 | 25°C | 0.0086 | 0.0096 | 0.0006 |
| 30°C | 0.0087 | 0.0099 | 0.0015 | |
| 35°C | 0.0068 | 0.0085 | 0.0004 | |
| 40°C | 0.0088 | 0.0089 | 0.0009 | |
| 45°C | 0.0078 | 0.0093 | 0.0017 | |
T.S : Tangent Stiffness, O.C: Open Circuit, S.C: Short Circuit.
An electromechanical coupling factor (or a piezoelectric constant) generated by collagen in human tissues is known as a parameter that varies with moisture content, pH, frequency of input stress, and orientation of the sample [19], [43], while mechanical stiffness (or elastic modulus) of human soft tissue is affected by strain rate, strain level, shape of indenter [33], [44]. All samples used in the experiment were kept in the same conditions except orientation of each sample which is an inherent limitation of the current biopsy procedure. However, the orientation of breast tissues seems not to affect much on electromechanical coupling factor based on two observations: 1) increased, but unevenly deposited collagen on the staining image and 2) small enough variation on the experimental result among arbitrarily oriented samples. Though the confinement and different orientation of samples might be critical to reach a significantly better diagnostic result, our preliminary result obtained by a simplified model under two assumptions has shown feasibility of our approach without a comprehensive consideration of those factors. We hypothesize three reasons for explaining the result: 1) Since we investigated a small set of samples, the orientation of samples might be biased even though they were blindly sampled. 2) Collagen is deposited without directionality during breast cancer progression. 3) The restriction on lateral expansion during the experiment generates a dominant electromechanical coupling effect. Although the validity of the measured parameters and finding the optimal experimental procedure still needs to be investigated, the results show that electromechanical coupling factor measured by the portable diagnostic tool can differentiate cancerous breast tissue from normal breast tissue under the given experimental conditions.
IV. Conclusions
Higher mechanical stiffness in cancerous breast tissue serves as a representative biomarker. In practice, however, a single parameter for diagnostic decision may not yield desirable sensitivity and specificity that causes inaccurate diagnostic results such as false negatives or false positives due to variations in the characteristics of the biological samples. Finding a new biomarker to differentiate cancerous tissue from normal tissue and using it as additional criteria can lead to more accurate screening at an early stage. Though the current experimental setup may play only a subsidiary role in a clinical setting as one of the diagnostic criteria, one of the major purposes of investigating the physical property of human breast tissue is to visualize regions of interest by capturing the signature for clinical use. We envision that the technique for measuring the electromechanical properties of breast tissue will be implemented on an independent imaging system or combined with existing imaging techniques such as elastography and electrical impedance tomography (EIT) to enhance their performance if a satisfactory level of sensitivity for imaging is acquired. In this scenario, the sensitivity of the measurement is as important as measuring absolute values to visualize a targeted region clearly and differences among patients would be compensated by similar methods with other imaging systems such as modulating several input parameters to obtain a customized result.
The design of a portable diagnostic tool for breast cancer and electromechanical coupling factor as a biomarker were demonstrated along with preliminary experimental results. Although experiments with more samples and elaborate protocol are required to verify its practical effectiveness, our preliminary work shows the feasibility of using electromechanical coupling factor as a biomarker for breast cancer diagnosis. In our future work, we will improve our tool to be capable of measuring electromechanical coupling factor in multiple directions at the same time and optimize the experimental protocols by investigating various factors such as orientation and moisture content of the sample. We will also use a larger number of samples including fresh tissues as well as normal and cancerous tissue from the same individual. Furthermore, we plan to expand the scope of cancerous tissue types under study and exploit the use of machine learning techniques to verify diagnostic accuracy of this new tool.
Acknowledgments
Research reported in this publication was supported by the National Cancer Institute of the National Institutes of Health under award number R01CA161375. This research was also supported by the Biospecimen Repository Service and Histopathology Shared Resources of Rutgers Cancer Institute of New Jersey (National Institutes of Health grant: P30CA072720).
The authors would like to thank Dr. Hardik J. Pandya for designing and developing the biochip, as well as Lei Cong at the Biospecimen Repository Service and Histopathology Shared Resources of Rutgers Cancer Institute of New Jersey for her technical assistance on tissue specimen preparation.
Footnotes
The content is solely the responsibility of the authors and does not necessarily represent the official views of the National Institutes of Health.
Contributor Information
Kihan Park, Medical Robotics and Automation Laboratory (RoboMed) in the Wallace H. Coulter Department of Biomedical Engineering, Georgia Institute of Technology, Atlanta, GA, USA.
Wenjin Chen, Rutgers Cancer Institute of New Jersey, New Brunswick, NJ, USA.
Marina A. Chekmareva, Department of Pathology and Laboratory Medicine, Rutgers Robert Wood Johnson Medical School, Rutgers, The State University of New Jersey, New Brunswick, NJ, USA
David J. Foran, Rutgers Cancer Institute of New Jersey, New Brunswick, NJ, USA
Jaydev P. Desai, Medical Robotics and Automation Laboratory (RoboMed) in the Wallace H. Coulter Department of Biomedical Engineering, Georgia Institute of Technology, Atlanta, GA, USA.
References
- 1.American Cancer Society. Cancer Facts & Figures 2017. Atlanta: American Cancer Society; 2017. [Google Scholar]
- 2.Berry DA, et al. Effect of Screening and Adjuvant Therapy on Mortality from Breast Cancer. New England Journal of Medicine. 2005;353(17):1784–1792. doi: 10.1056/NEJMoa050518. [DOI] [PubMed] [Google Scholar]
- 3.Boyd NF, et al. Heritability of Mammographic Density, a Risk Factor for Breast Cancer. New England Journal of Medicine. 2002;347(12):886–894. doi: 10.1056/NEJMoa013390. [DOI] [PubMed] [Google Scholar]
- 4.Smolyakov G, et al. Elasticity, Adhesion, and Tether Extrusion on Breast Cancer Cells Provide a Signature of Their Invasive Potential. ACS Applied Materials & Interfaces. 2016;8(41):27 426–27 431. doi: 10.1021/acsami.6b07698. [DOI] [PubMed] [Google Scholar]
- 5.Ansardamavandi A, et al. Quantification of Effects of Cancer on Elastic Properties of Breast Tissue by Atomic Force Microscopy. Journal of the Mechanical Behavior of Biomedical Materials. 2016;60:234–242. doi: 10.1016/j.jmbbm.2015.12.028. [DOI] [PubMed] [Google Scholar]
- 6.Alowami S, et al. Mammographic density is related to stroma and stromal proteoglycan expression. Breast Cancer Research. 2003;5(5):R129–R135. doi: 10.1186/bcr622. [DOI] [PMC free article] [PubMed] [Google Scholar]
- 7.Kaushik S, et al. From Transformation to Metastasis: Deconstructing the Extracellular Matrix in Breast Cancer. Cancer and Metastasis Reviews. 2016;35(4):655–667. doi: 10.1007/s10555-016-9650-0. [DOI] [PMC free article] [PubMed] [Google Scholar]
- 8.Provenzano PP, et al. Collagen Reorganization at the Tumor-stromal Interface Facilitates Local Invasion. BMC Medicine. 2006;4(1):1–16. doi: 10.1186/1741-7015-4-38. [DOI] [PMC free article] [PubMed] [Google Scholar]
- 9.Gonzalez ME, et al. Mesenchymal Stem Cell-derived Collagen I Plays a Role in Organizing Breast Cancer Cell Migration and Metastasis. American Association for Cancer Research (AACR) 107th Annual Meeting; Jul, 2016. p. 14. [Google Scholar]
- 10.Alzurqa E, et al. New Improved Electrical Impedance Spectroscopy System for Early Breast Cancer Detection. Imperial Journal of Interdisciplinary Research. 2016;2(4):732–738. [Google Scholar]
- 11.Calzado-Martin A, et al. Effect of Actin Organization on the Stiffness of Living Breast Cancer Cells Revealed by Peak-force Modulation Atomic Force Microscopy. ACS Nano. 2016;10(3):3365–3374. doi: 10.1021/acsnano.5b07162. [DOI] [PubMed] [Google Scholar]
- 12.Anh-Nguyen T, et al. An Impedance Biosensor for Monitoring Cancer Cell Attachment, Spreading and Drug-induced Apoptosis. Sensors and Actuators A: Physical. 2016;241:231–237. [Google Scholar]
- 13.Krouskop TA, et al. Elastic Moduli of Breast and Prostate Tissues under Compression. Ultrasonic Imaging. 1998;20(4):260–274. doi: 10.1177/016173469802000403. [DOI] [PubMed] [Google Scholar]
- 14.Pandya HJ, et al. Mechanical Phenotyping of Breast Cancer Using MEMS: A Method to Demarcate Benign and Cancerous Breast Tissue. Lab on a Chip. 2014;14(23):4523–4532. doi: 10.1039/c4lc00594e. [DOI] [PMC free article] [PubMed] [Google Scholar]
- 15.Jossinet J, Schmitt M. A Review of Parameters for the Bioelectrical Characterization of Breast Tissue. Annals of the New York Academy of Sciences. 1999;873(1):30–41. doi: 10.1111/j.1749-6632.1999.tb09446.x. [DOI] [PubMed] [Google Scholar]
- 16.Pandya HJ, et al. Simultaneous MEMS-based Electro-mechanical Phenotyping of Breast Cancer. Lab on a Chip. 2015;15(18):3695–3706. doi: 10.1039/c5lc00491h. [DOI] [PMC free article] [PubMed] [Google Scholar]
- 17.Roy R, Desai JP. Determination of Mechanical Properties of Spatially Heterogeneous Breast Tissue Specimens Using Contact Mode Atomic Force Microscopy (AFM) Annals of Biomedical Engineering. 2014;42(9):1806–1822. doi: 10.1007/s10439-014-1057-x. [DOI] [PMC free article] [PubMed] [Google Scholar]
- 18.Pandya HJ, et al. Design and Fabrication of a Flexible MEMS-based Electro-mechanical Sensor Array for Breast Cancer Diagnosis. Journal of Micromechanics and Microengineering. 2015;25(7):075025. doi: 10.1088/0960-1317/25/7/075025. [DOI] [PMC free article] [PubMed] [Google Scholar]
- 19.Telega JJ, Wojnar R. Piezoelectric Effects in Biological Tissues. Journal of Theoretical and Applied Mechanics. 2002;40:723–759. [Google Scholar]
- 20.Marino AA, et al. Origin of the Piezoelectric Effect in Bone. Calcified Tissue Research. 1971;8(1):177–180. doi: 10.1007/BF02010135. [DOI] [PubMed] [Google Scholar]
- 21.Fukada E, Yasuda I. Piezoelectric Effects in Collagen. Japanese Journal of Applied Physics. 1964;3(2):117–121. [Google Scholar]
- 22.Bae JS, et al. Prediction of Invasive Breast Cancer Using Shear-wave Elastography in Patients with Biopsy-confirmed Ductal Carcinoma In Situ. European Radiology. 2017;27(1):7–15. doi: 10.1007/s00330-016-4359-6. [DOI] [PubMed] [Google Scholar]
- 23.Shin B, et al. Application of Eshelby’s Solution to Elastography for Diagnosis of Breast Cancer. Ultrasonic Imaging. 2016;38(2):115–136. doi: 10.1177/0161734615573030. [DOI] [PubMed] [Google Scholar]
- 24.Skerl K, et al. Anisotropy of Solid Breast Lesions in 2D Shear Wave Elastography Is an Indicator of Malignancy. Academic Radiology. 2016;23(1):53–61. doi: 10.1016/j.acra.2015.09.016. [DOI] [PubMed] [Google Scholar]
- 25.Pandya HJ, et al. Towards a Portable Cancer Diagnostic Tool Using a Disposable MEMS-based Biochip. IEEE Transactions on Biomedical Engineering. 2016;63(7):1347–1353. doi: 10.1109/TBME.2016.2535364. [DOI] [PMC free article] [PubMed] [Google Scholar]
- 26.Ikeda T. Fundamentals of Piezoelectricity. Oxford University Press; 1996. [Google Scholar]
- 27.Pandya HJ, et al. Accurate Characterization of Benign and Cancerous Breast Tissues: Aspecific Patient Studies Using Piezoresistive Microcantilevers. Biosensors and Bioelectronics. 2015;63:414–424. doi: 10.1016/j.bios.2014.08.002. [DOI] [PMC free article] [PubMed] [Google Scholar]
- 28.Roy R, et al. Microarray-facilitated Mechanical Characterization of Breast Tissue Pathology Samples Using Contact-mode Atomic Force Microscopy (AFM). Biomedical Robotics and Biomechatronics (BioRob), 2010 3rd IEEE RAS and EMBS International Conference on; IEEE; 2010. pp. 710–715. [Google Scholar]
- 29.Insua-Rodríguez J, Oskarsson T. The Extracellular Matrix in Breast Cancer. Advanced Drug Delivery Reviews. 2016;97:41–55. doi: 10.1016/j.addr.2015.12.017. [DOI] [PubMed] [Google Scholar]
- 30.Alexander J, Cukierman E. Stromal Dynamic Reciprocity in Cancer: Intricacies of Fibroblastic-ECM Interactions. Current Opinion in Cell Biology. 2016;42:80–93. doi: 10.1016/j.ceb.2016.05.002. [DOI] [PMC free article] [PubMed] [Google Scholar]
- 31.Busch S, et al. TGF-β Receptor Type-2 Expression in Cancer-associated Fibroblasts Regulates Breast Cancer Cell Growth and Survival and is a Prognostic Marker in Pre-menopausal Breast Cancer. Oncogene. 2015;34(1):27–38. doi: 10.1038/onc.2013.527. [DOI] [PubMed] [Google Scholar]
- 32.Zaha DC. Significance of Immunohistochemistry in Breast Cancer. World Journal of Clinical Oncology. 2014;5(3):382–392. doi: 10.5306/wjco.v5.i3.382. [DOI] [PMC free article] [PubMed] [Google Scholar]
- 33.Fung YC. Biomechanics: Mechanical Properties of Living Tissues. Springer-Verlag; New York: 1993. [Google Scholar]
- 34.Samani A, et al. Elastic Moduli of Normal and Pathological Human Breast Tissues: An Inversion-technique-based Investigation of 169 Samples. Physics in Medicine and Biology. 2007;52(6):1565. doi: 10.1088/0031-9155/52/6/002. [DOI] [PubMed] [Google Scholar]
- 35.Wellman P, et al. Breast Tissue Stiffness in Compression Is Correlated to Histological Diagnosis. Harvard BioRobotics Laboratory Technical Report. 1999:1–15. [Google Scholar]
- 36.Samani A, et al. Measuring the Elastic Modulus of ex vivo Small Tissue Samples. Physics in Medicine and Biology. 2003;48(14):2183. doi: 10.1088/0031-9155/48/14/310. [DOI] [PubMed] [Google Scholar]
- 37.Sapin-de Brosses E, et al. Temperature Dependence of the Shear Modulus of Soft Tissues Assessed by Ultrasound. Physics in Medicine and Biology. 2010;55(6):1701. doi: 10.1088/0031-9155/55/6/011. [DOI] [PubMed] [Google Scholar]
- 38.Halperin C, et al. Piezoelectric Effect in Human Bones Studied in Nanometer Scale. Nano Letters. 2004;4(7):1253–1256. [Google Scholar]
- 39.Hastings G, et al. Mechano-electrical Properties of Bone. Biomaterials. 1981;2(4):225–233. doi: 10.1016/0142-9612(81)90062-4. [DOI] [PubMed] [Google Scholar]
- 40.Hastings G, Mahmud F. Electrical Effects in Bone. Journal of Biomedical Engineering. 1988;10(6):515–521. doi: 10.1016/0141-5425(88)90109-4. [DOI] [PubMed] [Google Scholar]
- 41.Fukada E, Yasuda I. On the Piezoelectric Effect of Bone. Journal of the Physical Society of Japan. 1957;12(10):1158–1162. [Google Scholar]
- 42.Lang SB. Piezoelectricity, Pyroelectricity and Ferroelectricity in Biomaterials: Speculation on Their Biological Significance. IEEE Transactions on Dielectrics and Electrical Insulation. 2000;7(4):466–473. [Google Scholar]
- 43.Frank EH, Grodzinsky AJ. Cartilage Electromechanics - I. Electrokinetic Transduction and the Effects of Electrolyte pH and Ionic Strength. Journal of Biomechanics. 1987;20(6):615–627. doi: 10.1016/0021-9290(87)90282-x. [DOI] [PubMed] [Google Scholar]
- 44.Zhang M, et al. Estimating the Effective Young’s Modulus of soft Tissues from Indentation Tests - Nonlinear Finite Element Analysis of Effects of Friction and Large Deformation. Medical Engineering Physics. 1997;19(6):512–517. doi: 10.1016/s1350-4533(97)00017-9. [DOI] [PubMed] [Google Scholar]


