

Abstract
Genetic factors and mechanisms underlying food allergy are largely unknown. Due to heterogeneity of symptoms a reliable diagnosis is often difficult to make. Here, we report a genome-wide association study on food allergy diagnosed by oral food challenge in 497 cases and 2387 controls. We identify five loci at genome-wide significance, the clade B serpin (SERPINB) gene cluster at 18q21.3, the cytokine gene cluster at 5q31.1, the filaggrin gene, the C11orf30/LRRC32 locus, and the human leukocyte antigen (HLA) region. Stratifying the results for the causative food demonstrates that association of the HLA locus is peanut allergy-specific whereas the other four loci increase the risk for any food allergy. Variants in the SERPINB gene cluster are associated with SERPINB10 expression in leukocytes. Moreover, SERPINB genes are highly expressed in the esophagus. All identified loci are involved in immunological regulation or epithelial barrier function, emphasizing the role of both mechanisms in food allergy.
Food allergy is an increasing public health problem. In a genome-wide scan of children diagnosed by oral food challenge, Marenholz et al. find new genetic associations underlying food allergy, implicating the immune system and the epithelial barrier.
Introduction
Food allergy (FA) is a worldwide increasing public health problem. Disease prevalence ranges from 1 to 5% in European countries to over 10% in Australia and most studies have demonstrated a consistent increase over the past two decades. In infancy, allergic responses against hen’s egg (HE) and cow’s milk (CM) are most common whereas in childhood, peanut (PN) allergy becomes more frequent1–4. Affected children can experience severe allergic reactions rendering food allergy the most common cause of life-threatening anaphylaxis in childhood5–7. Food allergy is a complex disease with genetic and environmental factors involved. Twin studies estimated food allergy heritability at about 80%8, 9. Previous genetic studies mainly focused on PN allergy. They pointed to a few genes which were repeatedly associated with the disease. Loss-of-function (LOF) mutations in the epidermal barrier gene filaggrin (FLG) increased the risk for PN sensitization and PN allergy, likely due to increased allergen penetration and sensitization to PN through a defective skin barrier10. In addition, association of the HLA-DQB1 locus with PN allergy has been reported by several independent groups11–13. The first genome-wide association study (GWAS) defined food allergy based on a convincing history of an allergic reaction to a specific food and evidence of sensitization to the same food. This study confirmed the HLA locus on chromosome 6 to be associated with PN allergy14. Although a skin barrier defect and immunological dysfunction seem to play a role in the development of food allergy, additional genetic factors remain to be identified.
Many studies on food allergy suffer from weak phenotype definitions as they rely on individual or parental reports of an adverse reaction to food. However, due to the large spectrum of disease symptoms which may affect any organ system, a reliable diagnosis is often difficult to obtain. A systematic review of the literature revealed that the point prevalence of self-reported food allergy was approximately six times higher than the point prevalence of challenge-proven food allergy3, suggesting that over 80% of history-based food allergy diagnoses cannot be confirmed in an oral food challenge (OFC). Even if the diagnosis was based on reported allergic symptoms plus elevated specific IgE or a positive skin prick test, the prevalence of food allergy was overestimated by a factor of 3 compared with challenge-proven food allergy3. As a consequence, and in order to standardize the diagnostic criteria of food allergy, current guidelines recommend oral food challenges as the diagnostic gold standard for food allergy3, 15.
Here, we report a GWAS on OFC-proven food allergy in a German study population. The discovery set includes 523 food allergic children and 2682 population-based controls. We replicate the results in a second data set of 380 German cases and 986 controls. As additional replication set the Chicago Food Allergy Study, comprising 671 FA cases and 1526 mostly family based controls, is available14. We identifiy five genomic regions to be associated with food allergy at genome-wide significance, of which the SERPINB gene cluster has not been linked to allergic disease previously. The identified food allergy susceptibility loci support the role of epithelial barriers and of the immune response in the development of food allergy.
Results
Study design and quality control
To identify genes involved in food allergy, we performed a GWAS in a discovery set of 523 food allergic cases and 2682 population-based controls from the German Heinz Nixdorff Recall Study (HNR)16. All cases were from the Genetics of Food Allergy Study (GOFA) in which the diagnosis of food allergy was based on OFCs according to current guidelines3. After applying stringent quality control criteria (see “Methods”), the discovery set consisted of 497 cases and 2387 controls with high quality genotype data. For imputation, we used the Haplotype Reference Consortium data at the University of Michigan as reference17. In order to ascertain high quality of imputed genotypes, we filtered for a quality score of r 2>0.5 and excluded low frequency variants (minor allele frequency (MAF)<5%), yielding over five million single nucleotide polymorphisms (SNPs) available for analysis. The study design is summarized in Fig. 1. Association with disease was calculated with FastLMM using an additive allele-dosage model. The main analysis was performed on any food allergy (Fig. 2). In addition, we investigated the three most common allergies against specific foods separately, including HE (n = 288), PN (n = 220), and CM (n = 169; Fig. 2). There was no evidence for inflation of the test statistics neither in the GWAS on any food allergy (λ = 1.03) nor in the allergen-stratified analyses (Supplementary Fig. 1). For replication, we considered all loci with moderate association in the discovery set (P < 1 × 10⁻³; Supplementary Data 1a–d). If multiple SNPs from the same locus reached the selection threshold, we selected the best SNP. For the remaining SNPs, we calculated linkage disequilibrium (LD) with the lead variant. If SNPs in low LD (r 2 < 0.2) were present, again the best SNP was selected for replication.
Fig. 1.
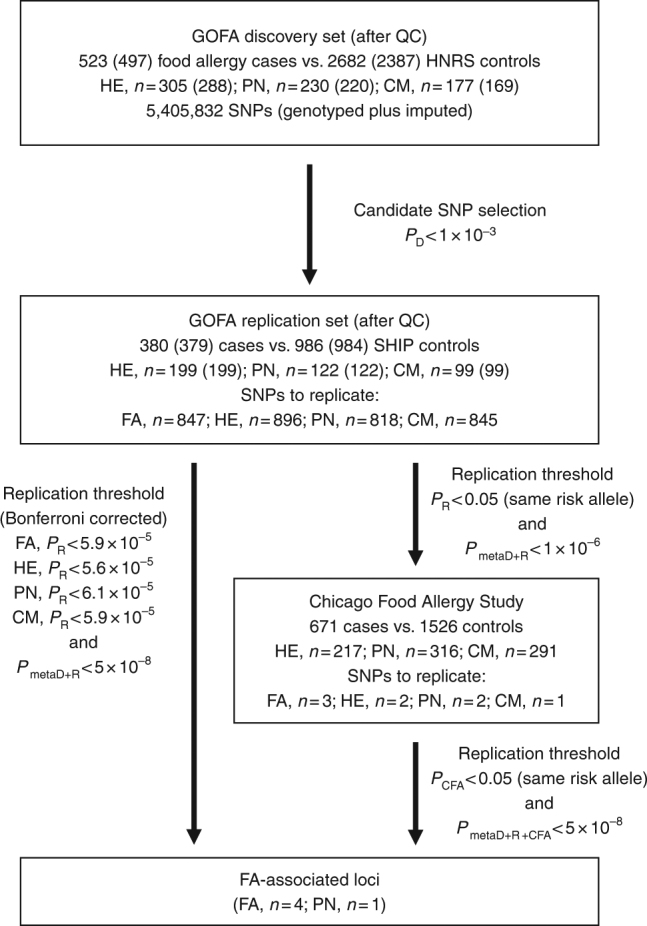
Study design of the GWAS on food allergy. Workflow of the GWAS on food allergy is shown including the number of cases and controls, and the P value thresholds used for each study set and phenotype. GOFA German Genetics of Food Allergy Study, HNR Heinz Nixdorf Recall Study, SHIP Study of Health in Pomerania, CFA Chicago Food Allergy Study, QC quality control, FA any food allergy, HE hen’s egg allergy, PN peanut allergy, CM cow’s milk allergy, P D, P R, and P metaD+R, P value in the GOFA discovery set, in the GOFA replication set, and in the meta-analysis of both sets, respectively
Fig. 2.

Association results of the GWAS on food allergy. The results of the GWAS on any food allergy (497 cases vs. 2387 controls) and on food-specific allergies against hen’s egg (288 cases), peanut (220 cases), and cow’s milk (169 cases) are presented. The Manhattan plots show the chromosomal positions (x-axis) and association P values (y-axis) for all SNPs of the discovery set. Red and blue lines indicate the thresholds for genome-wide significance (P < 5 × 10⁻⁸) and for entering the replication phase (P < 1 × 10⁻³) respectively
To replicate the findings, we investigated 380 additional food allergic cases of the GOFA study and 986 population-based controls of the Study of Health in Pomerania (SHIP)18, of which 379 and 984 samples passed the quality check. All individuals of the discovery and replication set were of European ancestry as confirmed by principal component analysis. A detailed characterization of both data sets is provided in Table 1.
Table 1.
Characterization of the German Genetics of Food Allergy Study (GOFA)
| GOFA discovery set | GOFA replication set | |
|---|---|---|
| n | 523 | 380 |
| Sex | 63% males | 66% males |
| Mean age | 2.1 years | 2.8 years |
| Food allergies | ||
| Hen’s egg | 305 (58%) | 199 (52%) |
| Peanut | 230 (44%) | 122 (32%) |
| Cow’s milk | 177 (34%) | 99 (26%) |
Furthermore, variants replicating with the same risk allele as the GOFA discovery set at nominal significance (P < 0.05) and not reaching the Bonferroni corrected P value in the GOFA replication set were confirmed in the Chicago Food Allergy Study (Supplementary Table 1) comprising 671 food allergic children, 144 non-allergic, non-sensitized normal controls, and 1382 controls of unknown phenotype (234 children and 1148 parents), all of European ancestry (Fig. 1)14.
Loci associated with food allergy
In the main analysis on any food allergy, two loci already showed association at genome-wide significance (P < 5 × 10⁻⁸) in the discovery set (Table 2, Fig. 2). The respective lead SNPs, rs12123821 on chromosome 1q21.3 (odds ratio (OR), 2.55; P = 8.4 × 10⁻¹⁰) and rs11949166 on 5q31.1 (OR, 0.60; P = 1.2 × 10⁻¹³), were also significantly associated with food allergy in the GOFA replication set after correction for the number of tests performed (for FA; n = 847, P < 5.9 × 10⁻⁵, Bonferroni correction). They replicated with the same risk alleles and with similar effect sizes (rs12123821; OR, 2.86; P = 6.1 × 10⁻⁷ and rs11949166; OR, 0.69; P = 3.0 × 10⁻⁵). Meta-analysis of the two sets yielded highly significant associations at 1q21.3 and 5q31.1 (rs12123821; OR, 2.65; P = 2.6 × 10⁻¹⁵ and rs11949166; OR, 0.63; P = 4.3 × 10⁻¹⁷).
Table 2.
Association of the identified susceptibility loci with different food allergies in the GOFA discovery and replication sets
| GOFA discovery set | GOFA replication set | Meta-analysis | |||||||||||
|---|---|---|---|---|---|---|---|---|---|---|---|---|---|
| SNP ID | Chr | Positiona | EA/AA | Trait | AF | OR | P value | AF | OR | P value | AF | OR | P value |
| rs12123821 | 1 | 152179152 | T/C | FA | 0.058 | 2.55 | 8.4 × 10 −10 | 0.060 | 2.86 | 6.1 × 10 −7 | 0.058 | 2.65 | 2.6 × 10 −15 |
| FLG-AS1 (intron_variant) | PN | 2.35 | 1.5 × 10⁻⁴ | 3.50 | 8.3 × 10⁻⁶ | 2.69 | 1.3 × 10⁻⁸ | ||||||
| HE | 2.67 | 7.0 × 10⁻⁸ | 2.89 | 1.7 × 10⁻⁵ | 2.74 | 5.4 × 10⁻¹² | |||||||
| CM | 3.59 | 2.4 × 10⁻⁹ | 3.24 | 4.1 × 10⁻⁴ | 3.49 | 5.2 × 10⁻¹² | |||||||
| rs11949166 | 5 | 132027681 | T/A | FA | 0.719 | 0.60 | 1.2 × 10 −13 | 0.696 | 0.69 | 3.0 × 10 −5 | 0.712 | 0.63 | 4.3 × 10 −17 |
| IL4/KIF3A (intergenic) | PN | 0.63 | 4.3 × 10⁻⁶ | 0.72 | 2.3 × 10⁻³ | 0.66 | 3.6 × 10⁻⁸ | ||||||
| HE | 0.60 | 2.0 × 10⁻⁹ | 0.66 | 1.9 × 10⁻⁴ | 0.62 | 2.2 × 10⁻¹² | |||||||
| CM | 0.64 | 1.9 × 10⁻⁵ | 0.79 | 0.054 | 0.68 | 4.6 × 10⁻⁶ | |||||||
| rs9273440 | 6 | 32627561 | C/T | FA | 0.706 | 0.98 | 0.053 | 0.707 | 0.75 | 0.088 | 0.706 | 0.89 | 0.010 |
| HLA-DQB1 (3-prime UTR variant) | PN | 0.66 | 6.6 × 10 −7 | 0.45 | 3.8 × 10 −6 | 0.58 | 1.7 × 10 −11 | ||||||
| HE | 1.35 | 0.61 | 0.90 | 0.65 | 1.17 | 0.90 | |||||||
| CM | 1.15 | 0.47 | 0.89 | 0.78 | 1.05 | 0.45 | |||||||
| rs2212434 | 11 | 76281593 | T/C | FA | 0.459 | 1.29 | 3.4 × 10 −4 | 0.477 | 1.47 | 8.2 × 10 −5 | 0.465 | 1.35 | 1.4 × 10 −7 |
| C11orf30/LRRC32 (intergenic_variant) | PN | 1.25 | 0.020 | 1.65 | 4.2 × 10⁻³ | 1.36 | 7.2 × 10⁻⁶ | ||||||
| HE | 1.37 | 2.3 × 10⁻⁴ | 1.43 | 0.012 | 1.39 | 8.8 × 10⁻⁶ | |||||||
| CM | 1.37 | 3.3 × 10⁻³ | 1.39 | 0.039 | 1.38 | 3.4 × 10⁻⁴ | |||||||
| rs12964116 | 18 | 61442619 | G/A | FA | 0.050 | 1.90 | 5.7 × 10 −6 | 0.051 | 1.69 | 9.4 × 10 −3 | 0.050 | 1.82 | 2.4 × 10 −7 |
| SERPINB7 (intron variant) | PN | 2.42 | 1.2 × 10⁻⁶ | 1.44 | 0.35 | 2.11 | 7.2 × 10⁻⁶ | ||||||
| HE | 1.48 | 0.032 | 1.82 | 0.019 | 1.60 | 1.7 × 10⁻³ | |||||||
| CM | 1.77 | 2.2 × 10⁻³ | 1.71 | 0.18 | 1.75 | 1.1 × 10⁻³ | |||||||
| rs1243064 | 18 | 61513975 | A/T | FA | 0.259 | 1.48 | 4.3 × 10⁻⁷ | 0.253 | 1.07 | 0.20 | 0.257 | 1.31 | 2.1 × 10⁻⁶ |
| SERPINB7/B2 (intergenic_variant) | PN | 1.49 | 4.6 × 10⁻⁵ | 1.07 | 0.38 | 1.34 | 1.4 × 10⁻⁴ | ||||||
| HE | 1.65 | 1.6 × 10 −7 | 1.21 | 0.028 | 1.47 | 4.2 × 10 −8 | |||||||
| CM | 1.80 | 9.8 × 10⁻⁷ | 1.03 | 0.36 | 1.51 | 7.5 × 10⁻⁶ | |||||||
AA alternative allele, AF effect allele frequency, CM cow’s milk, EA effect allele, FA food allergy, GOFA Genetics of Food Allergy Study, OR odds ratio, HE hen’s egg, PN peanut. Strongest association for each SNP is indicated in bold
aGenomic positions were based on human genome reference assembly GRCh37.p13
Variant rs12123821 at 1q21.3 is located within the epidermal differentiation complex (EDC) near the epidermal barrier gene filaggrin (FLG, Supplementary Fig. 2a) which was previously associated with PN allergy10. Since we identified LD between rs12123821 and a LOF mutation in FLG, c.2282del4 (r 2 = 0.19, Dʹ = 0.78), we evaluated whether the association signal at 1q21.3 was due to known FLG mutations. We included the two most common FLG LOF mutations in European populations, FLG c.2282del4 (tagged by rs12123821) and p.R501X (rs61816761) as covariates in the analysis which eliminated the highest association peaks within the EDC (Supplementary Table 2). While our results confirmed the role of FLG null mutations in food allergy, a residual association was still detectable between FLG and the repetin gene (RPTN; Supplementary Fig. 2b, Supplementary Table 2), which could point to additional genetic risk factors in this region.
FLG mutations are known to be strong risk factors for eczema19 which often co-occurs with food allergy4. In order to exclude that the observed association was due to an underlying association with eczema, we performed the association analysis in the subset of children without eczema (n = 152, Table 3). The effect of rs12123821 remained significant with similar effect size (OR 1.77; 95% CI 1.15–2.74; P = 0.0094), demonstrating an eczema-independent effect of FLG null mutations on food allergy. Finally, we investigated the effect of FLG null mutations on allergies to specific foods. While the association of FLG null mutations with PN allergy is well-documented10, we show that FLG mutations also confer risk for HE and CM allergy with similar and large effect sizes (Table 2).
Table 3.
Risk estimates for the identified food allergy loci dependent on the eczema status
| SNP ID | Chr | Cases (n) | Controls (n) | EA | AA | OR | 95% CI | P value |
|---|---|---|---|---|---|---|---|---|
| Food allergy, no eczema | ||||||||
| rs12123821 | 1 | 152 | 3373 | T | C | 1.77 | 1.15–2.74 | 9.4 × 10⁻³ |
| rs11949166 | 5 | 152 | 3373 | A | T | 1.61 | 1.27–2.04 | 8.9 × 10⁻⁵ |
| rs9273440 | 6 | 71 (PN) | 3373 | T | C | 1.67 | 1.19–2.35 | 3.2 × 10⁻³ |
| rs2212434 | 11 | 152 | 3373 | T | C | 1.14 | 0.90–1.44 | 0.29 |
| rs12964116 | 18 | 152 | 3373 | G | A | 2.26 | 1.49–3.43 | 1.3 × 10⁻⁴ |
| Food allergy plus eczema | ||||||||
| rs12123821 | 1 | 717 | 3373 | T | C | 2.13 | 1.74–2.62 | 5.6 × 10⁻¹⁵ |
| rs11949166 | 5 | 717 | 3373 | A | T | 1.69 | 1.50–1.91 | 2.4 × 10⁻¹⁷ |
| rs9273440 | 6 | 265 (PN) | 3373 | T | C | 1.64 | 1.36–1.97 | 2.0 × 10⁻⁷ |
| rs2212434 | 11 | 717 | 3373 | T | C | 1.40 | 1.25–1.58 | 1.9 × 10⁻⁸ |
| rs12964116 | 18 | 717 | 3373 | G | A | 1.78 | 1.41–2.25 | 1.2 × 10⁻⁶ |
AA alternative allele, AF effect allele frequency, CI confidence interval, EA effect allele, OR odds ratio, PN peanut allergy
On chromosome 5q31.1, the strongest association was observed for rs11949166 located between the interleukin 4 gene (IL4) and the kinesin family member 3a gene (KIF3A) within the cytokine gene cluster (Table 2). Variants spanning the whole 0.2 Mb region from IL5 to KIF3A were associated with food allergy at genome-wide significance (P < 5 × 10⁻⁸, Supplementary Fig. 3a). We tested whether LD within the cytokine gene cluster accounted for the multitude of associated SNPs or whether several independent signals were present. We identified two groups of SNPs covering IL5/RAD50 and IL4/KIF3A, which were significantly associated with food allergy (Supplementary Figs. 3a and 4a). There was high LD between the SNPs of each group, but low LD between SNPs of different groups. Mutual adjustment for the lead SNP of each group pointed to two independent signals (Supplementary Table 3, Supplementary Figs. 3b and 4b). Since this chromosomal region is a known eczema locus, we again stratified the association analysis for the eczema status and confirmed an eczema-independent effect of rs11949166 on food allergy with nearly identical effect sizes in the subgroups with eczema (OR, 1.69; 95% CI, 1.50–1.91) and without eczema (OR, 1.61; 95% CI, 1.27–2.04; Table 3).
Two novel susceptibility loci were identified at genome-wide significance after replication in the Chicago Food Allergy Study (Supplementary Table 1). The lead variant at 11q13.5, rs2212434 (Supplementary Fig. 5), was consistently associated with the same risk allele in all three study populations (Table 4). The same SNP was identified as the best associated variant at this locus in the largest eczema GWAS20 to date. The eczema-stratified analysis revealed a strong and significant effect (OR, 1.40; 95% CI, 1.25–1.58; P = 1.9 × 10⁻⁸) in the food allergy plus eczema group and a residual effect (OR, 1.14; 95% CI, 0.90–1.44; P = 0.29) that was, however, not significant in a small set of 152 food allergic children without eczema (Table 3).
Table 4.
Replication of C11orf30/LRRC32 (rs2212434) and the clade B serpins gene cluster (rs12964116 and rs1243064) in the Chicago Food Allergy Study
| SNP ID | EA/AA | Trait | GOFA discovery set | GOFA replication set | Chicago Food Allergy Study | Meta-analysis | ||||||
|---|---|---|---|---|---|---|---|---|---|---|---|---|
| AFcases | AFcontrols | P value | AFcases | AFcontrols | P value | AFcases | AFcontrols a | P value | P value | |||
| rs2212434 | T/C | FA | 0.511 | 0.448 | 3.4 × 10⁻⁴ | 0.540 | 0.451 | 8.2 × 10⁻⁵ | 0.512 | 0.469 | 1.4 × 10⁻⁴ | 9.2 × 10⁻¹¹ |
| HE | 0.528 | 0.448 | 2.3 × 10⁻⁴ | 0.525 | 0.451 | 0.012 | 0.492 | 0.471 | 0.24 | 1.3 × 10⁻⁵ | ||
| PN | 0.505 | 0.448 | 0.020 | 0.550 | 0.451 | 4.2 × 10⁻³ | 0.497 | 0.471 | 0.12 | 2.3 × 10⁻⁴ | ||
| CM | 0.530 | 0.448 | 3.3 × 10⁻³ | 0.530 | 0.451 | 0.039 | 0.514 | 0.469 | 9.8 × 10⁻³ | 1.3 × 10⁻⁵ | ||
| rs12964116 | G/A | FA | 0.080 | 0.043 | 5.7 × 10⁻⁶ | 0.069 | 0.044 | 9.4 × 10⁻³ | 0.061 | 0.050 | 0.010 | 1.8 × 10⁻⁸ |
| HE | 0.063 | 0.043 | 0.32 | 0.070 | 0.044 | 0.019 | 0.065 | 0.052 | 0.14 | 6.0 × 10⁻⁴ | ||
| PN | 0.095 | 0.043 | 1.2 × 10⁻⁶ | 0.058 | 0.044 | 0.35 | 0.084 | 0.050 | 5.8 × 10⁻⁶ | 1.9 × 10⁻¹⁰ | ||
| CM | 0.077 | 0.043 | 2.2 × 10⁻³ | 0.061 | 0.044 | 0.18 | 0.041 | 0.051 | 0.29 | 0.11 | ||
| rs1243064 | A/T | FA | 0.322 | 0.246 | 4.3 × 10⁻⁷ | 0.278 | 0.244 | 0.20 | 0.265 | 0.264 | 0.56 | 5.1 × 10⁻⁵ |
| HE | 0.343 | 0.246 | 1.6 × 10⁻⁷ | 0.306 | 0.244 | 0.028 | 0.288 | 0.262 | 0.15 | 8.0 × 10⁻⁸ | ||
| PN | 0.325 | 0.246 | 4.6 × 10⁻⁵ | 0.267 | 0.244 | 0.38 | 0.279 | 0.264 | 0.20 | 2.2 × 10⁻⁴ | ||
| CM | 0.358 | 0.246 | 9.8 × 10⁻⁷ | 0.280 | 0.244 | 0.36 | 0.244 | 0.261 | 0.31 | 0.013 | ||
AA alternative allele, AF effect allele frequency, CM cow’s milk, EA effect allele, FA food allergy, GOFA Genetics of Food Allergy Study, HE hen’s egg, PN peanut
a Controls of the Chicago Food Allergy Study include unaffected controls (n = 144) and controls of unknown phenotype (n = 1382). The AFs in both groups are presented in Supplementary Table 4
Another new susceptibility locus, which had not yet been linked to any allergic disease, was identified in chromosomal region 18q21.3 (Supplementary Fig. 6a). SNP rs12964116 located in intron 1 of SERPINB7 (serpin peptidase inhibitor, clade B, member 7) was associated with food allergy in the GOFA discovery set (OR, 1.9; P = 5.7 × 10⁻⁶, Table 2) and replicated with the same risk allele and a similar effect size in the GOFA replication set (OR, 1.69; P = 9.4 × 10⁻³). Since rs12964116 did not reach the Bonferroni corrected P value in the replication set (P < 5.9 × 10⁻⁵), we investigated the Chicago Food Allergy Study14 in order to confirm this locus. Again, the SNP was significantly associated with food allergy and with PN allergy (Table 4), reaching genome-wide significance for both phenotypes in the meta-analysis including all three studies (P = 1.8 × 10⁻⁸ for any food allergy and P = 1.9 × 10⁻¹⁰ for PN allergy). Within the SERPINB gene cluster, a second SNP (rs1243064) in moderate LD with rs12964116 (r 2 = 0.06, Dʹ = 0.71) was associated with food allergy (Supplementary Fig. 7a). In order to explore whether the two SNPs represented independent association signals we mutually conditioned on the two lead variants (Supplementary Table 5). In both cases, association of the other variant with food allergy decreased but was still present suggesting more than one risk haplotype at this locus (Supplementary Figs. 6b and 7b, Supplementary Table 5).
Association of rs1243064 was confirmed in the GOFA replication set for HE allergy at nominal significance, reaching genome-wide significance in the meta-analysis of GOFA discovery and replication set (P = 4.2 × 10⁻⁸, Table 2). In the Chicago Food Allergy Study the same risk allele was identified (Table 4). However, association did not reach significance (P = 0.15) which may be due to reduced power in a small sample with a less stringent phenotype definition that was not based on OFCs. Overall, association at the serpin locus was consistent and strong for any food allergy, PN, and HE allergy.
To better understand the potential functional basis of the novel food allergy locus, we used LDLink21 to identify all variants within the SERPINB gene cluster which are in high LD (r 2 > 0.8) with the two lead SNPs, rs12964116 and rs1243064. None of the identified candidate SNPs altered any protein sequences as predicted by the ENSEMBL variant effect predictor (Supplementary Table 6)22. We therefore evaluated their association with gene expression in expression databases including the Genotype-Expression database (GTEx, version V6p), and reviewed their functional annotations in the ENCODE Consortium (http://genome.ucsc.edu/ENCODE/)23.
rs12964116 is located in an intron of SERPINB7 in a binding site for several members of the transcription factor activator protein (AP)-1 complex, which is involved in diverse cellular processes including cell growth and differentiation (Supplementary Table 6). In chromatin immunoprecipitation (ChIP)-seq experiments this site has also been shown to bind the transcription factor CCAAT/enhancer-binding protein beta (CEBPB)24 which regulates the expression of genes involved in immune and inflammatory responses, including cytokines interleukin-6, interleukin-4, interleukin-5, and TNF-alpha, as well as signal transducer and activator of transcription 3 (STAT3) which mediates the transcriptional activation in response to multiple cytokines and growth factors. The other lead SNP, rs1243064, is a tissue-specific expression quantitative trait locus (eQTL), with the risk allele rs1243064A being negatively correlated with SERPINB10 expression in whole blood (Supplementary Table 6).
We then used LD score regression analysis in order to quantify the liability-scale heritability of food allergy that was explained by the lead variants identified in our study. Altogether, the food allergy susceptibility loci identified in this study explained ∼10.2% of the variance in liability (Supplementary Table 7).
Loci associated with allergy to specific foods
Association results within the HLA region at 6p21 (Supplementary Fig. 8a) confirmed a previously reported locus for PN allergy14. We found LD (r 2 = 0.48, Dʹ = 0.85) between rs9273440, which was strongly associated with PN allergy in the discovery and in the replication set (Table 2), and rs9275596, which was the lead SNP in the previous GWAS14. Although several SNPs reached the selection threshold (P < 1 × 10⁻³) in the discovery set, conditioning on rs9273440 eliminated all association signals within the region (Supplementary Fig. 8b), pointing to a single signal at this locus. Notably, children with HE or CM allergy did not contribute to the association with rs9273440 (Table 2) demonstrating a PN-specific locus.
In the analysis of HE allergy, 896 candidate variants were identified in the discovery set (Supplementary Data 1b). Apart from the susceptibility loci for any food allergy at 1q21.3 and 5q31.1 (Table 2), two additional SNPs were significantly associated in the GOFA replication set and selected for replication in the Chicago Food Allergy Study in which neither SNP reached significance (Supplementary Table 1). In the analysis of CM allergy, 845 SNPs were selected for replication (Supplementary Data 1d). One candidate SNP specific for CM allergy (rs73908987) replicated in the GOFA replication set (Supplementary Table 1) reaching 6.0 × 10⁻⁷ in the meta-analysis of the two GOFA sets. Unfortunately, there were no data or proxy SNPs (r 2 > 0.8) available for this variant in the Chicago Food Allergy Study.
Discussion
Here we report a GWAS on OFC-proven food allergy which stratified the results for the three most common food allergens. We identified five loci at genome-wide significance including the SERPINB gene cluster at 18q21.3 which was not previously linked to any allergic disease. We demonstrated that the association of FLG at 1q21.3, the cytokine gene cluster at 5q31.1, the C11orf30/LRRC32 region on chromosome 11q13.5, and the SERPINB gene cluster with food allergy was independent of the allergen whereas the HLA locus at 6p21 was clearly identified as a PN allergy-specific susceptibility locus. Moreover, we showed that the effect on food allergy was independent of eczema for 4 out of 5 susceptibility loci.
Two recent GWAS focussed on PN allergy. The Chicago Food Allergy Study defined cases based on a reported history of food allergy in combination with elevated specific IgE against the same food and confirmed a previous association of the HLA region with PN allergy14. The HLA association with PN allergy was also confirmed in the HealthNuts Study. In the latter report, PN allergy was diagnosed by OFC but results did not reach genome-wide significance, likely due to the small sample size (73 cases and 148 controls)25. In the present study, the strongest association at 6p21 was observed for rs9273440 located in the 3ʹ-untranslated region (UTR) of HLA-DQB1. This marker was in LD with the two variants reported by Hong et al.14, rs9275596 (r 2 = 0.48, Dʹ = 0.85) and rs7192 (r 2 = 0.25, Dʹ = 0.69). The functional investigation revealed high LD with a missense variant in HLD-DQB1. Although this variant is located in a highly conserved region there is no additional evidence for a disease-causing role. Our study design enabled us to investigate the effect of HLA markers on food-specific allergies. Clearly, the lead SNP in the HLA region, rs9273440, was only associated with PN allergy and not with HE or CM allergy.
A strong association with food allergy, reaching genome-wide significance already in the discovery stage, was found in the EDC on chromosome 1. We showed that this association was attributable to null mutations in the filaggrin gene which encodes an epidermal barrier protein. Filaggrin null mutations are strong risk factors for eczema and eczema-associated asthma or allergic rhinitis19, 26, 27. In addition, an association of FLG mutations with PN allergy has previously been reported10. Here, we demonstrate that FLG mutations have an effect on food allergy regardless of the causing allergen with consistently large effect sizes for HE, PN, and CM (Table 2). Furthermore, and in contrast to a previous study that reported an association of FLG mutations with food allergy only in the context of eczema28, our large study population enabled us to compare the FLG effect between food allergic children with and without eczema. Although the effect size in children with eczema was moderately larger (OR = 2.13, 95% CI 1.74–2.62), we clearly observed a significant, strong effect of FLG mutations on food allergy in the absence of eczema (OR 1.77, 95% CI 1.15–2.74). This finding is distinct from asthma for which a FLG effect was only detectable in the presence of eczema19, 26, 27. Interestingly, filaggrin is expressed in the oral and esophageal mucosa, but not in airway epithelia29, 30. While in eczema-associated asthma allergic sensitization through the defective skin barrier seems to play a pivotal role in disease development, in food allergy, enhanced penetration of allergens may occur through a leaky epithelial barrier in the upper gastrointestinal tract independently of the skin. A recent study suggested a link between downregulation of filaggrin in the esophageal mucosa and impairment of the corresponding epithelial barrier30.
Association with food allergy was also observed within the cytokine gene cluster on chromosome 5q31.1, spanning the whole region from IL5 to KIF3A. This region has previously been linked to a number of inflammatory and immune-related diseases including Crohn’s disease31, psoriasis32, and eczema33. Since food allergy is often associated with eczema, we demonstrated that the observed association was independent of eczema. In both subgroups, food allergic children with and without eczema, rs11949166 showed highly significant association with nearly identical effect sizes. The lead SNP at this locus, rs11949166, was located between IL4 and KIF3A. Using conditional analysis we clearly identify a second independent association signal in the RAD50/IL13 region which also contains the well-known coding IL13 variant (IL-13 R130Q) involved in allergic disease34. Recent studies provided evidence that IL-4/IL-13 pathways play an important role in food allergy. Mouse models have demonstrated that IL-4 and IL-13 production by group 2 innate lymphoid cells (ILC2s) blocked the generation of mucosal allergen-specific regulatory T cells and promoted food allergy35.
The C11orf30/LRRC32 region is a known risk locus for eczema36, asthma37, 38, and other inflammatory diseases such as inflammatory bowel disease39. The lead SNP rs2212434 has previously been identified in the largest meta-GWAS on eczema, in which the odds ratio was 1.09 (95% CI, 1.07–1.12)20. For food allergy, we estimated an OR of 1.35 (95% CI, 1.20–1.51) which was even higher when considering the combined food allergy plus eczema phenotype (OR, 1.40; 95% CI, 1.25–1.58). Since C11orf30/LRRC32 was also strongly associated with the atopic march (rs2155219, OR, 1.33; 95% CI, 1.24–1.43)40, our results support a key role of this locus in the development of multiple allergic disorders including food allergy.
Importantly, we report a novel, genome-wide significant association of food allergy with the SERPINB gene cluster on chromosome 18q21.3. Two SNPs in moderate LD were found to be associated with disease. One lead SNP, rs12964116, is located in an intron of SERPINB7 which belongs to the serine protease inhibitor (serpin) superfamily. SERPINB7 shows a very specific expression pattern. It is highly expressed in the upper layers of the epidermis. Loss-of-function mutations in SERPINB7 cause “Nagashima-type” palmoplantar keratosis (NPPK), an autosomal recessive hyperkeratosis of the palms and soles which is associated with skin barrier deficiency41. Apart from the skin, SERPINB7 is expressed in few other organs lined by stratified squamous epithelia including the esophagus (Supplementary Table 8). Its expression there suggests a potential role in the epithelial integrity and function of the upper digestive tract that may be relevant to the development of food allergy. rs12964116 alters a binding site for several transcription factors, including CEBPB and STAT3. CEBPB regulates the expression of genes involved in allergic inflammation, including the Th2 cell (type 2 helper T cells) effector cytokines interleukin-1342, interleukin-4,43 and interleukin-544, and also promotes mucosal immunity in a mouse model of oropharyngeal candidiasis45. Furthermore, transcription factor STAT3 binds to this locus which is required for Th2 cell development in a mouse model of allergic inflammation46. The other lead SNP, rs1243064, is a tissue-specific eQTL, with the risk allele rs1243064A being negatively correlated with the expression of SERPINB10 in whole blood. SERPINB10 is expressed in leukocytes, blood, esophagus, and skin, but little is known about its function.
Although the functional data point to SERPINB7 and SERPINB10, other SERPINB genes also represent good candidates as they constitute a tightly linked gene cluster on chromosome 18. Clade B serpins are involved in several biological functions including protease inhibition, tumor suppression, regulation of apoptosis and inflammation. Of note, many clade B serpins have very restricted expression patterns with high expression levels in the esophageal mucosa (Supplementary Table 8).
SerpinB3 and serpinB4 were upregulated in affected skin of eczema patients and in the airway epithelia of patients with allergic asthma, induced via a pathway involving the Th2 cytokines IL-4 and IL-1347–49. In a mouse model, allergen exposure induced Serpinb3a expression in the epidermis which promoted barrier dysfunction and skin inflammation50. In contrast, Serpinb2 had a protective effect on the skin barrier; a knockout mouse revealed loss of stratum corneum integrity and reduced barrier function51. SerpinB2 was upregulated in airway epithelial cells from asthmatic patients52 and upon allergen challenge53. After enteric nematode infection, IL-4 and IL-13 induced SERPINB2 expression in the intestinal mucosa where it affects diverse immunological processes; serpinB2 protects macrophages from apoptosis and is involved in the regulation of cytokines54. Functional studies will be required to gain a better understanding of the physiological role of clade B serpins in food allergy.
We estimated the FA heritability from our GWAS summary statistics to be 24.4%. This is in contrast to previous estimates from twin studies which yielded estimates around 80%. Similar discrepancies have been reported for other complex diseases55. The difference between the heritability estimates from GWAS and from pedigree or twin studies may be due to an underestimation of the contribution of common environmental factors in twin studies, gene-environment interactions or model misspecification56. The five lead variants of the food allergy susceptibility loci identified in this study explained 10.2% of the heritability.
Some limitations of our study need to be discussed. Although we performed the largest GWAS on food allergy to date, the sample size was relatively small for a GWAS on a complex genetic trait. This was due to the strict phenotype definition used in our study. Though recommended in current guidelines3, 15, OFCs are not always performed as the diagnostic standard method. As a consequence for challenge-proven food allergy, large numbers of patients are difficult to obtain. This study was powered to detect loci of relatively large effect sizes. While the combined GOFA set had a power of 99% to detect a risk variant with an OR of 1.6 (using an allelic model with 5% prevalence, 20% risk allele frequency, and alpha <5 × 10⁻⁸)57, the power dropped to 10% for variants with a moderate OR of 1.3. Additional studies in larger samples will be required to evaluate variants with low effect sizes.
In the context of limited study power, the finding of allergen-specific associations should be interpreted cautiously since the lack of association between an allergen-specific SNP and other FAs may be due to limited sample size of the subgroups. Likewise, our assessment of association with FA in the context of eczema was affected by sample size. In particular in the relatively small subset of patients without eczema (n = 152), a moderate SNP effect might not be detected. Accordingly, the effect of C11orf30/LRRC32 on food allergy in the absence of eczema (OR, 1.14; 95% CI, 0.90–1.44, p = 0.29) might become significant, if larger study populations are analyzed. In contrast to the well phenotyped cases included in this study, there was no reliable information on food allergy available for the controls. Therefore, the presence of affected individuals among controls may have decreased the power of our study. Given a food allergy prevalence of about 5% in Western Europe, the loss of power was probably minor.
In summary, the identification of five food allergy susceptibility loci demonstrates that a strict phenotype definition, as set forth by recent medical guidelines on food allergy, is important for studies on the genetics of food allergy. The discovery of the SERPINB gene cluster in food allergy susceptibility emphasizes the importance of proteolytic pathways in the regulation of the immune response and in the maintenance of the epithelial barrier, both of which are impaired in food allergy.
Methods
Study populations and study design
Children of the GOFA were recruited at clinical centers in Berlin, Wangen, Hannover, and Oldenburg, Germany. In total, 523 food allergic children were recruited for the GOFA discovery phase. Apart from any FA, we investigated the three most common food allergies against HE, PN, and CM. In total, 2682 German control individuals without information on food allergy originated from the HNR. HNR is a population-based cohort study for cardiovascular disease16 comprising 4800 individuals from Ruhr area in Germany. The GOFA replication set comprised another 380 children with food allergy and 986 unphenotyped control individuals from the SHIP, a population-based cohort from North-Eastern Germany18. The second replication set, the Chicago Food Allergy Study, has previously been described in detail14. This study included 671 food allergic children of European ancestry of whom 316, 291, and 217 were allergic against PN, CM, and HE, respectively. In total, 144 non-allergic non-sensitized normal controls and 1382 individuals of unknown phenotype (234 children and 1148 parents) served as controls. This study has been approved by the ethics committees of Charité Universitätsmedizin Berlin, Hannover Medical School, and the Medical Associations of Berlin and Baden-Wurttemberg. The study protocol of the Chicago Food Allergy Study was approved by the Institutional Review Board of Ann and Robert H. Lurie Children’s Hospital of Chicago and the Institutional Review Board of Johns Hopkins Bloomberg School of Public Health. Written informed consent has been given by all participants or their legal guardians.
For each phenotype under study (FA, HE, PN, and CM), all SNPs with moderate association in the discovery set (P < 1 × 10⁻³) were identified (FA 7699 SNPs, HE 8959 SNPs, PN 6794 SNPs, and CM 6955 SNPs). To define a locus, we grouped all consecutive SNPs with P < 1 × 10⁻³ and a distance <1 Mb to the next SNP (FA 611 loci, HE 634 loci, PN 595 loci, and CM 612 loci). At each locus, we selected the SNP with the lowest P value as lead SNP. To identify additional, independent association signals within each locus, we identified all SNPs in low LD with the lead SNP (r 2 < 0.2) and again selected the best SNP. Thus the number of additional LD-selected SNPs was 236, 262, 223, and 233 SNPs, and the total number of candidate SNPs selected in the GOFA discovery set were 847, 896, 818, and 845 for the phenotypes FA, HE, PN, and CM, respectively.
In the GOFA replication set, significant association was defined as an association with the same risk allele as in the discovery set at the Bonferroni corrected P value (0.05/number of SNPs tested for a given phenotype). The Bonferroni corrected significance thresholds were P < 5.9 × 10⁻⁵ for any FA, P < 5.6 × 10⁻⁵ for HE, P < 6.1 × 10⁻⁵ for PN, and P < 5.9 × 10⁻⁵ for CM. The threshold for genome-wide significance was P < 5 × 10⁻⁸ in the meta-analysis (Fig. 1).
Variants replicating at nominal significance (P < 0.05) in the GOFA replication set and yielding a P < 10−6 in the meta-analysis of GOFA discovery and GOFA replication, but not reaching the Bonferroni corrected P value, were additionally confirmed in the Chicago Food Allergy Study.
Diagnostic criteria for food allergy
According to the current guidelines, food allergy was diagnosed based on OFC (n = 775), most of which (n = 650, 83.9%) were conducted in a double-blind placebo controlled setting. Children with a convincing history of an immediate, severe allergic reaction plus specific sensitization to the same food (IgE > 0.35 kU l−1) were included as cases without further challenge (n = 127), as OFC is contraindicated due to the risk of severe allergic reaction.
OFCs were performed in an inpatient hospital setting under physicians’ supervision. Only one food or placebo was investigated per 24 h period and was administered in seven escalating doses at 30 min intervals. Consistent with PRACTALL guidelines, food challenges were scored as positive if objective cutaneous, gastrointestinal, respiratory or cardiovascular reactions attributable to the allergen, but not to placebo were observed15.
Diagnostic criteria for eczema
A physician’s diagnosis of eczema was made according to standard criteria in the presence of a chronic or chronically relapsing pruritic dermatitis with the typical morphology and distribution58, 59. More detailed information on eczema onset in the GOFA study sets is provided in Supplementary Note 1.
Genotyping and quality control
Samples were genotyped on Illumina’s HumanOmniExpressExome-8 v1.2, HumanOmniExpress-12 v1.0, or HumanOmni1-Quad v1 (Supplementary Table 9). For the discovery and the replication set, the same QC criteria were applied. Individuals with a call rate <0.97 or with high heterozygosity (>0.35) were excluded. Individual SNPs were filtered according to the following criteria: (i) low call rate (<0.96 in cases or controls), (ii) low MAF <0.005 in cases or controls), (iii) genotypes out of Hardy–Weinberg equilibrium (HWE, P < 0.00001 in cases or P < 0.0001 in controls). SNPs with a call rate lower than 0.99 were excluded if having a MAF < 0.05 or if they were out of HWE (P < 0.001). Only SNPs fulfilling the above mentioned QC were used in subsequent steps. Genotypes of cases and controls were recoded to the “+” strand using the –flip command in PLINK60. Furthermore markers were deleted if allele frequencies in the HNR control population differed by more than 0.15 compared with the frequency in 379 Europeans available from the 1000 Genomes project. After quality control, the GOFA discovery and GOFA replication sets included 497 (before QC 523) and 379 (before QC 380) cases as well as 2387 (before QC 2682) and 984 (before QC 986) 1526 controls, respectively.
Imputation
Genotype imputation was performed separately for the discovery and the replication set on the Michigan Imputation Server (https://imputationserver.sph.umich.edu/index.html)61 using the updated Haplotype Reference Consortium (version r1.1) panel17. Since genotyping was performed on different Illumina SNP arrays, we used only those SNPs for imputation which were genotyped on all arrays of a data set62. Cleaned SNP data were converted into vcf format and uploaded on the imputation server. For phasing SHAPEIT v2 was used63, imputation was done with minimac3. After downloading the imputed data, we performed additional filtering steps; in both sets, we excluded SNPs with poor imputation quality (r 2 < 0.5), low allele frequency (MAF<5%), and deviation from HWE (P < 10−12, in controls).
Statistical analyses
Association analysis and population stratification control was performed using FaST-LMM (v2.07) with imputed genotype dosages64. For each chromosome, a relationship matrix was computed using all autosomal, genotyped SNPs except those on the chromosome being analyzed. For conditional analyses, allele dosages of the corresponding SNPs were included as covariates. Odds ratios were obtained from association analysis with Mach2dat using logistic regression with sex and the first seven principal components as covariates. Association of the lead SNPs with food allergy dependent on the eczema status was calculated by logistic regression with PLINK60 using sex as covariate. The genomic inflation factor was calculated for each trait under study. P values were meta-analyzed with METAL using the weighted Z-score method taking into account the sample size and the effect direction65. LD between SNPs in the control population of set 1 was calculated with PLINK60. Association analysis of the Chicago Food Allergy Study was performed using the modified quasi-likelihood score test under an additive genetic model.
Functional annotation
To identify potential functional variants within the food allergy loci, we used LD link21 to identify all SNPs in high LD (r 2 > 0.8) with the lead SNPs. We subsequently used the Ensembl variant effect predictor22, and the Genotype-Expression database (GTEx, V6p)66 to review their functional annotations with respect to potential impact on protein structure, regulatory elements, tissue-specific gene expression, and transcription factor binding.
To detect associations of the food allergy loci with gene expression levels, we used the single nucleotide polymorphism annotator67 tool to query publically available databases on expression quantitative trait loci (eQTL) in relevant tissues. If a SNP was associated with the expression of a gene in a tissue, we identified all independent eQTLs for that gene/tissue pair. To this end, we selected the best eQTL of the gene/tissue pair, then used LD link21 to identify all eQTLs in low LD (r 2 < 0.05) with the best SNP, and again selected the best SNP. This procedure was performed iteratively to create a list of independent eQTLs for the gene/tissue pair. To reduce the number of spurious co-localizations, we only report variants in high LD with the FA lead variants that represented an independent eQTLs for the respective gene/tissue pair. Fine mapping and functional assessment of the cytokine gene cluster at 5q31.1 and the HLA region at 6p21 were performed in detail previously14, 68,therefore, we only report proxy SNPs if they were predicted to have a “high” or “moderate” impact on the functionality of the resulting protein by the Ensembl Variant Effect Predictor22. The lead SNP at 1q21 (FLG) was excluded, since we demonstrate that the signal was due to LD with the known loss-of-function variants in FLG.
Estimating the heritability explained by the identified loci
The overall SNP-based heritability was estimated with LD score regression69. From the GWAS results on food allergy, we used a subset of 1.2 million HapMap SNPs. In order to quantify the heritability on the liability-scale the population prevalence was set to 5%. We then adjusted the GWAS results for the effects of the five lead variants (rs12123821 on chr. 1, rs11949166 on chr. 5, rs9273440 on chr. 6, rs2212434 on chr. 11, and rs12964116 on chr. 18) identified in our study. Again, we estimated the SNP-based heritability using the adjusted GWAS results. The heritability explained by the identified lead SNPs was calculated as the difference between the unadjusted heritability and the adjusted heritability.
Data availability
The data that support the findings of this study are included in Supplementary Data 1a–d. Additional information is available from the corresponding author upon reasonable request.
Electronic supplementary material
Description of Additional Supplementary Files
Acknowledgements
We thank Christina Flachmeier, Theresa Thuß for excellent technical assistance, and Sylke Rietz and Marieke Hillen for sample collection and data management. SHIP is part of the Community Medicine Research net of the University of Greifswald, Germany, which is funded by the Federal Ministry of Education and Research (grant nos. 01ZZ9603, 01ZZ0103, and 01ZZ0403), the Ministry of Cultural Affairs as well as the Social Ministry of the Federal State of Mecklenburg-West Pomerania, and the network ‘Greifswald Approach to Individualized Medicine (GANI_MED) funded by the Federal Ministry of Education and Research (grant 03IS2061A). Genome-wide data have been supported by the Federal Ministry of Education and Research (grant no. 03ZIK012).
Author contributions
Y.-A.L. and K.Be. directed the study. B.K., K.Bl., R.S., N.Ha., M.P., G.H., J.S., H.R., S.Y., S.T., B.N., K.Be. and Y.-A.L. evaluated patients, collected samples, and contributed clinical data. G.H., C.O.S. and M.M.N. contributed control samples and genotypes. I.M., S.G., M.M.N., N.H. and Y.-A.L. contributed experimental data. I.M., S.G., F.R., X.H. and X.W. performed data analyses. I.M., S.G. and Y.-A.L. drafted the manuscript, all authors reviewed, revised, and approved the final manuscript.
Competing interests
The authors declare no competing financial interests.
Footnotes
Ingo Marenholz and Sarah Grosche contributed equally to this work.
Kirsten Beyer and Young-Ae Lee jointly supervised this work.
Electronic supplementary material
Supplementary Information accompanies this paper at 10.1038/s41467-017-01220-0.
Publisher's note: Springer Nature remains neutral with regard to jurisdictional claims in published maps and institutional affiliations.
References
- 1.Osborne NJ, et al. Prevalence of challenge-proven IgE-mediated food allergy using population-based sampling and predetermined challenge criteria in infants. J. Allergy Clin. Immunol. 2011;127:668–676. doi: 10.1016/j.jaci.2011.01.039. [DOI] [PubMed] [Google Scholar]
- 2.Tang ML, Mullins RJ. Food allergy: is prevalence increasing? Intern. Med. J. 2017;47:256–261. doi: 10.1111/imj.13362. [DOI] [PubMed] [Google Scholar]
- 3.Muraro A, et al. EAACI food allergy and anaphylaxis guidelines: diagnosis and management of food allergy. Allergy. 2014;69:1008–1025. doi: 10.1111/all.12429. [DOI] [PubMed] [Google Scholar]
- 4.Nwaru BI, et al. Prevalence of common food allergies in Europe: a systematic review and meta-analysis. Allergy. 2014;69:992–1007. doi: 10.1111/all.12423. [DOI] [PubMed] [Google Scholar]
- 5.Grabenhenrich LB, et al. Anaphylaxis in children and adolescents: The European Anaphylaxis Registry. J. Allergy Clin. Immunol. 2016;137:1128–1137. doi: 10.1016/j.jaci.2015.11.015. [DOI] [PubMed] [Google Scholar]
- 6.Panesar SS, et al. The epidemiology of anaphylaxis in Europe: a systematic review. Allergy. 2013;68:1353–1361. doi: 10.1111/all.12272. [DOI] [PubMed] [Google Scholar]
- 7.Braganza SC, Acworth JP, McKinnon DR, Peake JE, Brown AF. Paediatric emergency department anaphylaxis: different patterns from adults. Arch. Dis. Child. 2006;91:159–163. doi: 10.1136/adc.2004.069914. [DOI] [PMC free article] [PubMed] [Google Scholar]
- 8.Sicherer SH, et al. Genetics of peanut allergy: a twin study. J. Allergy Clin. Immunol. 2000;106:53–56. doi: 10.1067/mai.2000.108105. [DOI] [PubMed] [Google Scholar]
- 9.Ullemar V, et al. Heritability and confirmation of genetic association studies for childhood asthma in twins. Allergy. 2016;71:230–238. doi: 10.1111/all.12783. [DOI] [PubMed] [Google Scholar]
- 10.Brown SJ, et al. Loss-of-function variants in the filaggrin gene are a significant risk factor for peanut allergy. J. Allergy Clin. Immunol. 2011;127:661–667. doi: 10.1016/j.jaci.2011.01.031. [DOI] [PMC free article] [PubMed] [Google Scholar]
- 11.Howell WM, Turner SJ, Hourihane JO, Dean TP, Warner JO. HLA class II DRB1, DQB1 and DPB1 genotypic associations with peanut allergy: evidence from a family-based and case-control study. Clin. Exp. Allergy. 1998;28:156–162. doi: 10.1046/j.1365-2222.1998.00224.x. [DOI] [PubMed] [Google Scholar]
- 12.Hand S, et al. Human leucocyte antigen polymorphisms in nut-allergic patients in South Wales. Clin. Exp. Allergy. 2004;34:720–724. doi: 10.1111/j.1365-2222.2004.1932.x. [DOI] [PubMed] [Google Scholar]
- 13.Madore AM, et al. HLA-DQB1*02 and DQB1*06:03P are associated with peanut allergy. Eur. J. Hum. Genet. 2013;21:1181–1184. doi: 10.1038/ejhg.2013.13. [DOI] [PMC free article] [PubMed] [Google Scholar]
- 14.Hong X, et al. Genome-wide association study identifies peanut allergy-specific loci and evidence of epigenetic mediation in US children. Nat. Commun. 2015;6:6304. doi: 10.1038/ncomms7304. [DOI] [PMC free article] [PubMed] [Google Scholar]
- 15.Sampson HA, et al. Standardizing double-blind, placebo-controlled oral food challenges: American academy of allergy, asthma & immunology-European academy of allergy and clinical immunology PRACTALL consensus report. J. Allergy Clin. Immunol. 2012;130:1260–1274. doi: 10.1016/j.jaci.2012.10.017. [DOI] [PubMed] [Google Scholar]
- 16.Schmermund A, et al. Assessment of clinically silent atherosclerotic disease and established and novel risk factors for predicting myocardial infarction and cardiac death in healthy middle-aged subjects: rationale and design of the Heinz Nixdorf RECALL Study. Risk Factors, evaluation of coronary calcium and lifestyle. Am. Heart J. 2002;144:212–218. doi: 10.1067/mhj.2002.123579. [DOI] [PubMed] [Google Scholar]
- 17.McCarthy S, et al. A reference panel of 64,976 haplotypes for genotype imputation. Nat. Genet. 2016;48:1279–1283. doi: 10.1038/ng.3643. [DOI] [PMC free article] [PubMed] [Google Scholar]
- 18.Volzke H, et al. Cohort profile: the study of health in Pomerania. Int. J. Epidemiol. 2011;40:294–307. doi: 10.1093/ije/dyp394. [DOI] [PubMed] [Google Scholar]
- 19.Palmer CN, et al. Common loss-of-function variants of the epidermal barrier protein filaggrin are a major predisposing factor for atopic dermatitis. Nat. Genet. 2006;38:441–446. doi: 10.1038/ng1767. [DOI] [PubMed] [Google Scholar]
- 20.Paternoster L, et al. Multi-ancestry genome-wide association study of 21,000 cases and 95,000 controls identifies new risk loci for atopic dermatitis. Nat. Genet. 2015;47:1449–1456. doi: 10.1038/ng.3424. [DOI] [PMC free article] [PubMed] [Google Scholar]
- 21.Machiela MJ, Chanock SJ. LDlink: a web-based application for exploring population-specific haplotype structure and linking correlated alleles of possible functional variants. Bioinformatics. 2015;31:3555–3557. doi: 10.1093/bioinformatics/btv402. [DOI] [PMC free article] [PubMed] [Google Scholar]
- 22.McLaren W, et al. The Ensembl variant effect predictor. Genome Biol. 2016;17:122. doi: 10.1186/s13059-016-0974-4. [DOI] [PMC free article] [PubMed] [Google Scholar]
- 23.Goi C, Little P, Xie C. Cell-type and transcription factor specific enrichment of transcriptional cofactor motifs in ENCODE ChIP-seq data. BMC Genom. 2013;14:S2. doi: 10.1186/1471-2164-14-S5-S2. [DOI] [PMC free article] [PubMed] [Google Scholar]
- 24.Ward LD, Kellis M. HaploReg: a resource for exploring chromatin states, conservation, and regulatory motif alterations within sets of genetically linked variants. Nucl. Acids Res. 2012;40:D930–D934. doi: 10.1093/nar/gkr917. [DOI] [PMC free article] [PubMed] [Google Scholar]
- 25.Martino DJ, et al. Genomewide association study of peanut allergy reproduces association with amino acid polymorphisms in HLA-DRB1. Clin. Exp. Allergy. 2017;47:217–223. doi: 10.1111/cea.12863. [DOI] [PubMed] [Google Scholar]
- 26.Marenholz I, et al. Filaggrin loss-of-function mutations predispose to phenotypes involved in the atopic march. J. Allergy Clin. Immunol. 2006;118:866–871. doi: 10.1016/j.jaci.2006.07.026. [DOI] [PubMed] [Google Scholar]
- 27.van den Oord RA, Sheikh A. Filaggrin gene defects and risk of developing allergic sensitisation and allergic disorders: systematic review and meta-analysis. BMJ. 2009;339:b2433. doi: 10.1136/bmj.b2433. [DOI] [PMC free article] [PubMed] [Google Scholar]
- 28.Venkataraman D, et al. Filaggrin loss-of-function mutations are associated with food allergy in childhood and adolescence. J. Allergy Clin. Immunol. 2014;134:876–882. doi: 10.1016/j.jaci.2014.07.033. [DOI] [PMC free article] [PubMed] [Google Scholar]
- 29.Smith SA, Dale BA. Immunologic localization of filaggrin in human oral epithelia and correlation with keratinization. J. Invest. Dermatol. 1986;86:168–172. doi: 10.1111/1523-1747.ep12284213. [DOI] [PubMed] [Google Scholar]
- 30.Simon D, Radonjic-Hosli S, Straumann A, Yousefi S, Simon HU. Active eosinophilic esophagitis is characterized by epithelial barrier defects and eosinophil extracellular trap formation. Allergy. 2015;70:443–452. doi: 10.1111/all.12570. [DOI] [PubMed] [Google Scholar]
- 31.Jostins L, et al. Host-microbe interactions have shaped the genetic architecture of inflammatory bowel disease. Nature. 2012;491:119–124. doi: 10.1038/nature11582. [DOI] [PMC free article] [PubMed] [Google Scholar]
- 32.Nair RP, et al. Genome-wide scan reveals association of psoriasis with IL-23 and NF-kappaB pathways. Nat. Genet. 2009;41:199–204. doi: 10.1038/ng.311. [DOI] [PMC free article] [PubMed] [Google Scholar]
- 33.Paternoster L, et al. Meta-analysis of genome-wide association studies identifies three new risk loci for atopic dermatitis. Nat. Genet. 2011;44:187–192. doi: 10.1038/ng.1017. [DOI] [PMC free article] [PubMed] [Google Scholar]
- 34.Vladich FD, et al. IL-13 R130Q, a common variant associated with allergy and asthma, enhances effector mechanisms essential for human allergic inflammation. J. Clin. Invest. 2005;115:747–754. doi: 10.1172/JCI200522818. [DOI] [PMC free article] [PubMed] [Google Scholar]
- 35.Noval Rivas M, et al. Regulatory T cell reprogramming toward a Th2-cell-like lineage impairs oral tolerance and promotes food allergy. Immunity. 2015;42:512–523. doi: 10.1016/j.immuni.2015.02.004. [DOI] [PMC free article] [PubMed] [Google Scholar]
- 36.Esparza-Gordillo J, et al. A common variant on chromosome 11q13 is associated with atopic dermatitis. Nat. Genet. 2009;41:596–601. doi: 10.1038/ng.347. [DOI] [PubMed] [Google Scholar]
- 37.Marenholz I, et al. The eczema risk variant on chromosome 11q13 (rs7927894) in the population-based ALSPAC cohort: a novel susceptibility factor for asthma and hay fever. Hum. Mol. Genet. 2011;20:2443–2449. doi: 10.1093/hmg/ddr117. [DOI] [PubMed] [Google Scholar]
- 38.Ferreira MA, et al. Identification of IL6R and chromosome 11q13.5 as risk loci for asthma. Lancet. 2011;378:1006–1014. doi: 10.1016/S0140-6736(11)60874-X. [DOI] [PMC free article] [PubMed] [Google Scholar]
- 39.Welter D, et al. The NHGRI GWAS catalog, a curated resource of SNP-trait associations. Nucl. Acids Res. 2014;42:D1001–D1006. doi: 10.1093/nar/gkt1229. [DOI] [PMC free article] [PubMed] [Google Scholar]
- 40.Marenholz I, et al. Meta-analysis identifies seven susceptibility loci involved in the atopic march. Nat. Commun. 2015;6:8804. doi: 10.1038/ncomms9804. [DOI] [PMC free article] [PubMed] [Google Scholar]
- 41.Kubo A, et al. Mutations in SERPINB7, encoding a member of the serine protease inhibitor superfamily, cause Nagashima-type palmoplantar keratosis. Am. J. Hum. Genet. 2013;93:945–956. doi: 10.1016/j.ajhg.2013.09.015. [DOI] [PMC free article] [PubMed] [Google Scholar]
- 42.Bruhn S, et al. Combining gene expression microarray- and cluster analysis with sequence-based predictions to identify regulators of IL-13 in allergy. Cytokine. 2012;60:736–740. doi: 10.1016/j.cyto.2012.08.009. [DOI] [PubMed] [Google Scholar]
- 43.Davydov IV, Krammer PH, Li-Weber M. Nuclear factor-IL6 activates the human IL-4 promoter in T cells. J. Immunol. 1995;155:5273–5279. [PubMed] [Google Scholar]
- 44.Zhang J, et al. Evidence for multiple promoters of the human IL-5 receptor alpha subunit gene: a novel 6-base pair element determines cell-specific promoter function. J. Immunol. 1997;159:5412–5421. [PubMed] [Google Scholar]
- 45.Simpson-Abelson MR, et al. C/EBPbeta promotes immunity to oral Candidiasis through regulation of beta-defensins. PLoS ONE. 2015;10:e0136538. doi: 10.1371/journal.pone.0136538. [DOI] [PMC free article] [PubMed] [Google Scholar]
- 46.Stritesky GL, et al. The transcription factor STAT3 is required for T helper 2 cell development. Immunity. 2011;34:39–49. doi: 10.1016/j.immuni.2010.12.013. [DOI] [PMC free article] [PubMed] [Google Scholar]
- 47.Ray R, et al. Uteroglobin suppresses SCCA gene expression associated with allergic asthma. J. Biol. Chem. 2005;280:9761–9764. doi: 10.1074/jbc.C400581200. [DOI] [PubMed] [Google Scholar]
- 48.Mitsuishi K, et al. The squamous cell carcinoma antigens as relevant biomarkers of atopic dermatitis. Clin. Exp. Allergy. 2005;35:1327–1333. doi: 10.1111/j.1365-2222.2005.02353.x. [DOI] [PubMed] [Google Scholar]
- 49.Yuyama N, et al. Analysis of novel disease-related genes in bronchial asthma. Cytokine. 2002;19:287–296. doi: 10.1006/cyto.2002.1972. [DOI] [PubMed] [Google Scholar]
- 50.Sivaprasad U, et al. SERPINB3/B4 contributes to early inflammation and barrier dysfunction in an experimental murine model of atopic dermatitis. J. Invest. Dermatol. 2015;135:160–169. doi: 10.1038/jid.2014.353. [DOI] [PMC free article] [PubMed] [Google Scholar]
- 51.Schroder WA, et al. SerpinB2 deficiency results in a stratum corneum defect and increased sensitivity to topically applied inflammatory agents. Am. J. Pathol. 2016;186:1511–1523. doi: 10.1016/j.ajpath.2016.02.017. [DOI] [PubMed] [Google Scholar]
- 52.Woodruff PG, et al. Genome-wide profiling identifies epithelial cell genes associated with asthma and with treatment response to corticosteroids. Proc. Natl Acad. Sci. USA. 2007;104:15858–15863. doi: 10.1073/pnas.0707413104. [DOI] [PMC free article] [PubMed] [Google Scholar]
- 53.Lilly CM, Tateno H, Oguma T, Israel E, Sonna LA. Effects of allergen challenge on airway epithelial cell gene expression. Am. J. Respir. Crit. Care Med. 2005;171:579–586. doi: 10.1164/rccm.200404-532OC. [DOI] [PubMed] [Google Scholar]
- 54.Zhao A, et al. SerpinB2 is critical to Th2 immunity against enteric nematode infection. J. Immunol. 2013;190:5779–5787. doi: 10.4049/jimmunol.1200293. [DOI] [PMC free article] [PubMed] [Google Scholar]
- 55.Visscher PM, Brown MA, McCarthy MI, Yang J. Five years of GWAS discovery. Am. J. Hum. Genet. 2012;90:7–24. doi: 10.1016/j.ajhg.2011.11.029. [DOI] [PMC free article] [PubMed] [Google Scholar]
- 56.Tenesa A, Haley CS. The heritability of human disease: estimation, uses and abuses. Nat. Rev. Genet. 2013;14:139–149. doi: 10.1038/nrg3377. [DOI] [PubMed] [Google Scholar]
- 57.Purcell S, Cherny SS, Sham PC. Genetic power calculator: design of linkage and association genetic mapping studies of complex traits. Bioinformatics. 2003;19:149–150. doi: 10.1093/bioinformatics/19.1.149. [DOI] [PubMed] [Google Scholar]
- 58.Hanifin JM, Rajka G. Diagnostic features of atopic dermatitis. Acta Derm. 1980;92:44–47. [Google Scholar]
- 59.Williams HC, Burney PG, Strachan D, Hay RJ. The U.K. Working Party’s Diagnostic Criteria for Atopic Dermatitis. II. Observer variation of clinical diagnosis and signs of atopic dermatitis. Br. J. Dermatol. 1994;131:397–405. doi: 10.1111/j.1365-2133.1994.tb08531.x. [DOI] [PubMed] [Google Scholar]
- 60.Purcell S, et al. PLINK: a tool set for whole-genome association and population-based linkage analyses. Am. J. Hum. Genet. 2007;81:559–575. doi: 10.1086/519795. [DOI] [PMC free article] [PubMed] [Google Scholar]
- 61.Das S, et al. Next-generation genotype imputation service and methods. Nat. Genet. 2016;48:1284–1287. doi: 10.1038/ng.3656. [DOI] [PMC free article] [PubMed] [Google Scholar]
- 62.Johnson EO, et al. Imputation across genotyping arrays for genome-wide association studies: assessment of bias and a correction strategy. Hum. Genet. 2013;132:509–522. doi: 10.1007/s00439-013-1266-7. [DOI] [PMC free article] [PubMed] [Google Scholar]
- 63.Delaneau O, Zagury JF, Marchini J. Improved whole-chromosome phasing for disease and population genetic studies. Nat. Methods. 2013;10:5–6. doi: 10.1038/nmeth.2307. [DOI] [PubMed] [Google Scholar]
- 64.Lippert C, et al. FaST linear mixed models for genome-wide association studies. Nat. Methods. 2011;8:833–835. doi: 10.1038/nmeth.1681. [DOI] [PubMed] [Google Scholar]
- 65.Willer CJ, Li Y, Abecasis GR. METAL: fast and efficient meta-analysis of genomewide association scans. Bioinformatics. 2010;26:2190–2191. doi: 10.1093/bioinformatics/btq340. [DOI] [PMC free article] [PubMed] [Google Scholar]
- 66.GTEx Consortium Human genomics. The Genotype-tissue expression (GTEx) pilot analysis: multitissue gene regulation in humans. Science. 2015;348:648–660. doi: 10.1126/science.1262110. [DOI] [PMC free article] [PubMed] [Google Scholar]
- 67.Arnold M, Raffler J, Pfeufer A, Suhre K, Kastenmuller G. SNiPA: an interactive, genetic variant-centered annotation browser. Bioinformatics. 2015;31:1334–1336. doi: 10.1093/bioinformatics/btu779. [DOI] [PMC free article] [PubMed] [Google Scholar]
- 68.Ellinghaus D, et al. High-density genotyping study identifies four new susceptibility loci for atopic dermatitis. Nat. Genet. 2013;45:808–812. doi: 10.1038/ng.2642. [DOI] [PMC free article] [PubMed] [Google Scholar]
- 69.Bulik-Sullivan BK, et al. LD score regression distinguishes confounding from polygenicity in genome-wide association studies. Nat. Genet. 2015;47:291–295. doi: 10.1038/ng.3211. [DOI] [PMC free article] [PubMed] [Google Scholar]
Associated Data
This section collects any data citations, data availability statements, or supplementary materials included in this article.
Supplementary Materials
Description of Additional Supplementary Files
Data Availability Statement
The data that support the findings of this study are included in Supplementary Data 1a–d. Additional information is available from the corresponding author upon reasonable request.