Abstract
Background
The almond tree (Prunus amygdalus Batsch) is an important nut tree grown in subtropical regions that produces nutrient-rich nuts. However, a paucity of genomic information and DNA markers has restricted the development of modern breeding technologies for almond trees.
Results
In this study, almonds were sequenced with Illumina paired-end sequencing technology to obtain transcriptome data and develop simple sequence repeats (SSR) markers. We generated approximately 64 million clean reads from the various tissues of mixed almonds, and a total of 42,135 unigenes with an average length of 988 bp were obtained in the present study. A total of 27,586 unigenes (57.7% of all unigenes generated) were annotated using several databases. A total of 112,812 unigenes were annotated with the Gene Ontology (GO) database and assigned to 82 functional sub-groups, and 29,075 unigenes were assigned to the KOG database and classified into 25 function classifications. There were 9470 unigenes assigned to 129 Kyoto Encyclopaedia of Genes and Genomes (KEGG) pathways from five categories in the KEGG pathway database. We further identified 8641 SSR markers from 48,012 unigenes. A total of 100 SSR markers were randomly selected to validate quality, and 82 markers could amplify the specific products of A. communis L., whereas 70 markers were successfully transferable to five species (A. ledebouriana, A. mongolica, A. pedunculata, A. tangutica, and A. triloba).
Conclusions
Our study was the first to produce public transcriptome data from almonds. The development of SSR markers will promote genetics research and breeding programmes for almonds.
Electronic supplementary material
The online version of this article (10.1186/s41065-017-0049-x) contains supplementary material, which is available to authorized users.
Keywords: Prunus amygdalus Batsch, Transcriptome, Functional classification, SSR markers
Background
The almond (Prunus amygdalus Batsch) is one of the world’s most important nut crops. The almond belongs to the genus Prunus, subgenus Amygdalus [1]. Almonds are widely used in food production and have high nutritional value [2]. Most Amygdalus wild species are highly tolerant of cold, drought and salt [3]. Almonds are a typical outbreeding species with gametophyte self-incompatibility [4]. They are also an antioxidant source [5] and an important germplasm resource in breeding programmes [6]. Because almonds have high nutritional value, past research has largely focused on physicochemical properties, seed nutrients and oil extraction [2, 7, 8]. However, despite high economic and nutritional values, genome and genetic resources regarding almonds are scarce, which has restricted the development of modern breeding technologies for almonds.
Molecular markers are important tools used in evaluating genetic diversity among plant species and plant molecular breeding (marker-assisted breeding). In almond trees, expressed sequence tags (ESTs) have been developed, but currently, there are only 3926 ESTs and gene loci available for almond in the NCBI GenBank database. Therefore, the number of ESTs is not sufficient to address almond tree molecular breeding development. Simple sequence repeats (SSRs) are widely used in studies on genetic diversity and relationships of plants because they are highly polymorphic, co-dominant and reproducible [9]. Moreover, SSRs markers could be used in the QTL mapping of important agronomical traits loci and marker-assisted selection in almond trees [10–13]. Presently, however, only a few SSRs have been reported in almonds [14–16]. SRAP and AFLP markers have been used to study genetic diversity and relationships in wild Amygdalus species [2]. A transcriptome is the complete collection of RNA that includes the full range of mRNA, tRNA, rRNA, and other noncoding RNA molecules expressed by one or a group of cells, organs or tissues in a particular environment or a specific developmental stage. The Illumina paired-end sequencing technique has been widely used for transcriptome analysis in plants [10, 17–19].
Transcriptome sequencing is helpful in developing SSR molecular markers, as it is reliable and efficient [20]. However, transcriptomic and associated molecular markers in almonds have not yet been reported. In this study, Illumina sequencing technology was used to analyse the transcriptome of almonds and develop EST-SSR markers. To our knowledge, this is the first study to characterize the almond transcriptome. Our study will provide a foundation for almond molecular biology and molecular breeding of almonds.
Results
Transcriptome generation and de novo assembly
A total of 66,668,192 raw reads were generated from our Illumina HiSeq™ 2000 paired-end sequencing of almonds. The total length of the reads was approximately 10 Gigabase pairs (Gb); a total of 64,924,070 (97.38%) high-quality clean reads (1,440,780, 4.32%) as well as low-quality reads (1,702,602, 2.55%) were collected after removing the adapter. All high-quality reads were assembled using the Trinity program, and a total of 42,135 unigenes with an average length of 988 bp and an N50 length of 1714 bp were obtained. The unigenes ranged from 201 bp to 15,555 bp (Table 1). As shown in Fig. 1, 27,723 unigenes (65.80%) ranged from 201 to 1000 bp, 8699 unigenes (20.65%) were longer than 1000 bp and 5713 unigenes (13.56%) were longer than 2000 bp. The coverage percentage of read-blasted unigenes was 55.74% (more than 10 reads), 19.17% (more than 100 reads), and 25.09% (more than 1000 reads) (Additional file 1). All of the raw data were submitted to the NCBI database (accession number: PRJNA347906).
Table 1.
Summary of transcriptome data for persimmon
| Item | Number |
|---|---|
| 1. Raw sequences and Assembly statistics | |
| Total reads | 66,668,192 |
| Total nucleotides (bp) | 10,000,228,800 |
| GC content percentage | 46.77% |
| Total unigenes (average length; N50; min-max length) | 42,135 (988; 1714; 201–15,555) |
| Mean RPKM value of unigenes (min-mix RPKM value) | 14.8 (0–7109) |
| 2. Bioinformatics annotations of mango fruit unigenes | |
| Gene annotation against Nr (%) | 29,315 (69.6) |
| Gene annotation against Swiss-Prot (%) | 20,642 (49.0) |
| Gene annotation against KEGG (%) | 11,055 (26.2) |
| Gene annotation against KOG (%) | 16,794 (39.9) |
| All annotation genes (%) | 29,464 (69.9) |
| Without annotation genes (%) | 12,671 (30.1) |
| GO Ontology (%) | |
| Biological process category | 51,202; |
| Cellular component category | 24,483; |
| Molecular function category | 37,133; |
Fig. 1.
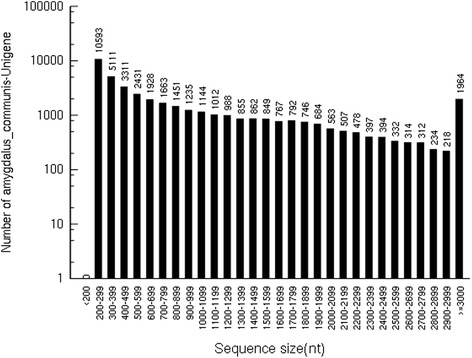
Length distributions of the unigenes. The x-axis indicates a different sequence size, and the y-axis indicates the unigene numbers of a specific sequence size
Functional annotation
The function annotation of the unigenes was performed in the Nr, Swiss-Prot, Kyoto Encyclopaedia of Genes and Genomes (KEGG) and KOG databases by BLASTX (E-value < 10−5). A total of 27,586 unigenes (57.7% of all unigenes) were annotated. A total of 29,315 unigenes (69.6% of all unigenes) of the largest match were annotated in the Nr database, followed by the Swiss-Prot (20,642, 49.0%), KOG (16,794, 39.9%) and KEGG (11,055, 26.2%) databases (Fig. 2). A total of 12,671 (42.5%) unigenes were not annotated in the four databases, indicating that these unigenes may be novel genes (Table 1). For the annotated unigenes in the Nr databases, the homologous sequences belonging to the species were analysed. The ten top-hit species were Prunus mume (18,097, 61.73%), Malus domestica (15,80, 5.40%), Theobroma cacao (1238, 4.22%), Pyrus x bretschneideri (1132, 3.86%), Prunus persica (1061, 3.46%), Gossypium arboreum (853, 2.90%), Brassica napus (710, 2.42%), Medicago truncatula (682, 2.33%), Fragaria vesca subsp. vesca (665, 2.27%), Morus notabilis (311, 1.06%), and others (3029, 10.34%).
Fig. 2.
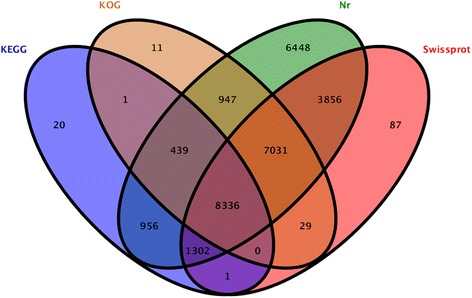
Venn diagram of Nr, Swiss-Prot, KOG and KEGG databases. Venn diagram showing homology sequence numbers of the unigenes in the Nr, Swiss-Prot, GOG and KEGG databases
Functional classification by gene ontology (GO) and KOG
To further evaluate the functions of the almond unigenes, we used GO assignments to classify the almond unigene functions. A total of 112,812 unigenes were assigned to 82 functional sub-groups. Of the three ontology categories, the largest was biological process (51,202 unigenes), followed by cellular component (37,133 unigenes) and molecular function (24,483 unigenes) (Fig. 3). For the biological process group, the most frequent process was metabolic process (11,647, 22.75%), followed by cellular process (10,967, 21.42%). Cell (8581, 23.11%) and cell part (8581, 23.11%) were the most highly represented groups in the cellular component category. For the molecular function category, binding (11,139, 45.50%) and catalytic activity (10,346, 27.86%) represented the greatest proportion. The GO classifications of the unigenes are listed in Additional file 2.
Fig. 3.
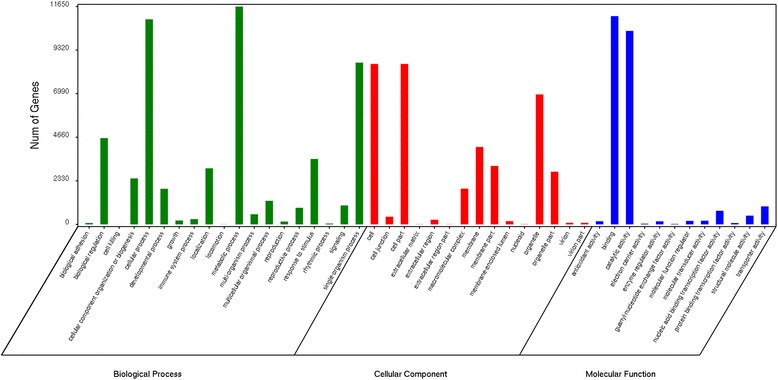
GO function classification of the almond transcriptome. There are three main GO categories: biological process, cellular component and molecular function. The x-axis indicates the categories, and the y-axis indicates the number of the unigenes
KOG classifications were searched based on a BLAST search against the KOG database. A total of 29,075 unigenes were classified into 25 function classifications (Fig. 4). For the 25 KOG categories, the general function prediction was the largest group (5895, 20.28%); posttranslational modification, protein turnover, chaperones (3311, 11.39%), and signal transduction mechanisms (3152, 10.84%) had high percentages, and 15,012 unigenes were assigned to other functional categories (Additional file 3).
Fig. 4.
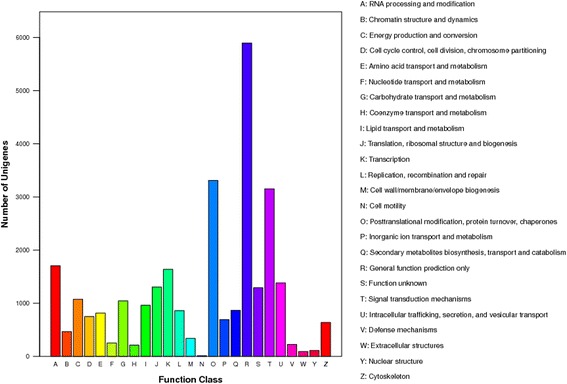
KOG function classification of the almond transcriptome. A total of 25 categories were obtained. The x-axis indicates the categories, and the y-axis indicates the numbers of the unigenes
Functional classifications by KEGG
The pathway annotations were used to analyse the biological functions of genes. In this study, 9470 unigenes were assigned to 129 KEGG pathways that belonged to five categories, namely, metabolic pathways (5648, 59.60%), genetic information processing (2636, 27.8%), cellular processes (512, 5.4%), environmental information processing (389, 4.1%) and organismal systems (285, 3.0%) (Additional file 4). The majority of the unigene pathways were associated with ribosomes (443, 7.3%), carbon metabolism (320, 5.3%), protein processing in the endoplasmic reticulum (290, 4.8%), biosynthesis of amino acids (277, 4.9%), spliceosomes (274, 4.5%), plant hormone signal transduction (249, 4.1%) and endocytosis (245, 4.0%).
Development and characterisation of SSR markers
In this study, the unigene sequences were used to develop new SSR markers with MISA software. A total of 8641 SSRs were identified from 48,012 unigenes. For the 8641 SSRs, di-nucleotide motifs were the most abundant form (5141, 59.5%), followed by tri-nucleotides (2416, 28.5%), tetra-nucleotides (606, 7.0%), hexa-nucleotides (277, 3.2%) and penta-nucleotides (201, 2.3%) (Table 2). In addition, the number of repeated units of the di-nucleotide motifs ranged from 6 to 15, and the tri-nucleotide, tetra-nucleotide, penta-nucleotide, and hexa-nucleotide motifs included 5 to 15, 4 to 10, 4 to 8, and 4 to 7, respectively. SSRs with six tandem repeats were the most frequent (1795, 20.8%), followed by five tandem repeats (1543, 17.9%), more than fifteen tandem repeats (1228, 14.2%), seven tandem repeats (1095, 12.7%), and others (Table 3). The most frequent motif types of SSRs were AG/CT (49.0%), followed by AAG/CTT (9.3%), AT/AT (5.9%), AC/GT (4.5%), AGG/CCT (3.6%) and others (Additional file 5).
Table 2.
Summary of the EST-SSRr data for almond
| Item | Number |
|---|---|
| Total number of sequences examined | 42,135 |
| Total size of examined sequences (bp) | 41,663,061 |
| Total number of identified SSRs | 8641 |
| Number of SSR containing sequences | 6780 |
| Number of sequences containing more than 1 SSR | 1433 |
| Number of SSRs present in compound formation | 752 |
| Di-nucleotide | 5141 (59.5%) |
| Tri-nucleotide | 2416 (28.5%) |
| Tetra-nucleotide | 606 (7.0%) |
| Penta-nucleotide | 201 (2.3%) |
| Hexa-nucleotide | 277 (3.2%) |
Table 3.
Summary of the different repeat units of identified EST-SSRs
| Number of repeat unit | Di- | Tri- | Tetra- | Penta- | Hexa | Total | Percentage (%) |
|---|---|---|---|---|---|---|---|
| 4 | 0 | 0 | 435 | 151 | 200 | 786 | 9.1 |
| 5 | 0 | 1321 | 121 | 39 | 62 | 1543 | 17.9 |
| 6 | 1156 | 592 | 31 | 7 | 9 | 1795 | 20.8 |
| 7 | 771 | 302 | 13 | 3 | 6 | 1095 | 12.7 |
| 8 | 596 | 67 | 4 | 1 | 0 | 668 | 7.7 |
| 9 | 566 | 38 | 1 | 0 | 0 | 605 | 7.0 |
| 10 | 439 | 58 | 1 | 0 | 0 | 498 | 5.8 |
| 11 | 237 | 11 | 0 | 0 | 0 | 248 | 2.9 |
| 12 | 38 | 9 | 0 | 0 | 0 | 47 | 0.5 |
| 13 | 5 | 10 | 0 | 0 | 0 | 15 | 0.2 |
| 14 | 109 | 4 | 0 | 0 | 0 | 113 | 1.3 |
| ≥ 15 | 1224 | 4 | 0 | 0 | 0 | 1228 | 14.2 |
| Total | 5141 | 2416 | 606 | 201 | 277 | 8641 | 100 |
Cross-species transferability of A. communis SSR markers
One hundred SSR sites were randomly selected to design SSR primers (Additional file 6). Among these 100 primer pairs, 82 could amplify the specific products (these 82 markers are highlighted in red in Additional file 6), while the remaining 18 did not generate PCR products. To validate the transferability of A. communis SSR markers, five species (A. ledebouriana, A. mongolica, A. pedunculata, A. tangutica, and A. triloba) (Additional file 7) were assessed using the 82 SSR markers selected above. The results indicated that 70 SSR markers were transferable to these five species and that 12 SSR markers did not generate bands. The PCR amplification results of some primers are shown in Fig. 5. The UPMGA cluster analysis indicated that A. communis and A. mongolica are more closely related (Fig. 6).
Fig. 5.
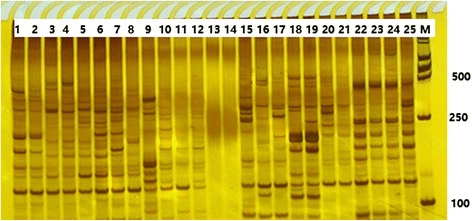
Examples of polymorphic products amplified by different SSR primer pairs. 1–25 represent different primer pairs. M represents DL2000 DNA markers
Fig. 6.
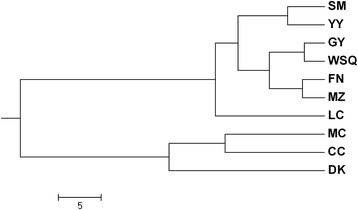
Dendrogram obtained using UPGMA cluster analysis based on Nei’s genetic distances among the ten populations of almonds. The population abbreviations are the same as those in Additional file 7
Discussion
Almonds are one of the most important commercially cultivated crops in subtropical regions, specifically in southwest Asia, the Middle East, and the Mediterranean [8] because almonds have a high nutrient value. Previous studies concerning almonds focused on physicochemical properties, seed nutrients and oil extraction [2, 7, 8]. However, no studies have yet constructed a genetic linkage map, including QTL mapping of important agronomical traits and marker-assisted selection in almond trees. Until now, genome sequencing of some important fruits has been completed using NGS technologies. Transcriptome analysis based on NGS technologies, such as Illumina and 454 sequencing platforms, has provided an efficient tool for obtaining genomic data for some plants without a reference genome, such as wax gourds [21] and pumpkins [22]. Therefore, we sequenced the almond transcriptome to obtain genomic data and then developed many SSR markers. These transcriptome data will provide information for future studies on breeding and molecular biology.
In this study, a large number of transcriptomic unigenes (42135) was obtained using the Illumina HiSeqTM 2500 platform, and the average unigene length was 988 bp. Consistent with recently published plant species, the average length of the unigenes was relatively long (835 bp) compared to black gram (443 bp) [10], caragana (709 bp) [18], wax gourd (709 bp) [21], pumpkin (765 bp) [22], Siberian apricot (652 bp) [23], Chinese jujube (473.4 bp) [24], and safflower (446 bp) [25]. These results indicate a higher quality of almond transcriptome sequencing and de novo assembly. In this study, approximately 27,586 unigenes (57.7% of all unigenes) were annotated by BLAST searches of the Nr, GO, Swiss-Prot, KEGG and KOG databases. Moreover, 12,671 (42.5%) of the unigenes did not annotate to any databases. Technical limitations, such as read length and sequencing depth, may account for these unannotated unigenes. For gene annotation, the sequences of unigenes were blasted against the Nr, Swiss-Prot, KEGG, GO and KOG databases. Approximately 27,586 unigenes (57.7% of all unigenes) were annotated in four protein databases, indicating that the transcriptomic data of almonds may have large transcript diversity. Additionally, approximately 12,671 (42.5%) unigenes were not annotated to the four databases, suggesting that some unigenes may be unique to almonds.
SSR markers have been important in some research, including the assessment of genetic diversity and genetic relationships, the construction of genetic maps, marker-assisted selection of important agronomic traits, and others [2, 26]. Previous studies have also shown that SSR markers are highly polymorphic, codominant and easily reproducible [9]. Due to the time-consuming and expensive nature of traditional methods for SSR marker development, few SSR markers have been reported for almonds, and no studies have reported the development of SSR markers in A. communis, which has limited the application of SSR markers in almond trees. Transcriptome sequencing is an efficient technology for the development of SSR markers in plants, and the SSR markers for some plants have been reported using transcriptome sequencing [10, 21–25]. Our results produced a large number of transcriptome sequences that could be used to develop SSR markers in almonds. In total, 8641 SSR markers were identified from 48,012 unigenes. In this study, di-nucleotide motifs were the most abundant form, followed by tri-nucleotides, tetra-nucleotides, hexa-nucleotides and penta-nucleotides, which is similar to previous studies [23–25]. In addition, the most abundant di-nucleotides and tri-nucleotides were AG/CT and AAG/CTT, respectively, which was consistent with previous reports [20–24]. To assess the quality of SSR markers, we randomly selected 100 pairs of primers and assessed them in five species. Eighty-two percent showed polymorphisms. This result was similar to results found in other plants. The UPMGA cluster analysis indicated that A. communis and A. mongolica were more closely related, which was consistent with Jing et al., who reported using SRAP markers [2]. We believe that the new SSR markers will be used to study genetic diversity, genetic mapping, and, in particular, marker-assisted breeding for almonds.
Conclusion
This paper reports on the transcriptome characterizations of almond trees and provides a large number of SSR markers to elucidate the molecular biology of almond trees. To our knowledge, this is the first attempt to develop SSR markers for almonds using a transcriptome sequencing method, and these developed SSR markers will significantly contribute to genetic diversity studies, QTL mapping, and marker-assisted selection breeding for almonds. Notably, due to high transferability, these SSR markers may provide an efficient tool to accelerate molecular breeding in other Amygdalus species.
Methods
Plant materials and RNA extraction
Plants of A. communis were grown at the experimental farm of Northwest A&F University, Yangling, China. Tissues from leaves, flowers, stems and fruits were harvested from six individuals. The sampled tissues were immediately frozen in liquid nitrogen and stored at −80 °C for later RNA extraction. The RNA samples were isolated using an E.Z.N.A.® Plant RNA Kit (Omega Bio-tek, Inc.) according to the manufacturer’s protocol. The quality and quantity of RNA were assessed using electrophoresis on 1% agarose gels and a NanoDrop 1000 spectrophotometer (Thermo Scientific, Wilmington, DE, USA), respectively. High-quality RNA was used for further analyses. Equal amounts of RNA from different samples were pooled for further studies.
cDNA library construction and transcriptome sequencing
After the RNA was extracted, the cDNA library construction was performed using a TransCript® cDNA sample prep kit (TransGen Biotech, China). The ligation products were size-selected with agarose gel electrophoresis, PCR-amplified, and sequenced using Illumina HiSeqTM 2500 by Gene Denovo Biotechnology Co., Ltd. (Guangzhou, China).
Data filtering, de novo assembly and function annotation
Reads obtained from the sequencing machines included raw reads containing adapters or low-quality bases that would affect the following assembly and analysis. Thus, to obtain high-quality clean reads, the clean reads were assembled using the Trinity assembly program [27]. The isoform was obtained using Trinity software. To eliminate redundant information, the longest isoform was taken as the gene to further analyse; this was defined as the unigene. The functional annotation of unigene sequences was performed by BLASTX search of the non-redundant (Nr) (http://www.ncbi.nlm.nih.gov) database, Swiss-Prot protein database, Kyoto Encyclopaedia of Genes and Genomes (KEGG) database (http://www.genome.jp/kegg), Clusters of Orthologous Groups (KOG) database, and Gene Ontology (GO) database with an E-value < 10–5. We used the Blast2GO program to analyse the GO annotations of the unigenes [28]. The functional classifications were determined with WEGO software [29]. Pathway information of unigenes was collected from KEGG databases [30].
SSR detection and primer design
MISA software (http://pgrc.ipk-gatersleben.de/misa/misa.html) was used to identify microsatellites in the whole transcriptome. The parameters were as follows: definition (unit_size, min_repeats): 2–6 3–5 4–4 5–4 6–4; interruptions (max_difference_between_2_SSRs): 100. If the distance between two SSRs was shorter than 100 bp, they were considered to be one SSR. Based on the MISA results, primer pairs of each SSR loci were designed using Primer premier 3.0 (PREMIER Biosoft International, Palo Alto, CA) in the flanking regions of SSRs.
Validation of SSR markers
To validate the SSR markers, a total of 100 primer pairs were randomly selected and synthesized. Wild almond germplasm from six species (A. communis, A. ledebouriana, A. mongolica, A. pedunculata, A. tangutica, and A. triloba) were used to validate the SSR markers. The total genomic DNA was extracted from fresh leaves using a plant DNA extraction kit (TIANGEN®, China). The DNA quality and concentration were tested with a NanoDrop ND 1000 spectrophotometer (Thermo Scientific, USA). PCR amplification reactions were performed in a 25 μL volume, containing 40 ng of DNA, 0.2 mM dNTPs, 1.5 pM aliquots of forward and reverse primers, 2.5 mM Mg2+, 1 U Taq DNA polymerase (TaKaRa Biotechnology Dalian Co., Ltd., China), and 1× Taq Buffer (10 mM Tris-HCl, pH 8.3, 50 mM KCl). PCR amplification was performed with the following conditions: initial denaturation at 94 °C for 5 min; 30 cycles at 94 °C for 30 s, a primer-specific annealing temperature for 60 s, and 72 °C for 90 s; and 72 °C for 7 min. PCR products were separated by electrophoresis on denaturing 6% polyacrylamide gels and visualized using silver staining. The molecular size of the amplified fragments was estimated using a 10-bp DNA ladder (TransGen Biotech, China).
Additional files
The coverage percentage of reads blasted unigenes. (PNG 25 kb)
Frequency distribution of SSRs from different motif types. (XLSX 11 kb)
The gene ontology classification of assembled unigenes. (XLSX 10 kb)
The details of KOG classifications. (XLSX 14 kb)
The 129 KEGG pathway annotations. (PNG 11 kb)
SSR sites developed in this study. (XLSX 1402 kb)
List of species in this study. (DOCX 16 kb)
Acknowledgements
We would like to thank AJE (https://www.aje.com/) for their expert language editing of this manuscript.
Funding
This work was supported by the earmarked fund for China Agriculture Research System (CARS-28), China Postdoctoral Science Foundation (2015 M582712), the Postdoctoral Science Foundation of Shaanxi Province (2016BSHYDZZ07), and the Science and Technology Research and Development Program of Shaanxi Province (2015KTZDNY02-03-01, 2015KJZDNY02-03-02, 2016KJXX-58).
Availability of data and materials
The data are available at https://www.ncbi.nlm.nih.gov/.
Abbreviations
- GO
Gene Ontology
- KEGG
Kyoto Encyclopaedia of Genes and Genomes
- KOG
Clusters of Orthologous Groups
- Nr
non-redundant
- SSR
simple sequence repeats marker
Authors’ contributions
L-SZ and Z-BJ conceived the project and designed the experiments. X-NY, X-NQ, and C-HG performed the experiment. L-SZ, and Z-BJ wrote and revised the paper. All authors discussed the results and commented on the manuscript. All authors read and approved the final manuscript.
Ethics approval and consent to participate
Not applicable.
Consent for publication
Not applicable.
Competing interests
The authors declare that they have no competing interests.
Publisher’s Note
Springer Nature remains neutral with regard to jurisdictional claims in published maps and institutional affiliations.
Footnotes
Electronic supplementary material
The online version of this article (10.1186/s41065-017-0049-x) contains supplementary material, which is available to authorized users.
Contributor Information
Linsen Zhang, Email: linsenzhang@163.com.
Xiaoni Yang, Email: 839343510@qq.com.
Xiangning Qi, Email: 1075268153@qq.com.
Chunhui Guo, Email: 906832715@qq.com.
Zhaobin Jing, Phone: 86-29-87082613, Email: jingzhaobin@nwsuaf.edu.cn.
References
- 1.Sorkheh K, Dehkordi MK, Ercisli S, Hegedus A, Julia H. Comparison of traditional and new generation DNA markers delares high genetic diversity and differentiated population structure of wild almond species. Sci Rep. 2017;7:5966. doi: 10.1038/s41598-017-06084-4. [DOI] [PMC free article] [PubMed] [Google Scholar] [Retracted]
- 2.Jing ZB, Cheng JM, Guo CH, Wang XP. Seed traits, nutrient elements and assessment of genetic diversity for almond (Amygdalus spp.) endangered to China as revealed using SRAP markers. Bioche Syst Ecol. 2013;49:51–57. doi: 10.1016/j.bse.2013.03.015. [DOI] [Google Scholar]
- 3.Arman MO, Mohammad RG. Assessment of genetic diversity in late flowering almond varieties using ISSR molecular markers aimed to select genotypes tolerant to early spring frost in Yazd province. Curr Bot. 2011;2(1):01–04. [Google Scholar]
- 4.Gradziel T, Martinez-Gomez P, Dicenta F, Kester D. The utilization of related Prunus species for almond variety improvement. J Am Pomo Soc. 2001;55:100–108. [Google Scholar]
- 5.Li N, Xia X, Chen C, Blumberg J, Song Y, Zhang W, Zhang X, et al. Almond consumption reduces oxidative DNA damage and lipid peroxidation in male smokers. J Nutr. 2007;137:2717–2722. doi: 10.1093/jn/137.12.2717. [DOI] [PubMed] [Google Scholar]
- 6.Omirshat T, Geng YP, Zeng LY, Dong SS, Chen F, Chen J, Song ZP, et al. Assessment of genetic diversity and population structure of Chinese wild almond, Amygdalus nana, using EST and genomic SSRs. Biochem Sys Ecol. 2009;37:46–153. doi: 10.1016/j.bse.2008.11.014. [DOI] [Google Scholar]
- 7.Balvardi M, Mendiola J, Castro-Gomez P, Fontecha J, Rezaei K, Ibanez E. Development of pressurized extraction processes for oil recovery from wild almond (Amygdalus scoparia) J Am Oil Chem Soc. 2015;92:1503–1511. doi: 10.1007/s11746-015-2708-2. [DOI] [Google Scholar]
- 8.Rezaei A, Nasirpour A, Tavanai H. Fractionation and some physicochemical properties of almond gum (Amygdalus communis L.) exudates. Food Hydrocoll. 2016;60:461–469. doi: 10.1016/j.foodhyd.2016.04.027. [DOI] [Google Scholar]
- 9.Yang Y, Jing ZB, Ruan X, Cheng JM. Development of simple sequence repeat markers in persimmon (Diospyros L.) and their potential use in related species. Genet Mol Res. 2015;14(1):609–618. doi: 10.4238/2015.January.30.2. [DOI] [PubMed] [Google Scholar]
- 10.Souframanien J, Reddy KS. De novo assembly, characterization of immature seed Transcriptome and development of Genic-SSR markers in black gram (Vigna Mungo L.) Hepper. PLoS One. 2015;10(6):e0128748. doi: 10.1371/journal.pone.0128748. [DOI] [PMC free article] [PubMed] [Google Scholar]
- 11.Forcada CF, Marti AF, Company RS. Mapping quantitative trait loci for kernel composition in almond. BMC Genet. 2012;13:47. doi: 10.1186/1471-2156-13-47. [DOI] [PMC free article] [PubMed] [Google Scholar]
- 12.Tavassolian I, Rabiei G, Gregory D, Mnejja M, Wirthensohn MG, Hunt PW, Gibson JP, Ford CM, Sedgley M, Wu SB. Construction of an almond linkage map in an Australian population nonpareil×Lauranne. BMC Genet. 2010;11:551. doi: 10.1186/1471-2164-11-551. [DOI] [PMC free article] [PubMed] [Google Scholar]
- 13.Forcada CFI, Oraguzie N, Reyes-Chin-Wo S, Espiau MT, Company RSI, Marti AFI. Identification of genetic loci associated with quality traits in almond via association mapping. PLoS One. 2015;10(6):e0127656. doi: 10.1371/journal.pone.0127656. [DOI] [PMC free article] [PubMed] [Google Scholar]
- 14.Hassouna G, Elhem K, Tatiana BZ, Ahmed M, Yolanda G. Development of an SRR-based identification key for Tunisian local almonds. Sci Agric. 2012;69(2):108–113. doi: 10.1590/S0103-90162012000200004. [DOI] [Google Scholar]
- 15.Mnejja M, Garcia-Mas J, Howad W, Arus P. Development and transportability across Prunus species of 42 polymorphic almond microsatellites. Mol Ecol Notes. 2005;5(3):531–535. doi: 10.1111/j.1471-8286.2005.00977.x. [DOI] [Google Scholar]
- 16.Xie H, Sui Y, Chang FQ, Xu Y, Ma RC. SSR allelic variation in almond (Prunus Dulcis mill.) Theor Appl Genet. 2006;112(2):366–372. doi: 10.1007/s00122-005-0138-5. [DOI] [PubMed] [Google Scholar]
- 17.An M, Deng M, Zheng SS, Song YG. De novo transcriptome assembly and development of SSR markers of oaks Quercus austrocochinchinensis and Q. Kerrii (Fagaceae) Tree Genet Geno. 2016;12(103):1–9. [Google Scholar]
- 18.Long Y, Wang Y, Wu S, Wang J, Tian X, Pei X. De novo assembly of Transcriptome sequencing in Caragana Korshinskii Kom. And characterization of EST-SSR markers. PLoS One. 2015;10(1):e0115805. doi: 10.1371/journal.pone.0115805. [DOI] [PMC free article] [PubMed] [Google Scholar]
- 19.Chi W, Ma XF, Niu JG, Zou M. Characterizing the transcriptome and molecular markers information for roach. J Genet. 2016;95:45–51. doi: 10.1007/s12041-015-0597-7. [DOI] [PubMed] [Google Scholar]
- 20.Zhou XJ, Wang YY, Xu YN, Yan RS, Zhao P, Liu W. De novo characterization of flower bud Transcriptomes and the development of EST-SSR markers for the endangered tree Tapiscia Sinensis. Int J Mol Sci. 2015;16:12855–12870. doi: 10.3390/ijms160612855. [DOI] [PMC free article] [PubMed] [Google Scholar]
- 21.Jiang B, Xie D, Liu W, Peng Q, He X. De novo assembly and characterization of the Transcriptome and development of SSR markers in wax gourd (Benicasa hispida) PLoS One. 2013;8(8):e71054. doi: 10.1371/journal.pone.0071054. [DOI] [PMC free article] [PubMed] [Google Scholar]
- 22.Wu TQ, Luo SB, Wang R, Zhong YJ, Xu XM, Lin TE, He XM, et al. The first Illumina-based de novo transcriptome sequencing and analysis of pumpkin (Cucurbita Moschata Duch.) and SSR marker development. Mol Breeding. 2014;34:1437–1447. doi: 10.1007/s11032-014-0128-x. [DOI] [Google Scholar]
- 23.Dong S, Liu Y, Niu J, Ning Y, Lin S, Zhang Z. De novo transcriptome analysis of the Siberian apricot (Prunus Sibirica L.) and search for potential SSR markers by 454 pyrosequencing. Gene. 2014;544:220–227. doi: 10.1016/j.gene.2014.04.031. [DOI] [PubMed] [Google Scholar]
- 24.Li Y, Xu C, Lin X, Cui B, Wu R, Pang X. De novo assembly and characterization of the fruit transcriptome of Chinese jujube (Ziziphus Jujuba mill.) using 454 pyrosequencing and the development of novel tri-nucleotide SSR markers. PLoS One. 2014;9:e106438. doi: 10.1371/journal.pone.0106438. [DOI] [PMC free article] [PubMed] [Google Scholar]
- 25.Huang LL, Yang X, Sun P, Tong W, Hu SQ. The first Illumian based de novo transcriptome sequencing and analysis of safflower flowers. PLoS One. 2012;7:e38653. doi: 10.1371/annotation/e4e8ca0c-f6e8-4b32-aae1-b5f8e0c7ebc3. [DOI] [PMC free article] [PubMed] [Google Scholar]
- 26.Ahmad Z, Mumtaz AS, Ghafoor A, Ali A, Nisar M. Marker assisted selection (MAS) for chickpea Fusarium oxysporum wilt resistant genotypes using PCR based molecular markers. Mol Biol Rep. 2014;41:6755–6762. doi: 10.1007/s11033-014-3561-3. [DOI] [PMC free article] [PubMed] [Google Scholar]
- 27.Grabherr MG, Haas BJ, Yassour M, Levin JZ, Thompson DA, Amit I, Adiconis Z, et al. Full-length transcriptome assembly from RNA-Seq data without a reference genome. Nat Biotechnol. 2011;29:644–652. doi: 10.1038/nbt.1883. [DOI] [PMC free article] [PubMed] [Google Scholar]
- 28.Conesa A, Gotz S, Garcia-Gomez JM, Terol J, Talon M, Robles M. Blast2GO, a universal tool for annotation, visualization and analysis in functional genomics research. Bioinformatics. 2005;21(18):3674–3676. doi: 10.1093/bioinformatics/bti610. [DOI] [PubMed] [Google Scholar]
- 29.Ye J, Fang L, Zheng H, Zhang Y, Chen J, Zhang Z, Wang J, Li S, et al. WEGO, a web tool for plotting GO annotations. Nucleic Acids Res. 2006;34:W293–W297. doi: 10.1093/nar/gkl031. [DOI] [PMC free article] [PubMed] [Google Scholar]
- 30.Kanehisa M, Araki M, Goto S, Hattori M, Hirakawa M, Itoh M, Katayama T, et al. KEGG for linking genomes to life and the environment. Nucleic Acids Res. 2008;36:D480–D484. doi: 10.1093/nar/gkm882. [DOI] [PMC free article] [PubMed] [Google Scholar]
Associated Data
This section collects any data citations, data availability statements, or supplementary materials included in this article.
Supplementary Materials
The coverage percentage of reads blasted unigenes. (PNG 25 kb)
Frequency distribution of SSRs from different motif types. (XLSX 11 kb)
The gene ontology classification of assembled unigenes. (XLSX 10 kb)
The details of KOG classifications. (XLSX 14 kb)
The 129 KEGG pathway annotations. (PNG 11 kb)
SSR sites developed in this study. (XLSX 1402 kb)
List of species in this study. (DOCX 16 kb)
Data Availability Statement
The data are available at https://www.ncbi.nlm.nih.gov/.


