

Abstract
Osteosarcoma (OS) is a common cancerous bone tumor which has a detrimental impact on the lives of patients and their families. The present study aimed at investigating the underlying molecular mechanism of various drug treatments pertaining to OS, including dimethyl sulfoxide (DMSO), doxorubicin (DXP), Nutlin-3, actinomycin D (ActD) and etoposide (Eto). Microarray and p53 chromatin immunoprecipitation combined with sequencing (ChIP-seq) datasets of the OS cell line U2OS treated with distinct drugs were acquired from the Gene Expression Omnibus and differentially-expressed genes (DEGs) were screened for alignment analysis. The p53-binding target genes were identified and ChIP-seq and microarray gene expression data were combined to identify directly and indirectly targeted genes. A regulatory network of p53 was constructed with the acquired data. Finally, the Database for Annotation, Visualization and Integrated Discovery was interrogated for annotation of target genes. A total of 212 p53-binding peaks were obtained in the untreated group, whereas thousands of peaks were obtained in the treated groups. In total, ~1,000 target genes were identified in each of DXP, DMSO, Eto and ActD treatment groups, whereas the Nutlin-3 treatment group identified an increased number, with 5,458 target genes obtained. Several common DEGs including MDM2, TP53I3, RRM2B, FAS and SESN1 were targeted by all the drugs with the exception of DMSO. p53 regulated various genes including EHF, HOXA10 and BHLHE40 in the Nutlin-3 treatment group, whereas p53 regulated EHF, RFX3, TRAF40 and TCF7L2 in the DXR treatment group. The results of the present study indicate that p53 was able to directly regulate target genes including MDM2, TP53I3 and RRM2B or indirectly regulate numerous further genes through several hub genes including EHF and RFX through various drug treatments in U2OS cells. Furthermore, p53 regulated distinct molecular processes in various drug treatments.
Keywords: osteosarcoma, p53, drug treatments
Introduction
Osteosarcoma (OS) is a common cancerous bone tumor most prevalent in children and young adults (1). Specifically, it is a histological form of primary bone cancer derived from primitive transformed cells of mesenchymal origin (2). Numerous patients with OS also suffer from panic attacks and swelling of the lower femur or area directly inferior to the knee, and these symptoms are often exacerbated at night (3). The cause of OS is unknown; however, it is suggested that this disease may be associated with several factors including inheritance, bone dysplasia, germline p53 mutations and Rothmund-Thomson syndrome (4).
p53 is a tumor suppressor gene that regulates the expression of apoptosis-associated genes when stimulated by specific molecular signals (5). p53 mutations have been revealed to be associated with the development of OS (6,7). Luo et al (8) constructed a regulatory network of OS, and further screened IL-6 and BCL2L1 as target genes regulated by p53.
U2OS is a commonly utilized OS cell line. Various chemotherapy drugs, including actinomycin D (ActD), doxorubicin (DXR), Nutlin-3 and etoposide (Eto), have been widely used in OS treatment. Among these drugs, ActD (9), DXR (10) and Eto (11) exhibit direct effects on DNA, inhibiting transcription and promoting apoptosis. However, Nutlin-3 interacts with and disrupts mouse double minute 2 homolog (MDM2), a negative regulator of p53. Inhibiting the interaction between MDM2 and p53 results in an increase in activated p53 and therefore apoptosis (12). In addition, the four drugs can induce cell cycle arrest (13–15). The cell-protective agent dimethyl sulfoxide (DMSO) has also been revealed to affect p53 (16).
In order to investigate the response of p53 to the various drugs in the U2OS cell line, p53 chromatin immunoprecipitation combined with sequencing (ChIP-seq) and microarray data of ActD, DXR, Nutlin-3 and Eto treatment were downloaded for analysis of molecular mechanism. Differentially-expressed genes (DEGs) were screened prior to alignment analysis. Finally, the target genes were investigated for the construction of regulatory networks and annotations were processed.
Materials and methods
Data sources
The microarray datasets and p53 ChIP-seq datasets of OS cell line U2OS treated with distinct drugs (17,18) were acquired from the Gene Expression Omnibus (GEO; www.ncbi.nlm.nih.gov/geo) database. The U2OS cell line was treated with various drugs, including DMSO, DXR, ActD, Nutlin-3 and Eto (Table I).
Table I.
p53 ChIP combined with sequencing datasets.
| Author | Gene expression omnibus sample | Description of U2OS cells | (Refs) |
|---|---|---|---|
| Menendez et al | GSM1133482 | DMSO-treated ChIP | (17) |
| GSM1133483 | DMSO-treated input | ||
| GSM1133484 | DXR-treated ChIP | ||
| GSM1133485 | DXR-treated input | ||
| GSM1133486 | Nutlin-3-treated ChIP | ||
| GSM1133487 | Nutlin-3-treated input | ||
| GSM1133488 | No treatment ChIP | ||
| GSM1133489 | No treatment input | ||
| Smeenk et al | GSM545807 | ActD-treated ChIP | (18) |
| GSM545808 | Etoposide-treated ChIP |
DMSO, dimethyl sulfoxide; DXR, doxorubicin; ActD, actinomycin D; ChIP, chromatin immunoprecipitation.
Analytical methods
DEG analysis. The downloaded microarray datasets of ActD and Eto were standardized. Compared with drug treatment groups and the control U2OS cells without any drug treatment, genes with |log2(fold-change)|>1 were considered to be DEGs. Raw data from DXR, Nutlin-3 and DMSO microarray datasets were processed by Affy analysis of the Bioconductor 2.0 in R (http://www.bioconductor.org/packages/release/bioc/html/affy.html) (19) with P<0.001 and |log2(fold-change)|>1 considered to indicate DEGs.
Alignment and annotation of gene sequences
Bowtie 2 (version 2.0.0-beta5; http://bowtie-bio.sourceforge.net/bowtie2/index.shtml) (20), a tool for aligning sequencing reads to long reference sequences, was utilized for gene sequence alignment between ChIP-seq and Human Genome hg19. Model-based analysis of ChIP-Seq 2 was applied to identify peaks of transcription factor p53-binding regions (21). The two procedures used the default value as parameter. Peak annotations were processed by CisGenome (version 2.0; http://www.biostat.jhsph.edu/~hji/cisgenome/) (22), an integrated tool for tiling array, ChIP-seq, genome and cis-regulatory element analysis. Any genes presenting with a peak located between 2,000 bp upstream and 1,000 bp downstream of the transcription start site was considered to be a p53-binding target gene.
Screening and annotation of target genes
The data gathered from ChIP-seq and expression profile microarray were combined to further screen p53 target genes in the U2OS cell line (promoter range, 2,000±500 bp; the remaining parameters were set using the default values). Subsequently, a p53-centered expression network was constructed. Finally, the Database for Annotation, Visualization and Integrated Discovery (http://david.niaid.nih.gov) (23), an analytical tool for extracting biological information from large lists of genes, was used for annotation of target genes.
Results
Target genes of p53 binding
A total of 212 p53-binding peaks were identified in the untreated group, whereas thousands of peaks were obtained in the treated groups (Table II). Similar numbers of binding sites were identified in the ActD, DXR, Eto and DMSO treatment groups, respectively, with ~1,000 target genes, whereas a total of 5,458 target genes were obtained in the Nutlin-3 treatment group. There were 504 common target genes across the five treatment groups (Fig. 1). Moreover, these target genes were significantly enriched in GO functions associated with positive regulation of apoptosis, positive regulation of programmed cell death and positive regulation of cell death (Table III). Notably, programmed cell death can be divided into several categories including type I (apoptosis) and type II (autophagic death) (24), thus, target genes enriched in positive regulation of apoptosis were different from those enriched in positive regulation of programmed cell death.
Table II.
Microarray datasets.
| Author | Gene expression omnibus sample | Description of U2OS cells | (Refs) |
|---|---|---|---|
| Menendez et al | GSM1131226 | No treatment repeat 1 | (17) |
| GSM1131227 | No treatment repeat 2 | ||
| GSM1131228 | No treatment repeat 3 | ||
| GSM1131229 | DXR-treated repeat 1 | ||
| GSM1131230 | DXR-treated repeat 2 | ||
| GSM1131231 | DXR-treated repeat 3 | ||
| GSM1131232 | DMSO-treated repeat 1 | ||
| GSM1131233 | DMSO-treated repeat 2 | ||
| GSM1131234 | DMSO-treated repeat 3 | ||
| GSM1131235 | Nutlin-3-treated repeat 1 | ||
| GSM1131236 | Nutlin-3-treated repeat 2 | ||
| GSM1131237 | Nutlin-3-treated repeat 3 | ||
| Smeenk et al | GSM552391 | Control ActD repeat 1 | (18) |
| GSM552392 | Control ActD repeat 2 | ||
| GSM552393 | ActD repeat 1 | ||
| GSM552394 | ActD repeat 2 | ||
| GSM552395 | Control Eto repeat 1 | ||
| GSM552396 | Control Eto repeat 2 | ||
| GSM552397 | Eto repeat 1 | ||
| GSM552398 | Eto repeat 2 |
DXR, doxorubicin; DMSO, dimethyl sulfoxide; ActD, actinomycin D; Eto, etoposide.
Figure 1.
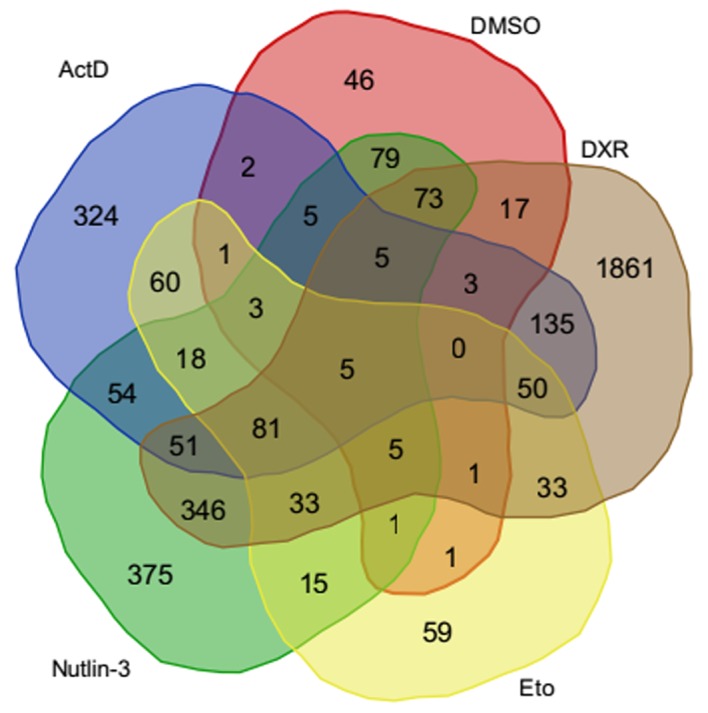
Venn diagram illustrating the number of differentially-expressed gene targets in the DMSO, DXR, Nutlin-3, ActD and Eto treatment groups. ActD, actinomycin D; DMSO, dimethyl sulfoxide; DXR, doxorubicin; Eto, etoposide.
Table III.
Gene ontology analysis of p53 target genes.
| Gene ontology number | Role | n | Genes | False discovery rate, ×10−4 |
|---|---|---|---|---|
| 0043065 | Positive regulation of apoptosis | 32 | ZAK, IL19, RPS27L, RRM2B, BCL2L1, SRC, ZC3H8, GPX1, AEN, FAS, PHLDA3, FGD3, ARHGEF3, PTPRF, HTT, PRKCE, VAV2, TNFSF8, PLEKHF1, NOTCH2, CDKN1A, TNFRSF10B, NUPR1, BBC3, LYST, BAX, FAF1, ABL1, DCUN1D3, APBB2, NGF, KALRN | 1.92 |
| 0043068 | Positive regulation of programmed cell death | 32 | ZAK, IL19, RPS27L, RRM2B, BCL2L1, SRC, ZC3H8, GPX1, AEN, FAS, PHLDA3, FGD3, ARHGEF3, PTPRF, HTT, PRKCE, VAV2, TNFSF8, PLEKHF1, NOTCH2, CDKN1A, TNFRSF10B, NUPR1, BBC3, LYST, BAX, FAF1, ABL1, DCUN1D3, APBB2, NGF, KALRN | 2.24 |
| 0010942 | Positive regulation of cell death | 32 | ZAK, IL19, RPS27L, RRM2B, BCL2L1, SRC, ZC3H8, GPX1, AEN, FAS, PHLDA3, FGD3, ARHGEF3, PTPRF, HTT, PRKCE, VAV2, TNFSF8, PLEKHF1, NOTCH2, CDKN1A, TNFRSF10B, NUPR1, BBC3, LYST, BAX, FAF1, ABL1, DCUN1D3, APBB2, NGF, KALRN | 2.48 |
| 0006974 | Response to DNA damage stimulus | 28 | RAD51C, ZAK, RPS27L, RRM2B, SESN1, TRIAP1, RAD51L1, AEN, NSMCE2, PHLDA3, FANCC, POLH, WRN, FOXN3, CDKN1A, ATXN3, RFC3, EYA2, NUPR1, BTG2, BBC3, BAX, DDB2, BRE, PCNA, ABL1, GADD45A, REV3L | 11.98 |
| 0033554 | Cellular response to stress | 35 | RAD51C, ZAK, ADORA2B, RTN4RL1, RPS27L, RRM2B, SESN1, GPX1, TRIAP1, RAD51L1, AEN, TPO, NSMCE2, TRPV4, PHLDA3, FANCC, POLH, WRN, MAPK10, FOXN3, RFC3, CDKN1A, ATXN3, EYA2, NUPR1, BTG2, BBC3, BAX, ATP2A1, DDB2, BRE, PCNA, ABL1, GADD45A, REV3L | 32.40 |
| 0006917 | Induction of apoptosis | 24 | ARHGEF3, HTT, IL19, RPS27L, RRM2B, VAV2, PRKCE, TNFSF8, PLEKHF1, NOTCH2, GPX1, CDKN1A, TNFRSF10B, NUPR1, BBC3, AEN, BAX, LYST, FAS, ABL1, PHLDA3, FGD3, NGF, KALRN | 93.17 |
| 0012502 | Induction of programmed cell death | 24 | ARHGEF3, HTT, IL19, RPS27L, RRM2B, VAV2, PRKCE, TNFSF8, PLEKHF1, NOTCH2, GPX1, CDKN1A, TNFRSF10B, NUPR1, BBC3, AEN, BAX, LYST, FAS, ABL1, PHLDA3, FGD3, NGF, KALRN | 98.13 |
Distinct responses to various drugs
A total of five DEGs including AREG, LPP, ATF3, FAM198B and HAPLN1 were revealed across each of the five treatment groups (Fig. 1). Furthermore, a total of 86 common DEGs were obtained from the ActD, DXR, Eto and Nutlin-3 treatment groups, which were classified as Gene Ontology (GO) terms including p53 signaling pathway, cell adhesion and biological adhesion (Table IV). Several common DEGs including MDM2, TP53I3, RRM2B, FAS and SESN1 identified in these four treatment groups were also target genes for p53 binding (Table III).
Table IV.
Gene ontology and KEGG enrichment analysis of differentially expressed genes in doxorubicin, Nutlin-3, actinomycin D and etoposide treatment groups.
| Gene ontology/KEGG number | Role | n | Genes |
|---|---|---|---|
| hsa04115 | p53 signaling pathway | 5 | TP53I3, MDM2, RRM2B, FAS, SESN1 |
| 0007155 | Cell adhesion | 11 | HAPLN1, PVRL4, COL17A1, LPP, PKP4, CYFIP2, NINJ1, KITLG, SLAMF7, NEGR1, FEZ1 |
| 0022610 | Biological adhesion | 11 | HAPLN1, PVRL4, COL17A1, LPP, PKP4, CYFIP2, NINJ1, KITLG, SLAMF7, NEGR1, FEZ1 |
| 0042981 | Regulation of apoptosis | 11 | TRIAP1, TP53I3, NUPR1, BTG2, BTG1, RRM2B, FAS, SLAMF7, NEFL, ANXA4, TP53INP1 |
| 0043067 | Regulation of programmed cell death | 11 | TRIAP1, TP53I3, NUPR1, BTG2, BTG1, RRM2B, FAS, SLAMF7, NEFL, ANXA4, TP53INP1 |
| 0010941 | Regulation of cell death | 11 | TRIAP1, TP53I3, NUPR1, BTG2, BTG1, RRM2B, FAS, SLAMF7, NEFL, ANXA4, TP53INP1 |
| 0008083 | Growth factor activity | 5 | TGFA, KITLG, ESM1, AREG, GDF15 |
hsa, human (Homo sapiens); KEGG, Kyoto Encyclopedia of Genes and Genomes.
p53 indirectly regulates downstream genes through other key genes
p53 was able to activate downstream hub genes following a number of drug treatments (Fig. 2). For example, p53 regulated various genes including EHF, HOXA10 and BHLHE40 in the Nutlin-3 treatment group, whereas p53 regulated EHF, RFX3, TRAF40 and TCF7L2 in the DXR treatment group. Additionally, p53 was able to indirectly regulate further genes through TRAF4, BHLHE40 and HOXA10 hub genes (Fig. 2).
Figure 2.

Regulatory network of TP53. DXR, doxorubicin; DMSO, dimethyl sulfoxide.
Discussion
Owing to systemic chemotherapy, long-term outcomes for patients with OS have improved; however, subsequent progress required further research (2). In the present study, a total of five DEGs were revealed across all five treatment groups including AREG, LPP, ATF3, FAM198B and HAPLN1. Additionally, a total of 86 common DEGs were obtained in each of the ActD, DXR, Eto and Nutlin-3 treatment groups, certain of which were identified as being associated with the p53 signaling pathway. Following treatment with various drugs, p53 was identified to be able to activate downstream hub genes including TRAF4, BHLHE40 and HOXA10 which was, in turn, able to affect more genes.
DMSO is a cell-protective agent with limited genetic effects. Of the 86 common DEGs obtained in the four other treatment groups (ActD, DXR, Eto and Nutlin-3), only five were affected by DMSO. In the p53 signaling pathway, DEGs including MDM2, TP53I3 and RRM2B were enriched. MDM2 encodes a nuclear-localized E3 ubiquitin ligase, targets p53 and further promotes tumor formation (25). Soft tissue sarcoma and malignant fibrous histiocytoma are common diseases associated with MDM2 (26). E3 ubiquitin-protein ligase is able to lead to the degradation of p53 by the proteasome and further inhibits cell cycle arrest and apoptosis by binding the transcriptional activation domain (27). In addition, TP53I3 was also differentially expressed in the non-DMSO treatment groups. TP53I3 is a protein-coding gene which encodes enzymes involved in cellular responses to irradiation and oxidative stress (28). This gene is considered to be induced by p53 and involved in p53-mediated cell death (29). TP53I3 is transcriptionally activated by p53 through interacting with downstream pentanucleotide microsatellite sequences, and is associated with the number of pentanucleotide repeats. Furthermore, the microsatellite polymorphism is closely associated with the differential susceptibility to cancer (30). Additionally, RRM2B encodes the small subunit of p53-incucible ribonucleoside reductase which catalyzes the conversion of ribonucleoside into deoxyribonucleoside diphosphates (31). This gene serves a crucial role in cell survival through repairing DNA in a p53-dependent manner (31). In the process of cell cycle arrest, RRM2B also participates in DNA repair by supplying deoxyribonucleotides (32). Therefore, DEGs including MDM2, TP53I3 and RRM2B may be target genes for p53 binding.
In addition to the aforementioned genes, certain downstream genes of p53 may also be affected by drugs. The present study revealed that p53 was able to regulate EHF which may in turn regulate further genes in the DMSO, DXR and Nutlin-3 treatment groups. EHF encodes a protein that is a member of the E26 transformation-specific transcription factor subfamily (33). The encoded protein may participate in carcinogenesis and epithelial differentiation as a transcriptional repressor (34). In addition, a previous study has demonstrated that EHF may perform roles in molecular processes including sequence-specific DNA-binding transcription factor activity and sequence-specific DNA binding (35). Additionally, in the DXR treatment group, p53 was able to regulate hub genes including RFX3 to further regulate more genes. RFX3, a member of the regulatory factor X gene family, encodes a transcriptional activator protein (36). This protein is able to bind to DNA with other RFX family members (37). As with EHF, GO annotations associated with RFK3 exhibited sequence-specific DNA-binding transcription factor activity (38). Subsequently, p53 was able to indirectly regulate genes through several hub genes including EHF and RFX in the U2OS cells treated with a number of drugs.
The results of the present study indicates that p53 is able to directly regulate target genes including MDM2, TP53I3 and RRM2B or indirectly regulate more genes through several hub genes including EHF and RFX as demonstrated using various treatments of U2OS cells. Furthermore, p53 may be involved in distinct molecular processes regulated by various drug treatments. However, further experimental analysis is required to confirm these results.
References
- 1.Burke ME, Albritton K, Marina N. Challenges in the recruitment of adolescents and young adults to cancer clinical trials. Cancer. 2007;110:2385–2393. doi: 10.1002/cncr.23060. [DOI] [PubMed] [Google Scholar]
- 2.Luetke A, Meyers PA, Lewis I, Juergens H. Osteosarcoma treatment-where do we stand? A state of the art review. Cancer Treat Rev. 2014;40:523–532. doi: 10.1016/j.ctrv.2013.11.006. [DOI] [PubMed] [Google Scholar]
- 3.Kere J. Allergy Frontiers: Future Perspectives. Springer; 2010. Neuropeptide S receptor 1: An asthma susceptibility gene; pp. 191–205. [DOI] [Google Scholar]
- 4.Ahmed H, Salama A, Salem SE, Bahnassy AA. A case of synchronous double primary breast carcinoma and osteosarcoma: Mismatch repair genes mutations as a possible cause for multiple early onset malignant tumors. Am J Case Rep. 2012;13:218–223. doi: 10.12659/AJCR.883382. [DOI] [PMC free article] [PubMed] [Google Scholar]
- 5.Vogelstein B, Lane D, Levine AJ. Surfing the p53 network. Nature. 2000;408:307–310. doi: 10.1038/35042675. [DOI] [PubMed] [Google Scholar]
- 6.Mulligan LM, Matlashewski GJ, Scrable HJ, Cavenee WK. Mechanisms of p53 loss in human sarcomas. Proc Natl Acad Sci USA. 1990;87:5863–5867. doi: 10.1073/pnas.87.15.5863. [DOI] [PMC free article] [PubMed] [Google Scholar]
- 7.Toguchida J, Yamaguchi T, Dayton SH, Beauchamp RL, Herrera GE, Ishizaki K, Yamamuro T, Meyers PA, Little JB, Sasaki MS, et al. Prevalence and spectrum of germline mutations of the p53 gene among patients with sarcoma. N Engl J Med. 1992;326:1301–1308. doi: 10.1056/NEJM199205143262001. [DOI] [PubMed] [Google Scholar]
- 8.Luo Y, Deng Z, Chen J. Pivotal regulatory network and genes in osteosarcoma. Arch Med Sci. 2013;9:569–575. doi: 10.5114/aoms.2012.30956. [DOI] [PMC free article] [PubMed] [Google Scholar]
- 9.Sobell HM. Actinomycin and DNA transcription. Proc Natl Acad Sci USA. 1985;82:5328–5331. doi: 10.1073/pnas.82.16.5328. [DOI] [PMC free article] [PubMed] [Google Scholar]
- 10.Fornari FA, Randolph JK, Yalowich JC, Ritke MK, Gewirtz DA. Interference by doxorubicin with DNA unwinding in MCF-7 breast tumor cells. Mol Pharmacol. 1994;45:649–656. [PubMed] [Google Scholar]
- 11.Hande KR. Etoposide: Four decades of development of a topoisomerase II inhibitor. Eur J Cancer. 1998;34:1514–1521. doi: 10.1016/S0959-8049(98)00228-7. [DOI] [PubMed] [Google Scholar]
- 12.Shinohara T, Uesugi M. In-vivo activation of the p53 pathway by small-molecule antagonists of MDM2. Tanpakushitsu Kakusan Koso. 2007;52(13 Suppl):S1816–S1817. [PubMed] [Google Scholar]
- 13.Miyachi M, Kakazu N, Yagyu S, Katsumi Y, Tsubai-Shimizu S, Kikuchi K, Tsuchiya K, Iehara T, Hosoi H. Restoration of p53 pathway by nutlin-3 induces cell cycle arrest and apoptosis in human rhabdomyosarcoma cells. Clin Cancer Res. 2009;15:4077–4084. doi: 10.1158/1078-0432.CCR-08-2955. [DOI] [PubMed] [Google Scholar]
- 14.Ling YH, el-Naggar AK, Priebe W, Perez-Soler R. Cell cycle-dependent cytotoxicity, G2/M phase arrest, and disruption of p34cdc2/cyclin B1 activity induced by doxorubicin in synchronized P388 cells. Mol Pharmacol. 1996;49:832–841. [PubMed] [Google Scholar]
- 15.Xu H, Krystal GW. Actinomycin D decreases Mcl-1 expression and acts synergistically with ABT-737 against small cell lung cancer cell lines. Clin Cancer Res. 2010;16:4392–4400. doi: 10.1158/1078-0432.CCR-10-0640. [DOI] [PubMed] [Google Scholar]
- 16.Hsiao M, Low J, Dorn E, Ku D, Pattengale P, Yeargin J, Haas M. Gain-of-function mutations of the p53 gene induce lymphohematopoietic metastatic potential and tissue invasiveness. Am J Pathol. 1994;145:702. [PMC free article] [PubMed] [Google Scholar]
- 17.Menendez D, Nguyen TA, Freudenberg JM, Mathew VJ, Anderson CW, Jothi R, Resnick MA. Diverse stresses dramatically alter genome-wide p53-binding and transactivation landscape in human cancer cells. Nucleic Acids Res. 2013;41:7286–7301. doi: 10.1093/nar/gkt504. [DOI] [PMC free article] [PubMed] [Google Scholar]
- 18.Smeenk L, van Heeringen SJ, Koeppel M, Gilbert B, Janssen-Megens E, Stunnenberg HG, Lohrum M. Role of p53 serine 46 in p53 target gene regulation. PLoS One. 2011;6:e17574. doi: 10.1371/journal.pone.0017574. [DOI] [PMC free article] [PubMed] [Google Scholar]
- 19.Gautier L, Cope L, Bolstad BM, Irizarry RA. affy-analysis of Affymetrix GeneChip data at the probe level. Bioinformatics. 2004;20:307–315. doi: 10.1093/bioinformatics/btg405. [DOI] [PubMed] [Google Scholar]
- 20.Langmead B, Salzberg SL. Fast gapped-read alignment with Bowtie 2. Nat Methods. 2012;9:357–359. doi: 10.1038/nmeth.1923. [DOI] [PMC free article] [PubMed] [Google Scholar]
- 21.Zhang Y, Liu T, Meyer CA, Eeckhoute J, Johnson DS, Bernstein BE, Nusbaum C, Myers RM, Brown M, Li W, Liu XS. Model-based analysis of ChIP-Seq (MACS) Genome Biol. 2008;9:R137. doi: 10.1186/gb-2008-9-9-r137. [DOI] [PMC free article] [PubMed] [Google Scholar]
- 22.Ji H, Jiang H, Ma W, Johnson DS, Myers RM, Wong WH. An integrated software system for analyzing ChIP-chip and ChIP-seq data. Nat Biotechnol. 2008;26:1293–1300. doi: 10.1038/nbt.1505. [DOI] [PMC free article] [PubMed] [Google Scholar]
- 23.Huang DW, Sherman BT, Tan Q, Kir J, Liu D, Bryant D, Guo Y, Stephens R, Baseler MW, Lane HC, Lempicki RA. DAVID bioinformatics resources: Expanded annotation database and novel algorithms to better extract biology from large gene lists. Nucleic Acids Res. 2007;35:W169–W175. doi: 10.1093/nar/gkm415. [DOI] [PMC free article] [PubMed] [Google Scholar]
- 24.Shimizu S, Kanaseki T, Mizushima N, Mizuta T, Arakawa-Kobayashi S, Thompson CB, Tsujimoto Y. Role of Bcl-2 family proteins in a non-apoptotic programmed cell death dependent on autophagy genes. Nat Cell Biol. 2004;6:1221–1228. doi: 10.1038/ncb1192. [DOI] [PubMed] [Google Scholar]
- 25.Kim Y, Starostina NG, Kipreos ET. The CRL4Cdt2 ubiquitin ligase targets the degradation of p21Cip1 to control replication licensing. Genes Dev. 2008;22:2507–2519. doi: 10.1101/gad.1703708. [DOI] [PMC free article] [PubMed] [Google Scholar]
- 26.Dujardin F, Binh MB, Bouvier C, Gomez-Brouchet A, Larousserie F, Muret Ad, Louis-Brennetot C, Aurias A, Coindre JM, Guillou L, et al. MDM2 and CDK4 immunohistochemistry is a valuable tool in the differential diagnosis of low-grade osteosarcomas and other primary fibro-osseous lesions of the bone. Mod Pathol. 2011;24:624–637. doi: 10.1038/modpathol.2010.229. [DOI] [PubMed] [Google Scholar]
- 27.Lukin DJ, Carvajal LA, Liu WJ, Resnick-Silverman L, Manfredi JJ. p53 promotes cell survival due to the reversibility of its cell cycle checkpoints. Mol Cancer Res. 2015;13:16–28. doi: 10.1158/1541-7786.MCR-14-0177. [DOI] [PMC free article] [PubMed] [Google Scholar]
- 28.Lee YS, Oh JH, Yoon S, Kwon MS, Song CW, Kim KH, Cho MJ, Mollah ML, Je YJ, Kim YD, et al. Differential gene expression profiles of radioresistant non-small-cell lung cancer cell lines established by fractionated irradiation: Tumor protein p53-inducible protein 3 confers sensitivity to ionizing radiation. Int J Radiat Oncol Biol Phys. 2010;77:858–866. doi: 10.1016/j.ijrobp.2009.12.076. [DOI] [PubMed] [Google Scholar]
- 29.Voltan R, Secchiero P, Corallini F, Zauli G. Selective induction of TP53I3/p53-inducible gene 3 (PIG3) in myeloid leukemic cells, but not in normal cells, by Nutlin-3. Mol Carcinog. 2014;53:498–504. doi: 10.1002/mc.21985. [DOI] [PubMed] [Google Scholar]
- 30.Qin X, Zhang S, Li B, Liu XD, He XP, Shang ZF, Xu QZ, Zhao ZQ, Ye QN, Zhao PK. p53-dependent upregulation of PIG3 transcription by γ-ray irradiation and its interaction with KAP1 in responding to DNA damage. Chin Sci Bull. 2011;56:3162–3171. doi: 10.1007/s11434-011-4702-x. [DOI] [Google Scholar]
- 31.Bourdon A, Minai L, Serre V, Jais JP, Sarzi E, Aubert S, Chrétien D, de Lonlay P, Paquis-Flucklinger V, Arakawa H, et al. Mutation of RRM2B, encoding p53-controlled ribonucleotide reductase (p53R2), causes severe mitochondrial DNA depletion. Nat Genet. 2007;39:776–780. doi: 10.1038/ng2040. [DOI] [PubMed] [Google Scholar]
- 32.Kimura T, Takeda S, Sagiya Y, Gotoh M, Nakamura Y, Arakawa H. Impaired function of p53R2 in Rrm2b-null mice causes severe renal failure through attenuation of dNTP pools. Nat Genet. 2003;34:440–445. doi: 10.1038/ng1212. [DOI] [PubMed] [Google Scholar]
- 33.Kas K, Finger E, Grall F, Gu X, Akbarali Y, Boltax J, Weiss A, Oettgen P, Kapeller R, Libermann TA. ESE-3, a novel member of an epithelium-specific ets transcription factor subfamily, demonstrates different target gene specificity from ESE-1. J Biol Chem. 2000;275:2986–2998. doi: 10.1074/jbc.275.4.2986. [DOI] [PubMed] [Google Scholar]
- 34.Tugores A, Le J, Sorokina I, Snijders AJ, Duyao M, Reddy PS, Carlee L, Ronshaugen M, Mushegian A, Watanaskul T, et al. The epithelium-specific ETS protein EHF/ESE-3 is a context-dependent transcriptional repressor downstream of MAPK signaling cascades. J Biol Chem. 2001;276:20397–20406. doi: 10.1074/jbc.M010930200. [DOI] [PubMed] [Google Scholar]
- 35.Jolma A, Kivioja T, Toivonen J, Cheng L, Wei G, Enge M, Taipale M, Vaquerizas JM, Yan J, Sillanpää MJ, et al. Multiplexed massively parallel SELEX for characterization of human transcription factor binding specificities. Genome Res. 2010;20:861–873. doi: 10.1101/gr.100552.109. [DOI] [PMC free article] [PubMed] [Google Scholar]
- 36.Maijgren S, Sur I, Nilsson M, Toftgård R. Involvement of RFX proteins in transcriptional activation from a Ras-responsive enhancer element. Arch Dermatol Res. 2004;295:482–489. doi: 10.1007/s00403-004-0456-5. [DOI] [PubMed] [Google Scholar]
- 37.Sengupta P, Xu Y, Wang L, Widom R, Smith BD. Collagen alpha1(I) gene (COL1A1) is repressed by RFX family. J Biol Chem. 2005;280:21004–21014. doi: 10.1074/jbc.M413191200. [DOI] [PMC free article] [PubMed] [Google Scholar]
- 38.Badis G, Berger MF, Philippakis AA, Talukder S, Gehrke AR, Jaeger SA, Chan ET, Metzler G, Vedenko A, Chen X, et al. Diversity and complexity in DNA recognition by transcription factors. Science. 2009;324:1720–1723. doi: 10.1126/science.1162327. [DOI] [PMC free article] [PubMed] [Google Scholar]