

Abstract
Introduction:
The aim of this study was to estimate the associations between neighbourhood built environment characteristics and transportation walking (TW), recreational walking (RW), and moderate-intensity (MPA) and vigorous-intensity physical activity (VPA) in adults independent of sociodemographic characteristics and residential self-selection (i.e. the reasons related to physical activity associated with a person’s choice of neighbourhood).
Methods:
In 2007 and 2008, 4423 Calgary adults completed land-based telephone interviews capturing physical activity, sociodemographic characteristics and reasons for residential self-selection. Using spatial data, we estimated population density, proportion of green space, path/cycleway length, business density, bus stop density, city-managed tree density, sidewalk length, park type mix and recreational destination mix within a 1.6 km street network distance from the participants’ geolocated residential postal code. Generalized linear models estimated the associations between neighbourhood built environment characteristics and weekly neighbourhood-based physical activity participation (≥ 10 minutes/week; odds ratios [ORs]) and, among those who reported participation, duration of activity (unstandardized beta coefficients [B]).
Results:
The sample included more women (59.7%) than men (40.3%) and the mean (standard deviation) age was 47.1 (15.6) years. TW participation was associated with intersection (OR = 1.11; 95% CI: 1.03 to 1.20) and business (OR = 1.52; 1.29 to 1.78) density, and sidewalk length (OR = 1.19; 1.09 to 1.29), while TW minutes was associated with business (B = 19.24 minutes/week; 11.28 to 27.20) and tree (B = 6.51; 2.29 to 10.72 minutes/week) density, and recreational destination mix (B = −8.88 minutes/ week; −12.49 to −5.28). RW participation was associated with path/cycleway length (OR = 1.17; 1.05 to 1.31). MPA participation was associated with recreational destination mix (OR = 1.09; 1.01 to 1.17) and sidewalk length (OR = 1.10; 1.02 to 1.19); however, MPA minutes was negatively associated with population density (B = −8.65 minutes/ week; −15.32 to −1.98). VPA participation was associated with sidewalk length (OR = 1.11; 1.02 to 1.20), path/cycleway length (OR = 1.12; 1.02 to 1.24) and proportion of neighbourhood green space (OR = 0.89; 0.82 to 0.98). VPA minutes was associated with tree density (B = 7.28 minutes/week; 0.39 to 14.17).
Conclusion:
Some neighbourhood built environment characteristics appear important for supporting physical activity participation while others may be more supportive of increasing physical activity duration. Modifications that increase the density of utilitarian destinations and the quantity of available sidewalks in established neighbourhoods could increase overall levels of neighbourhood-based physical activity.
Keywords: physical activity, walkability, neighbourhood, urban form, built environment
Highlights
Neighbourhood built environment characteristics are important for supporting different types of neighbourhood- based physical activity, and not just walking.
Built environment characteristics, in particular sidewalks and nonrecreational destinations, within 1.6 kilometres of home could encourage higher overall levels of neighbourhood-based physical activity in adults.
Policies that encourage the creation of built environments supportive of physical activity in Canadian cities could contribute to increases in physical activity, and in turn improve population health.
Introduction
Fewer than 20% of Canadian adults achieve adequate levels of physical activity considered necessary for optimal health.1,2 Furthermore, Canadian adults on average spend only about three minutes per day participating in vigorous-intensity physical activity (i.e. physical activity that requires at least a six-fold higher energy expenditure than that expended during physical rest).2 Compared with vigorousintensity physical activity, Canadian adults on average spend substantially more time—approximately 20 minutes per day—participating in moderate-intensity physical activity (i.e. physical activity that requires a three- to five-fold increase in energy expenditure over that expended during physical rest).2 Yet, vigorous-intensity physical activity may provide health benefits over and above those typically provided by moderate-intensity physical activity.3-7 After adjustment for total energy expenditure, participating in vigorous-intensity physical activity has been found to provide greater cardiovascular health benefits compared with moderate-intensity physical activity.7 Vigorous-intensity physical activity is positively associated with improvements in aerobic fitness7,8 and negatively associated with the risk of chronic disease and all-cause mortality.9 Thus, improving population levels of both moderate and vigorous-intensity physical activity is important for reducing chronic health conditions such as cardiovascular disease, type 2 diabetes, hypertension, depression, overweight and obesity and some cancers, which place significant burden on the Canadian health care system.10
Specific intra-individual, interindividual and environmental factors may influence the type and intensity of physical activity that adults undertake.11 During the past two decades, evidence on the associations between the built environment and physical activity has emerged rapidly, yet much of this evidence is derived from studies investigating the relations between neighbourhood built environment characteristics and walking and cycling.12,13 Built environment characteristics such as land use mix, residential density, pedestrian connectivity and overall walkability are consistently found correlates of walking.12 Notably, although there are certain characteristics that are associated with both types of walking, some built environment characteristics appear more important for supporting transportation walking, while others are more important for supporting recreational walking.12,14,15 Similarly, researchers have found that different built environment characteristics influence the intensity of physical activity undertaken (i.e. walking, moderate-intensity or vigorous-intensity physical activity).8,13,16 Studies on the relations between the built environment and vigorous-intensity physical activity are rare; nevertheless, findings to-date suggest that self-reported and objectively measured neighbourhood built environment characteristics such as sidewalks;17 bike trails;8 high quality green and open space;18 monuments;18 intersection density;19 density of local roads;19 proximity, availability, and use of physical activity– related facilities;16,17,20-22 safety;17 aesthetics and interesting sights;8,17 and walkability23 are potentially important for supporting vigorous-intensity physical activity. Information about which specific built environment characteristics are associated with which specific types of physical activity could inform the planning and development of health-supportive neighbourhoods.13,24
Residential self-selection, the nonrandom process of individuals choosing to reside in neighbourhoods that align with their physical activity preferences, has plagued built environment–physical activity researchers to-date, in particular as it affects evidence derived from cross-sectional study designs. Residential self-selection, if not statistically controlled or adjusted for in cross-sectional studies, may result in inflated estimates of the association between built environment characteristics and physical activity.14,25 Nevertheless, only a few cross-sectional studies have estimated built environment–physical activity associations while statistically adjusting for residential self-selection.14 Furthermore, the measurement of neighbourhood-specific, self-reported measures of physical activity is similarly rare. Physical activity measures that ignore the context in which behaviour is undertaken (e.g. inside the neighbourhood) may underestimate the true associations between the neighbourhood built environment characteristics and physical activity.24 Controlling for residential self-selection, capturing summer and winter patterns of physical activity and collecting neighbourhood-specific physical activity data has the potential to provide more accurate estimates of the association between the neighbourhood built environment and physical activity, which in turn could better inform urban and transportation policy and practices that result in the desired improvements in physical activity.
The aim of this study was to estimate the relative associations between objectively measured neighbourhood built environment characteristics and weekly participation and time spent in different neighbourhood- based physical activities, namely, transportation walking, recreational walking, moderate-intensity physical activity, vigorous-intensity physical activity, and total physical activity while adjusting for residential self-selection and sociodemographic characteristics.
Methods
Detailed descriptions of the data collection and previous analysis are presented elsewhere.26,27 Briefly, we used randomdigit dialling to recruit two independent cross-sectional samples of adults from households located within the Calgary municipal area. Telephone interviews were undertaken from July 2007 to October 2007 (n = 2199; response rate = 33.6%) and repeated from January 2008 to April 2008 (n = 2223; response rate = 36.7%). The two samples, recruited using the same methodology, provided data regarding summer and winter physical activity patterns.28 Cellular phone numbers were not used to supplement the list of telephone numbers as they were not readily available for Calgary residents at the time the study was undertaken. One eligible and consenting adult (≥ 18 years of age) from each sampled household completed a telephone interview capturing, among other characteristics, physical activity, residential self-selection, sociodemographic variables and residential postal code. The Conjoint Health Research Ethics Board at the University of Calgary granted ethics approval for this study.
Variables
Neighbourhood built environment
We geocoded residential six-digit postal codes using longitude and latitude coordinates from Statistics Canada’s Postal Code Conversion File and used ArcGIS version 10 (Environmental Systems Research Institute, Inc., Redlands, CA, USA) to create a 1.6 km radius, line-based network polygon (i.e. a “walkshed”) around each participant’s home.29,30 We used postal codes because complete household addresses were not available for all participants. In Canada, geocoded urban postal codes provide valid estimates of household geographical location.31 In urban areas, the last three digits of a postal code indicate a specific city block, i.e. the area on one side of the street located between two intersecting streets, or a single building such as a large apartment. Other studies have also used the 1.6 km walkshed for estimating associations between neighbourhood built environment characteristics and physical activity;32,33 it is the approximate distance a typical adult can walk (i.e. at a speed of 6.4 km/h) in approximately 15 minutes.
We used ArcGIS with existing municipal administrative databases to estimate built environment characteristics within each walkshed. Built environment characteristics estimated for each walkshed included (per square kilometre [km2]) intersections; licensed businesses and services; bus stops; sidewalk length (in metres) and mix of recreational destinations. We assigned administrative neighbourhood boundary–level data when walkshed-level data were not available (i.e. population per km2, count of city-managed trees per km2, length in metres of path/cycle ways per km2 and proportion of green space area). While our preference was to estimate all nine built environment variables at the walkshed level, data at this level were not available for all built environment variables. Thus, rather than removing these variables from the analysis completely, we decided to retain these neighbourhood-level built environment variables in the study due to their potential associations with physical activity. Previous evidence12,13,26,27 informed our choice of built environment variables included in this study. All built environment variables were transformed into z-scores.
Neighbourhood-based physical activity
Participants responded to items adapted and pilot tested34 from the Neighbourhood Physical Activity Questionnaire.35 Participants were asked to consider four types of physical activity—transportation walking, recreational walking, moderate-intensity physical activity and vigorous-intensity physical activity—they had undertaken within a 15-minute walk of home. For transportation walking, participants were asked “In a usual week how many times do you walk as a means of transportation, such as going to and from work, walking to the store or walking to the bus stop or LRT in your neighbourhood or local area?” For recreational walking, participants were asked “In a usual week how many times do you walk for recreation, health or fitness (including walking your dog) in or around your neighbourhood or local area?” Participants also reported their total minutes of transportation and recreational walking in their neighbourhood in a usual week. Similarly worded items also captured neighbourhood-based moderateintensity physical activity (activity undertaken for recreation, health or fitness “that does not make you breathe harder or puff and pant”) and vigorous-intensity physical activity (activity undertaken for recreation, health or fitness activity “that makes you breathe harder or puff and pant”).
Some evidence suggests that there may be different correlates for physical activity initiation versus maintenance.36 Thus, we estimated two variables for each physical activity type: (1) nonparticipation (< 10 minutes/ week) versus participation (≥ 10 minutes/ week); and (2) duration (minutes/ week) among those who reported participation. The New Canadian Physical Activity Guidelines recommend that moderate-tovigorous physical activity be undertaken in bouts of at least 10 minutes.37 Minutes for the four types of activity were also summed to obtain total weekly minutes of neighbourhood-based physical activity.
Residential self-selection
Participants reported the importance (i.e. not at all, somewhat or very important) of a predetermined list of items capturing reasons for choosing to reside in their current neighbourhood. Using a principal component analysis reported elsewhere,27 19 items were reduced to four residential self-selection scales: (1) access to places that support physical activity (Cronbach’s alpha [α] = 0.79); (2) access to local services (α = 0.61); (3) sense of community (α = 0.71); and (4) ease of driving (α = 0.54). The six items that loaded onto the “access to places that support physical activity” scale included those capturing the importance of proximity to parks, proximity to recreational facilities, proximity to trails, places to be physically active, places to walk or cycle to and attractive scenery (e.g. mountains). Four items loaded on the “access to local services” scale were ease of walking, proximity to school or work, proximity to transit and proximity to stores or services. Four items (sense of community, safety from crime, attractive streets and cleanliness of streets) loaded onto the “sense of community” scale. Two items, (the importance of access to highways and ease of driving) loaded onto the “ease of driving” scale. Three items capturing the importance of affordability, proximity to downtown and proximity to friends and family did not load onto any scale and were subsequently removed from further analysis. Responses to the individual items belonging to each of the four scales were summed, with higher scores indicating a stronger preference for or reasons for choosing to reside in the neighbourhood based on access to places for physical activity, access to local stores and services, sense of community and ease of driving.
Sociodemographic characteristics
Participants reported their gender, age, highest education level achieved (i.e. high school or less, college, university), number of dependents < 18 years of age at home (i.e. none, one or ≥ 2 children), and whether they owned/were buying or rented the home in which they resided (i.e. owner/buyer versus nonowner).
Statistical analysis
Descriptive statistics including frequencies and measures of central tendency and variation (i.e. means, standard deviations and medians) were estimated for built environment characteristics, physical activity, residential self-selection and sociodemographic variables. Pearson’s correlations (r) were estimated between the nine built environment variables. For neighbourhood- based transportation walking, recreational walking, moderate-intensity physical activity and vigorous-intensity physical activity, we used generalized linear models (binomial distribution with a logit link function) to estimate the odds ratios (ORs) and 95% confidence intervals (CIs) for the association between usual weekly participation and each built environment characteristic adjusting for covariates (i.e. residential self-selection in relation to access to physical activity opportunities, access to stores and services, sense of community and ease of driving), sociodemographic characteristics, and survey season. Covariate-adjusted generalized linear models (gamma distribution with identity link function) estimated the linear association (unstandardized beta coefficient [B] and 95% CI) between usual weekly minutes of neighbourhood-based transportation walking, recreational walking, moderate-intensity physical activity, vigorous-intensity physical activity, and total physical activity, and each of the nine built environment characteristics. We evaluated goodness of fit using normed chi-square (NC; NC = model chi-square/ degrees of freedom) estimated for the fully adjusted models. Models with NC values less than or equal to 2 were considered to have acceptable fit. Model coefficients with p-values less than .05 were considered statistically significant. We performed our analyses using IBM SPSS Statistics for Windows, version 22 (IBM Corp., Armonk, NY, USA).
Results
Of those participants who were recruited into the study (n = 4423), 4034 provided complete physical activity, residential selfselection and sociodemographic data.
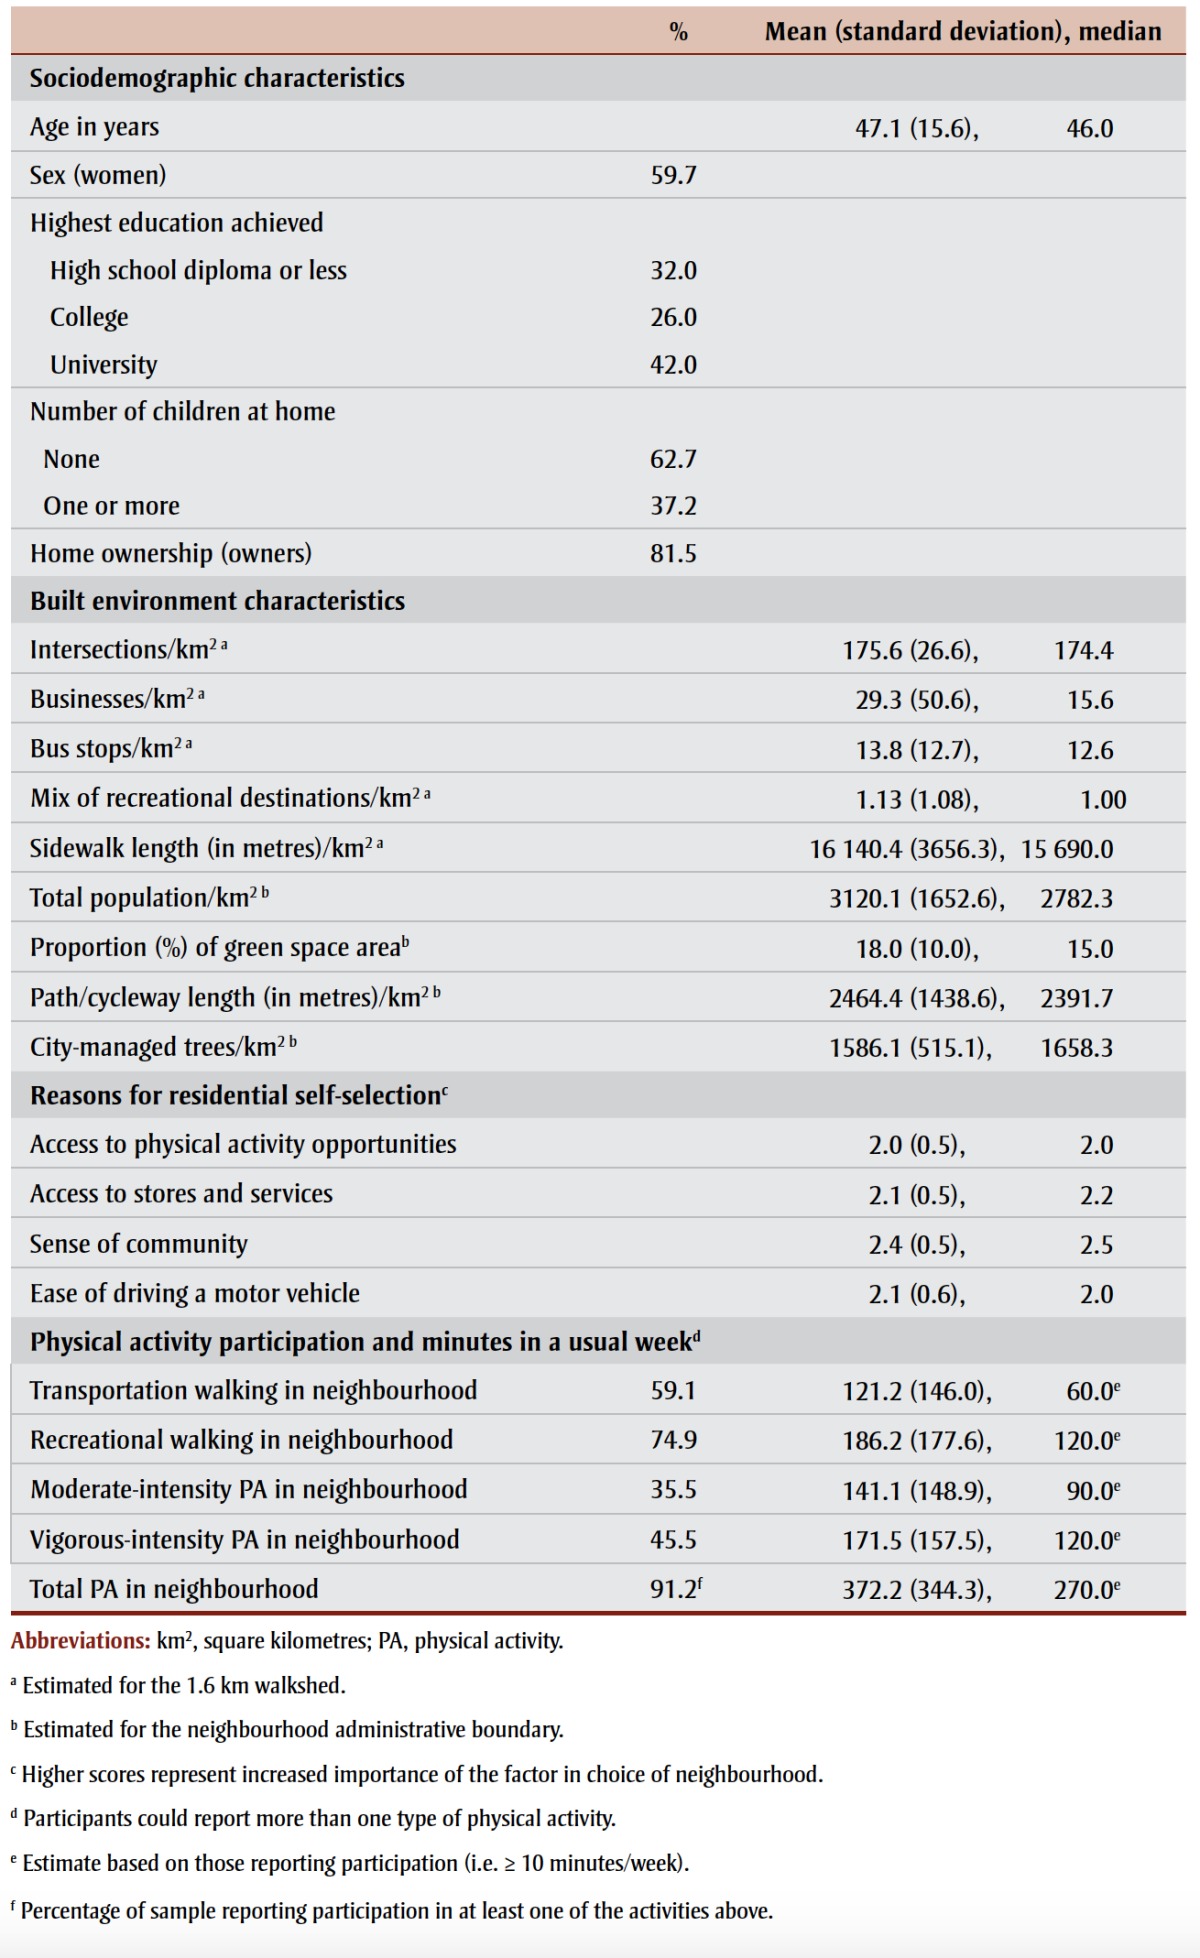
More people in the sample were women, had a university education, were without dependents under age 18 years and were home owners (Table 1). The average (standard deviation) age of the sample was 47.1 (15.6) years. On average, participants considered access to physical activity opportunities, access to shops and stores, sense of community and ease of driving to be somewhat important reasons for residing in their current neighbourhood (Table 1). Pearson’s correlations between the nine built environment variables ranged from r = −0.30 (i.e. between proportion [%] of green space area and population/km2) to r = 0.62 (i.e. between businesses/km2 and bus stops/km2). All but five of the 36 estimated correlations between the built environment variables were smaller than ± 0.30 (results not shown).
TABLE 1. Sample sociodemographic, neighbourhood built environment, residential self-selection and physical activity characteristics, Calgary, 2007–2008 (n = 4034).
 |
Weekly participation in neighbourhood-based physical activity
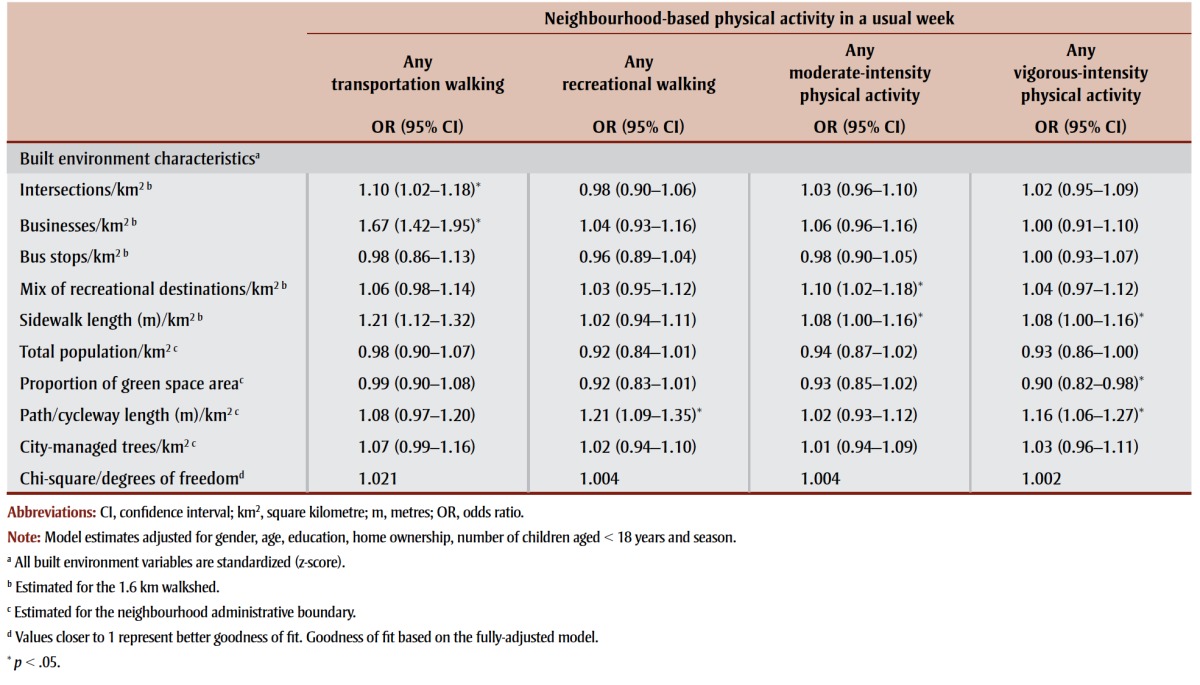
More than half of participants reported participation in neighbourhood-based walking for transportation (59.1%) or recreation (74.9%) (Table 1). Fewer participants reported participation in neighbourhoodbased moderate-intensity (35.5%) and vigorous-intensity physical activity (45.5%). Adjusting for all covariates, participation in transportation walking was positively associated with intersection density (OR = 1.11; 95% CI: 1.03–1.20), business density (1.52; 1.29–1.78) and sidewalk length (1.19; 1.09–1.29) (Table 2). Sidewalk length was also positively associated with participation in neighbourhoodbased moderate-intensity (1.10; 1.02–1.19) and vigorous-intensity physical activity (1.11; 1.02–1.20). Adjusting for covariates, path/cycleway length was positively associated with participation in neighbourhood- based recreational walking (1.17; 1.05–1.31) and vigorous-intensity physical activity (1.12; 1.02–1.24). Further, recreational destination mix was positively associated with participation in neighbourhood- based moderate-intensity physical activity (1.09; 1.01–1.17). The proportion of green space in the neighbourhood was negatively associated with participation in vigorous-intensity physical activity (0.89; 0.82–0.98) (Table 2). For comparison, the estimated associations between participation in neighbourhood-based physical activity and built environment characteristics without residential self-selection adjustment are reported in Table 3.
TABLE 2. Generalized linear model (binomial distribution and logit link function) estimated ORs and 95% CIs for associations between participation in neighbourhood-based physical activity and built environment characteristics, Calgary, 2007–2008 (n = 4034).
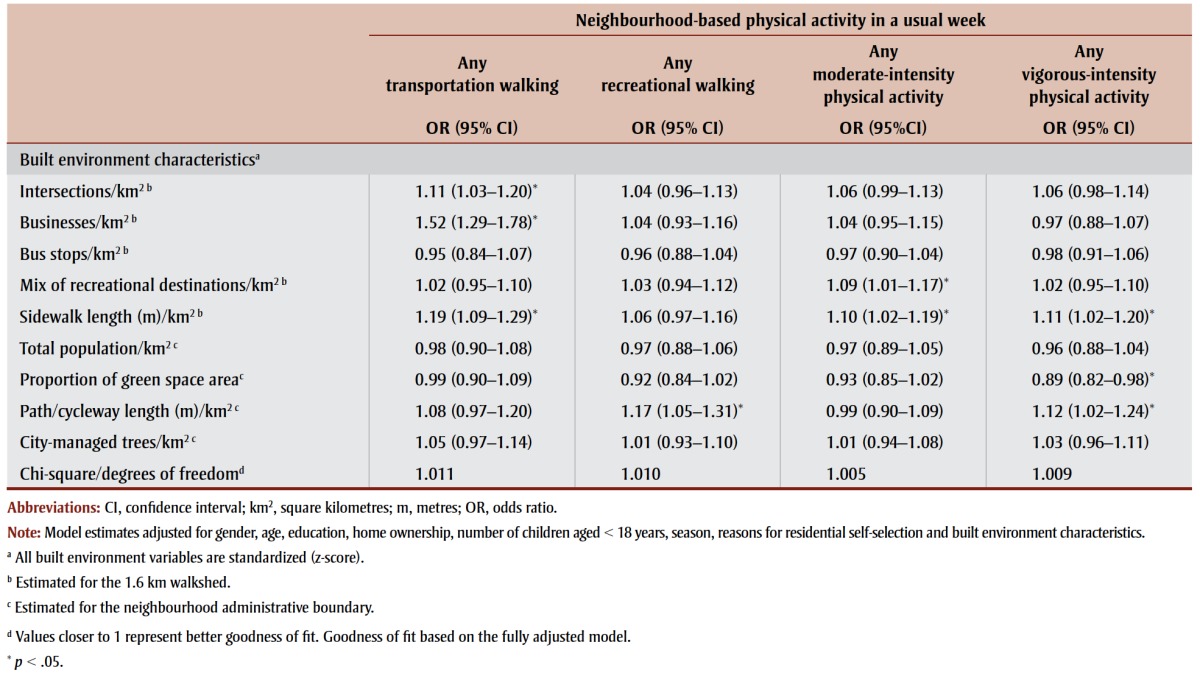 |
TABLE 3. Generalized linear model (binomial distribution and logit link function) estimated ORs and 95% CIs for associations between participation in neighbourhood-based physical activity and built environment characteristics without adjustment for residential self-selection variables, Calgary, 2007–2008 (n = 4034).
 |
Weekly minutes of neighbourhood-based physical activity
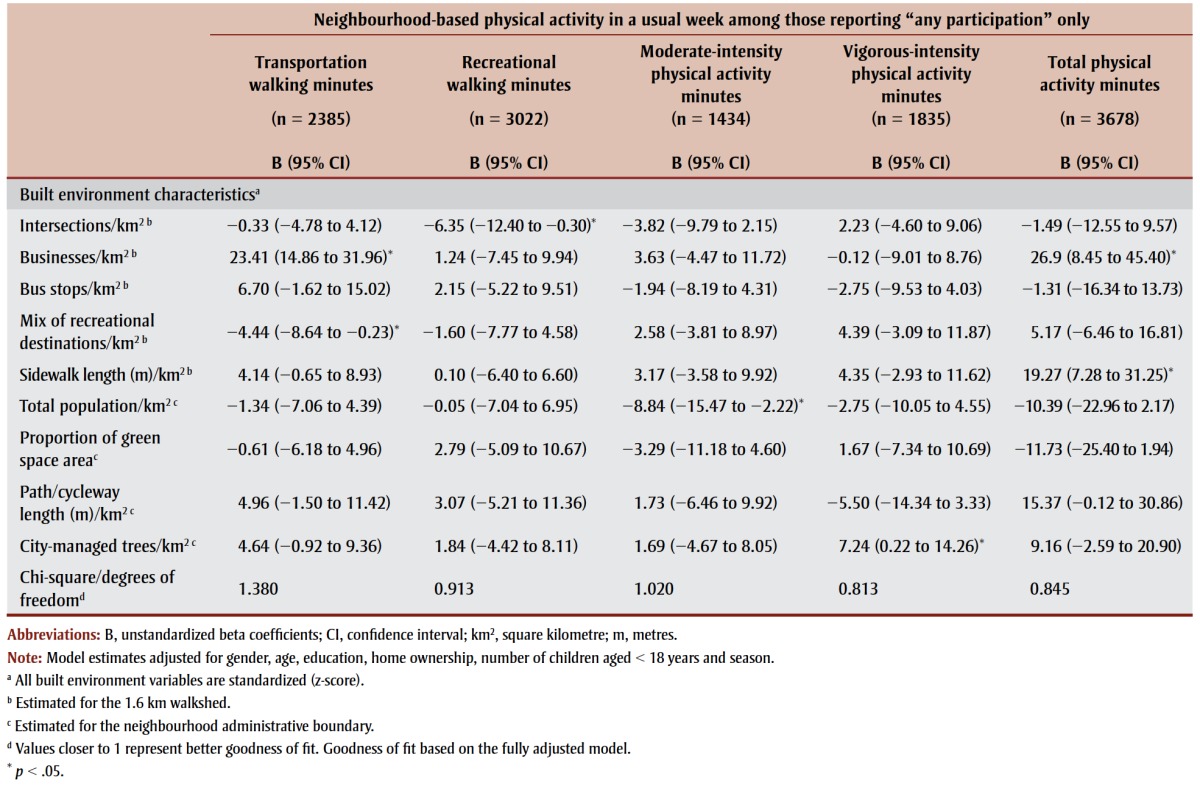
For those reporting participation, mean minutes were higher for neighbourhood-based recreational walking (186.2 ± 177.6 minutes/ week), followed by vigorous-intensity physical activity (171.5 ± 157.5 minutes/ week), moderate-intensity physical activity (141.1 ± 148.9 minutes/week), and transportation walking (121.2 ± 146.0 minutes/ week) (Table 1). Adjusting for covariates, neighbourhood-based transportation walking was significantly (p < .05) associated with business density (B = 19.24 minutes/week; 95% CI: 11.28–27.20), recreational destination mix (−8.88 minutes/ week; −12.49 to −5.28) and density of city-managed trees (6.15 minutes/week; 2.29–10.72) (Table 4). Further, population density was negatively associated with neighbourhood-based moderate-intensity physical activity (−8.65 minutes/week; −15.32 to −1.98). Density of city-managed trees was positively associated with neighbourhood- based vigorous-intensity physical activity (7.28 minutes/week; 0.39–14.17). Notably, only business density (27.35 minutes/ week; 9.86–44.83) and sidewalk length (18.69 minutes/week; 7.69–29.69) were associated with total neighbourhoodbased physical activity. No built environment characteristics were significantly associated with weekly minutes of recreational walking (Table 4). For comparison, the estimated associations between weekly minutes of neighbourhood-based physical activity and built environment characteristics without residential self-selection adjustment are reported in Table 5.
TABLE 4. Generalized linear model (gamma distribution and identity link function) estimated unstandardized beta coefficients (B) and 95% CIs for associations between time spent in neighbourhood-based physical activity and built environment characteristics, Calgary, 2007–2008.
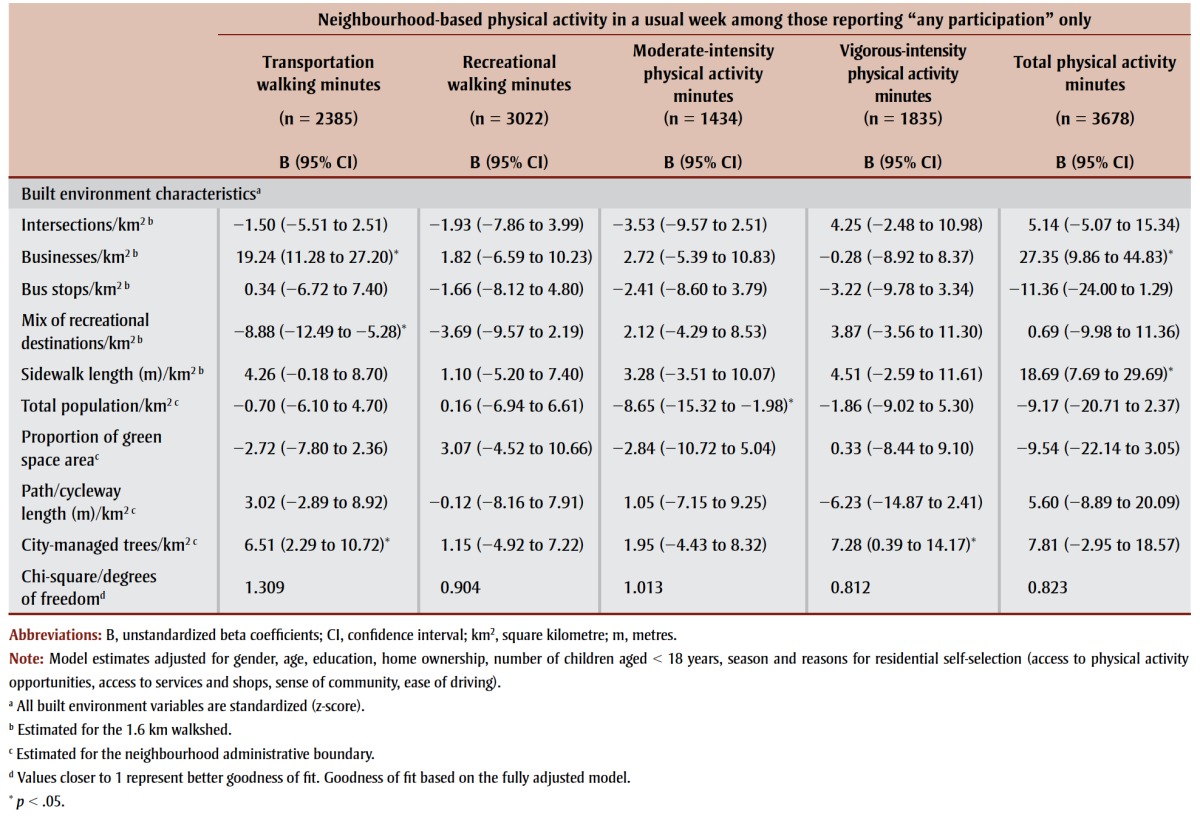 |
TABLE 5. Generalized linear model (gamma distribution and identity link function) estimated unstandardized beta coefficients (B) and 95% CIs for associations between time spent in neighbourhood-based physical activity and built environment characteristics without adjustment for residential self-selection variables, Calgary, 2007–2008.
 |
Discussion
The study findings suggest that different objectively measured neighbourhood built environment characteristics are associated with various types of physical activity in adults. In support of previous evidence,12,14,15 neighbourhood built environment characteristics appeared to be more important for neighbourhood-based transportation walking versus recreational walking. Similar to findings from other studies, we also found differences in the neighbourhood built environment characteristics that were associated with moderate-intensity versus vigorous-intensity physical activity.8,13,16 Further, these findings suggest that the built environment correlates of physical activity participation (i.e. ≥ 10 minutes/ week vs. < 10 minutes/week) may be different from the built environment correlates of the duration of time spent in physical activity. The findings are novel in that we estimated associations between the built environment and different types of neighbourhood-based physical activity while also statistically adjusting for residential self-selection, and that we examined both physical activity participation and duration as separate outcomes.
We observed a greater number of built environment characteristics to be significantly associated with transportation walking compared with recreational walking. Similar to others, we found connectivity (intersection density), availability of destinations (business density), and the availability of sidewalks (sidewalk length) to be positively associated with transportation walking.12,38 Importantly, our findings suggest that increasing the density of businesses within neighbourhoods could result in increases in both transportation walking initiation, and the amount of overall time spent walking for transportation. We also found the density of citymanaged trees to be associated with duration of time spent walking for transportation inside the neighbourhood. This finding was unexpected given that aesthetics (including gardens and trees) are often associated with recreational physical activity.39 We speculate that the density of trees may be higher in older neighbourhoods, which typically offer infrastructure that is more supportive for transportation walking.40,41 One built characteristic only—length of pathways and cycleways per square kilometre—was associated with participation in neighbourhood-based recreational walking, although this characteristic was not found to be associated with time spent in neighbourhood-based recreational walking.
The recreational destination mix per square kilometre was positively associated with participation in, but not minutes of, moderate-intensity physical activity. The recreational destination mix was, however, negatively associated with neighbourhood- based transportation walking minutes. One explanation for this could be that recreational and nonrecreational destinations compete for geographical space and so the more recreational facilities there are, the fewer utilitarian destinations there can be to walk to. Despite evidence suggesting the importance of parks in supporting physical activity,42,43,44 we found no significant positive associations between the proportion of green space and any of our physical activity outcomes. Surprisingly, we found a higher proportion of green space area within a neighbourhood to be associated with a lower likelihood of participating in neighbourhood- based vigorous-intensity physical activity. Others have found the presence and quality of neighbourhood parks and open space to be positively associated with jogging.18 We were not able to differentiate between the potentially different types of vigorous-intensity physical activity. Notably, our measure of green space did not differentiate between parks based on their quality, type or size, all of which may be important park characteristics associated with physical activity,45,46and included greenspace for the neighbourhood administrative boundary and was not specific to the 1.6 km walkshed. For many adults, parks may not be an important destination in and of themselves for vigorous-intensity physical activity, but rather may be destinations traversed along cycling and jogging/running routes.47Although we attempted to adjust for residential self-selection, it is possible that individuals who were inclined to participate in vigorous-intensity physical activity also chose to reside in neighbourhoods that had less green space.
Previous studies have found the availability of sidewalks to be important for supporting transportation walking17,48 and moderate-intensity and vigorous-intensity physical activity.17 Our study also found sidewalks to be positively associated with transportation walking and overall physical activity inside the neighbourhood. Extending sidewalks in established neighbourhoods may be a cost-effective intervention with regard to promoting transportation walking.49 Our findings suggest that sidewalks might also support other types and overall levels of neighbourhood- based physical activity that in turn could provide health benefits. Importantly, the number of business destinations and length of sidewalks were the only characteristics significantly associated with total minutes of neighbourhoodbased physical activity. A one-standarddeviation increase in business density was associated with an increase in total neighbourhood- based physical activity of 25 minutes per week, while an increase of one standard deviation in sidewalk length was associated with an increase in total neighbourhood- based physical activity of 18 minutes per week. From a planning perspective, compared with some other built environment characteristics, sidewalks may be less difficult or costly to modify within the infrastructure constraints of existing neighbourhoods. Modifying zoning ordinances to allow the development of more shops and services mixed with residential land uses within new and existing neighbourhoods might contribute to higher levels of neighbourhood- based physical activity. We found it noteworthy that despite some negative associations between built environment characteristics and some physical activities (i.e. population density and moderateintensity physical activity, recreational destination density and transportation walking, and proportion of green space and vigorous-intensity physical activity), no built environment characteristics were significantly negatively associated with total neighbourhood-based physical activity. Thus, improvements made to a neighbourhood’s built environment to make it more supportive of physical activity are likely to result either in no change or an increase, and not a decrease, in overall neighbourhood-based physical activity.
Strengths and limitations
This study has several strengths, including the matching of the built environment with our definition of neighbourhoodbased physical activity (i.e. within a 15-minute walk from home); statistical adjustment for residential self-selection; and estimating the relative associations between different built environment characteristics and four different physical activity behaviours as well as overall neighbourhood-based physical activity.
Despite these strengths, the use of selfreported physical activity is a limitation of this study due to potential measurement bias.50 For our study, we considered the use of an objective measure of physical activity such as accelerometers less feasible than self-report. Notably, our estimates of weekly physical activity duration were higher than might be expected for this population, which may have partly been due to our exclusion of nonparticipants from these estimates.
The response rate may restrict the generalizability of our findings. Compared to the Calgary population, telephone-interview respondents were more educated, included a higher proportion of older adults (≥ 60 years of age), were more likely to have dependents younger than 18 years and included a higher proportion of women, people born in Canada and home owners. 28 Furthermore, only those households with landline telephones had an opportunity to be recruited into our study. Households with and without landline telephones may differ in regard to their health and sociodemographic characteristics.51
Despite statistically adjusting for residential self-selection, the direction of causality between the built environment and physical activity cannot be determined from our cross-sectional data. Most estimated associations between the built environment variables and physical activity were either unchanged or attenuated slightly after adjustment for the residential self-selection variables. Only one statistically significant association prior to adjustment for residential self-selection attenuated and was not statistically significant after adjustment (i.e. intersection density and recreational walking minutes). The findings here suggest that while adjusting for residential self-selection in cross-sectional built environment–physical activity studies is important, the impact on estimated associations might be small and for the most part may not impact the conclusions drawn. Natural experiments are needed to assess temporal relations between changes in the built environment and changes in physical activity.52
The modifiable areal unit problem implies that chosen operational definition of the neighbourhood can impact estimated associations with physical activity.53 Definitions of neighbourhood boundaries can influence the estimated associations between the built environment and physical activity.54,55 It is possible that our estimated associations, based on a 1.6 km walkshed, may not generalize to other walkshed boundary sizes. The use of Global Positioning System (GPS) monitors, together with accelerometers, is a promising approach for objectively capturing behaviour-defined neighbourhoods and physical activity for each individual.56
Our measures of the built environment, while comprehensive, are not exhaustive and did not include microlevel or streetscape characteristics. For instance, access to transit was represented only by the density of bus stops within the neighbourhood; however, access to train services, whether transit stops were sheltered from weather, route timetable and frequency of services, among other factors, might also contribute to decisions regarding transportation walking.
Conclusion
Importantly, our findings suggest that associations between the neighbourhood built environment and neighbourhoodbased physical activity exist even after adjusting for reasons for residential selfselection. Further, we found evidence for behaviour-specific neighbourhood built environment correlates.24 Modifications of some built environment characteristics may not have the same effect on all physical activities. Related to this, some neighbourhood built environment characteristics may be more important for promoting or supporting physical activity initiation or participation while other neighbourhood built environment characteristics may be more supportive of increasing physical activity duration among those who are already active. To increase total neighbourhood- based physical activity, our findings suggest that urban planners should consider, in particular, increasing the local density of business (utilitarian) destinations and quantity or length of available sidewalks. The impact of built environment characteristics on different physical activities should be considered when planning, designing and modifying neighbourhood built environments.
Acknowledgements
This study was part of the EcoEUFORIA project funded by the Canadian Institutes of Health Research (CIHR; Principal Investigator Dr. Alan Shiell). Gavin McCormack is supported by a CIHR New Investigator Award.
Conflicts of interest
The author declares no conflicts of interest.
References
- Statistics Canada. Ottawa (ON):: [modified 2015 Nov 27; cited 2016 Jun]. Directly measured physical activity of adults, 2012 and 2013 [Internet]. . Available from: http://www.statcan.gc.ca/pub/82-625-x/2015001/article/14135-eng.htm . [Google Scholar]
- Colley RC, Garriguet D, Janssen I, Craig CL, Clarke J, Tremblay MS. Physical activity of Canadian adults: accelerometer results from the 2007 to 2009 Canadian Health Measures Survey. Health Rep. 2011;22((1)):7–14. [PubMed] [Google Scholar]
- Do moderate-intensity and vigorous-intensity physical activities reduce mortality rates to the same extent? J Am Heart Assoc [Internet]. Shiroma EJ, Sesso HD, Moorthy MV, Buring JE, Lee IM. 3(5): e000802 doi: 10.1161/JAHA.114.000802. . Available from: http://jaha.ahajournals.org/content/3/5/e000802 . [DOI] [PMC free article] [PubMed] [Google Scholar]
- Chomistek AK, Cook NR, Flint AJ, Rimm EB. Vigorous-intensity leisure-time physical activity and risk of major chronic disease in men. Med Sci Sports Exerc. 2012;44((10)):1898–905. doi: 10.1249/MSS.0b013e31825a68f3. [DOI] [PMC free article] [PubMed] [Google Scholar]
- Samitz G, Egger M, Zwahlen M. Domains of physical activity and all-cause mortality: systematic review and dose-response meta-analysis of cohort studies. Int J Epidemiol. 2011;40((5)):1382–400. doi: 10.1093/ije/dyr112. [DOI] [PubMed] [Google Scholar]
- Lollgen H, Bockenhoff A, Knapp G. Physical activity and all-cause mortality: an updated meta-analysis with different intensity categories. Int J Sports Med. 2009;30((3)):213–24. doi: 10.1055/s-0028-1128150. [DOI] [PubMed] [Google Scholar]
- Swain DP, Franklin BA. Comparison of cardioprotective benefits of vigorous versus moderate intensity aerobic exercise. Am J Cardiol. 2006;97((1)):141–7. doi: 10.1016/j.amjcard.2005.07.130. [DOI] [PubMed] [Google Scholar]
- Salvo D, Reis RS, Hino AA, Hallal PC, Pratt M. Intensity-specific leisure-time physical activity and the built environment among Brazilian adults: a best-fit model. J Phys Act Health. 2015;12((3)):307–18. doi: 10.1123/jpah.2013-0087. [DOI] [PubMed] [Google Scholar]
- Warburton DE, Bredin SS. Reflections on physical activity and health: what should we recommend? Can J Cardiol. 2016;32((4)):495–504. doi: 10.1016/j.cjca.2016.01.024. [DOI] [PubMed] [Google Scholar]
- Janssen I. Health care costs of physical inactivity in Canadian adults. Appl Physiol Nutr Metab. 2012;37((4)):803–6. doi: 10.1139/h2012-061. [DOI] [PubMed] [Google Scholar]
- Trost SG, Owen N, Bauman AE, Sallis JF, Brown W. Correlates of adults’ participation in physical activity: review and update. Med Sci Sports Exerc. 2002;34((12)):1996–2001. doi: 10.1097/00005768-200212000-00020. [DOI] [PubMed] [Google Scholar]
- Saelens B, Handy S. Built environment correlates of walking: a review. Med Sci Sports Exerc. 2008;40((7 Suppl)):S550–S566. doi: 10.1249/MSS.0b013e31817c67a4. [DOI] [PMC free article] [PubMed] [Google Scholar]
- Wendel-Vos W, Droomers M, Kremers S, Brug J, van Lenthe F. Potential environmental determinants of physical activity in adults: a systematic review. Obes Rev. 2007;8((5)):425–40. doi: 10.1111/j.1467-789X.2007.00370.x. [DOI] [PubMed] [Google Scholar]
- In search of causality: a systematic review of the relationship between the built environment and physical activity among adults. Int J Behav Nutr Phys Act [Internet]. McCormack G, Shiell A. 8(1):125 doi: 10.1186/1479-5868-8-125. . Available from: http://dx.doi.org/10.1186/1479-5868-8-125 . [DOI] [PMC free article] [PubMed] [Google Scholar]
- Coogan PF, White LF, Adler TJ, Hathaway KM, Palmer, Rosenberg L. Prospective study of urban form and physical activity in the Black Women’s Health Study. Am J Epidemiol. 2009;170((9)):1105–17. doi: 10.1093/aje/kwp264. [DOI] [PMC free article] [PubMed] [Google Scholar]
- De Bourdeaudhuij I, Sallis JF, Saelens BE. Environmental correlates of physical activity in a sample of Belgian adults. Am J Health Promot. 2003;18((1)):83–92. doi: 10.4278/0890-1171-18.1.83. [DOI] [PubMed] [Google Scholar]
- Giles-Corti B, Donovan R. Socioeconomic status differences in recreational physical activity levels and real and perceived access to a supportive environment. Prev Med. 2002;35:601–11. doi: 10.1006/pmed.2002.1115. [DOI] [PubMed] [Google Scholar]
- Karusisi N, Bean K, Oppert JM, Pannier B, Chaix B. Multiple dimensions of residential environments, neighborhood experiences, and jogging behavior in the RECORD Study. Prev Med. 2012;55((1)):50–5. doi: 10.1016/j.ypmed.2012.04.018. [DOI] [PubMed] [Google Scholar]
- Hou N, Popkin BM, Jacobs DR, Jr. , et al. Longitudinal associations between neighborhood-level street network with walking, bicycling, and jogging: the CARDIA study. Health Place. 2010;16((6)):1206–15. doi: 10.1016/j.healthplace.2010.08.005. [DOI] [PMC free article] [PubMed] [Google Scholar]
- Sallis JF, Hovell MF, Hofstetter CR, et al. Distance between homes and exercise facilities related to frequency of exercise among San Diego residents. Public Health Rep. 1990;105((2)):179–85. [PMC free article] [PubMed] [Google Scholar]
- McCormack GR, Giles-Corti B, Bulsara M. Correlates of using neighborhood recreational destinations in physically active respondents. J Phys Act Health. 2007;4((1)):39–53. doi: 10.1123/jpah.4.1.39. [DOI] [PubMed] [Google Scholar]
- McCormack GR, Giles-Corti B, Bulsara M. The relationship between destination proximity, destination mix and physical activity behaviors. Prev Med. 2008;46((1)):33–40. doi: 10.1016/j.ypmed.2007.01.013. [DOI] [PubMed] [Google Scholar]
- Saelens BE, Sallis JF, Black JB, Chen D. Neighborhood-based differences in physical activity: an environment scale evaluation. Am J Public Health. 2003;93((9)):1552–8. doi: 10.2105/ajph.93.9.1552. [DOI] [PMC free article] [PubMed] [Google Scholar]
- Giles-Corti B, Timperio A, Bull F, Pikora T. Understanding physical activity environmental correlates: increased specificity for ecological models. Exerc Sport Sci Rev. 2005;33((4)):175–81. doi: 10.1097/00003677-200510000-00005. [DOI] [PubMed] [Google Scholar]
- Cao X, Mokhtarian P, Handy S. Examining the impacts of residential self-selection on travel behaviour: a focus on empirical findings. Transp Rev. 2009;29((3)):359–95. [Google Scholar]
- McCormack GR, Friedenreich C, Sandalack BA, Giles-Corti B, Doyle- Baker PK, Shiell A. The relationship between cluster-analysis derived walkability and local recreational and transportation walking among Canadian adults. Health Place. 2012;18:1079–87. doi: 10.1016/j.healthplace.2012.04.014. [DOI] [PubMed] [Google Scholar]
- The associations between objectively-determined and self-reported urban form characteristics and neighborhood-based walking in adults. Int J Behav Nutr Phys Act [Internet]. Jack E, McCormack GR. 11:71 doi: 10.1186/1479-5868-11-71. . Available from: http://dx.doi.org/10.1186/1479-5868-11-71. [DOI] [PMC free article] [PubMed] [Google Scholar]
- McCormack GR, Friedenreich C, Shiell A, Giles-Corti B, Doyle-Baker PK. Sex- and age-specific seasonal variations in physical activity among adults. J Epidemiol Community Health. 2010;64:1010–6. doi: 10.1136/jech.2009.092841. [DOI] [PubMed] [Google Scholar]
- Comparing circular and network buffers to examine the influence of land use on walking for leisure and errands. Int J Health Geogr [Internet]. Oliver L, Schuurman N, Hall A. 6(1):41 doi: 10.1186/1476-072X-6-41. . Available from: http://dx.doi.org/10.1186/1476-072X-6-41 . [DOI] [PMC free article] [PubMed] [Google Scholar]
- Sandalack BA, Alaniz Uribe FG, Eshghzadeh Zanjani A, Shiell A, McCormack GR, Doyle-Baker PK. Neighbourhood type and walkshed size. J Urbanism. 2013;6((3)):236–55. [Google Scholar]
- Accuracy of city postal code coordinates as a proxy for location of residence. Int J Health Geogr [Internet]. Bow CJ, Waters N, Faris P, et al. 3(1):5 doi: 10.1186/1476-072X-3-5. . Available from: http://dx.doi.org/10.1186/1476-072X-3-5 . [DOI] [PMC free article] [PubMed] [Google Scholar]
- Does walkable neighbourhood design influence the association between objective crime and walking? Int J Behav Nutr Phys Act [Internet]. Foster S, Knuiman M, Villanueva K, Wood L, Christian H, Giles-Corti B. 11:100 doi: 10.1186/s12966-014-0100-5. . Available from: http://dx.doi.org/10.1186/s12966-014-0100-5 . [DOI] [PMC free article] [PubMed] [Google Scholar]
- Villanueva K, Knuiman M, Nathan A, et al. The impact of neighborhood walkability on walking: does it differ across adult life stage and does neighborhood buffer size matter? Health Place. 2014;25:43–6. doi: 10.1016/j.healthplace.2013.10.005. [DOI] [PubMed] [Google Scholar]
- McCormack GR, Shiell A, Doyle- Baker PK, Friedenreich C, Sandalack B, Giles-Corti B. Testing the reliability of neighborhood-specific measures of physical activity among Canadian adults. J Phys Act Health. 2009;6((3)):367–73. doi: 10.1123/jpah.6.3.367. [DOI] [PubMed] [Google Scholar]
- Giles-Corti B, Timperio A, Cutt H, et al. Development of a reliable measure of walking within and outside the local neighborhood: RESIDE’s Neighborhood Physical Activity Questionnaire. Prev Med. 2006;42((6)):455–9. doi: 10.1016/j.ypmed.2006.01.019. [DOI] [PubMed] [Google Scholar]
- van Stralen MM, De Vries H, Mudde AN, Bolman C, Lechner L. Determinants of initiation and maintenance of physical activity among older adults: a literature review. Health Psych Rev. 2009;3((2)):147–207. [Google Scholar]
- Tremblay MS, Warburton DE, Janssen I, et al. New Canadian physical activity guidelines. Appl Physiol Nutr Metab. 2011;36((1)):36–46. doi: 10.1139/H11-009. [DOI] [PubMed] [Google Scholar]
- Sugiyama T, Neuhaus M, Cole R, Giles-Corti B, Owen N. Destination and route attributes associated with adults’ walking: a review. Med Sci Sports Exerc. 2012;44((7)):1275–86. doi: 10.1249/MSS.0b013e318247d286. [DOI] [PubMed] [Google Scholar]
- Sugiyama T, Cerin E, Owen N, et al. Perceived neighbourhood environmental attributes associated with adults’ recreational walking: IPEN Adult study in 12 countries. Health Place. 2014;28:22–30. doi: 10.1016/j.healthplace.2014.03.003. [DOI] [PMC free article] [PubMed] [Google Scholar]
- Sandalack B, Nicolai A. University of Calgary Press; Calgary (AB): 2006. The Calgary Project: urban form/urban life. p. 218 p. [Google Scholar]
- Berrigan D, Troiano RP. The association between urban form and physical activity in U.S. adults. Am J Prev Med. 2002;23((2 Suppl 1)):74–9. doi: 10.1016/s0749-3797(02)00476-2. [DOI] [PubMed] [Google Scholar]
- McCormack GR, Rock M, Toohey AM, Hignell D. Characteristics of urban parks associated with park use and physical activity: a review of qualitative research. Health Place. 2010;16((4)):712–26. doi: 10.1016/j.healthplace.2010.03.003. [DOI] [PubMed] [Google Scholar]
- Koohsari MJ, Mavoa S, Villanueva K, et al. Public open space, physical activity, urban design and public health: concepts, methods and research agenda. Health Place. 2015;33:75–82. doi: 10.1016/j.healthplace.2015.02.009. [DOI] [PubMed] [Google Scholar]
- Kaczynski A, Henderson K. Environmental correlates of physical activity: a review of evidence about parks and recreation. Leisure Sciences. 2007;29((4)):315–54. [Google Scholar]
- Kaczynski AT, Potwarka LR, Saelens BE. Association of park size, distance, and features with physical activity in neighborhood parks. Am J Public Health. 2008;98((8)):1451–6. doi: 10.2105/AJPH.2007.129064. [DOI] [PMC free article] [PubMed] [Google Scholar]
- Sugiyama T, Francis J, Middleton NJ, Owen N, Giles-Corti B. Associations between recreational walking and attractiveness, size, and proximity of neighborhood open spaces. Am J Public Health. 2010;100((9)):1752–7. doi: 10.2105/AJPH.2009.182006. [DOI] [PMC free article] [PubMed] [Google Scholar]
- Physical activity patterns in urban neighbourhood parks: insights from a multiple case study. BMC Public Health [Internet]. McCormack GR, Rock M, Swanson K, Burton L, Massolo A. 14:962 doi: 10.1186/1471-2458-14-962. . Available from: http://dx.doi.org/10.1186/1471-2458-14-962 . [DOI] [PMC free article] [PubMed] [Google Scholar]
- The association between sidewalk length and walking for different purposes in established neighborhoods. Int J Behav Nutr Phys Act [Internet]. McCormack GR, Shiell A, Giles-Corti B, et al. 9:92 doi: 10.1186/1479-5868-9-92. . Available from: http://dx.doi.org/10.1186/1479-5868-9-92 . [DOI] [PMC free article] [PubMed] [Google Scholar]
- Gunn LD, Lee Y, Geelhoed E, Shiell A, Giles-Corti B. The cost-effectiveness of installing sidewalks to increase levels of transport-walking and health. Prev Med. 2014;67:322–9. doi: 10.1016/j.ypmed.2014.07.041. [DOI] [PubMed] [Google Scholar]
- Lim S, Wyker B, Bartley K, Eisenhower D. Measurement error of self-reported physical activity levels in New York City: assessment and correction. Am J Epidemiol. 2015;181((9)):648–55. doi: 10.1093/aje/kwu470. [DOI] [PMC free article] [PubMed] [Google Scholar]
- Blumberg SJ, Luke JV, Cynamon ML. Telephone coverage and health survey estimates: evaluating the need for concern about wireless substitution. Am J Public Health. 2006;96((5)):926–31. doi: 10.2105/AJPH.2004.057885. [DOI] [PMC free article] [PubMed] [Google Scholar]
- Mayne SL, Auchincloss AH, Michael YL. Impact of policy and built environment changes on obesity-related outcomes: a systematic review of naturally occurring experiments. Obes Rev. 2015;16((5)):362–75. doi: 10.1111/obr.12269. [DOI] [PMC free article] [PubMed] [Google Scholar]
- GIS measured environmental correlates of active school transport: a systematic review of 14 studies. Int J Behav Nutr Phys Act [Internet]. Wong BY, Faulkner G, Buliung R. 8:39 doi: 10.1186/1479-5868-8-39. . Available from: http://dx.doi.org/10 .1186/1479-5868-8-39 . [DOI] [PMC free article] [PubMed] [Google Scholar]
- Hall KS, McAuley E. Individual, social environmental and physical environmental barriers to achieving 10 000 steps per day among older women. Health Educ Res. 2010;25((3)):478–88. doi: 10.1093/her/cyq019. [DOI] [PMC free article] [PubMed] [Google Scholar]
- Learnihan V, Van Niel KP, Giles-Corti B, Knuiman M. Effect of scale on the links between walking and urban design. Geogr Res. 2011;49((2)):183–91. [Google Scholar]
- Jankowska MM, Schipperijn J, Kerr J. A framework for using GPS data in physical activity and sedentary behavior studies. Exerc Sport Sci Rev. 2015;43((1)):48–56. doi: 10.1249/JES.0000000000000035. [DOI] [PMC free article] [PubMed] [Google Scholar]