

Summary
Adipocytes sense systemic nutrient status and systemically communicate this information by releasing adipokines. The mechanisms which couple nutritional state to adipokine release are unknown. Here, we investigated how Unpaired 2 (Upd2), a structural and functional ortholog of the primary human adipokine Leptin, is released from Drosophila fat cells. We find that GRASP, an unconventional secretion pathway component, is required for Upd2 secretion. In nutrient rich fat cells, GRASP clusters in close proximity to apical side of lipid droplets (LDs). During nutrient deprivation, Glucagon mediated increase in Calcium (Ca2+) levels, via Calmodulin kinase II (CaMKII) phosphorylation, inhibits proximal GRASP localization to LDs. Using a heterologous cell system, we show that human Leptin secretion is also regulated by Ca2+ and CaMKII. In summary, we describe a mechanism by which increased cytosolic Ca2+ negatively regulates adipokine secretion and have uncovered an evolutionarily conserved molecular link between intracellular Ca2+ levels and energy homeostasis.
eTOC blurb
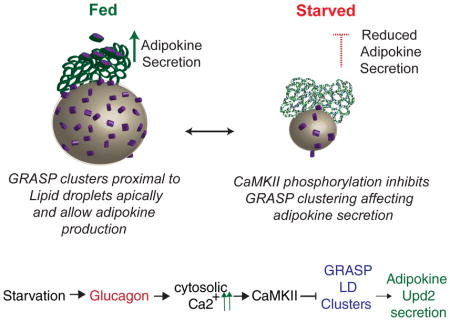
Rajan et al. identify a mechanism coupling nutrient status to adipocyte-mediated adipokine secretion involving Glucagon-mediated calcium signaling and GRASP, an unconventional secretion protein. In fly fat cells, Leptin ortholog Upd2 is associated with GRASP near lipid droplets and upon nutrient deprivation, increased calcium levels negatively regulates adipokine secretion via GRASP.
Introduction
Energy homeostasis is the ability of organisms to sense nutrient flux, and alter both physiology and behavior, enabling the maintenance of certain physiological parameters, such as blood glucose and fat stores, within a permissible range. Dysfunctional energy homeostasis underlies a number of chronic health disorders, in particular, obesity, anorexia and diabetes. Reliable systemic communication of energy stores is key to ensuring robust energy homeostasis.
Adipose tissue, composed of adipocytes, is an endocrine organ whose primary role is energy storage. A significant portion of energy stores is comprised of the neutral lipid triacylglycerol (TAG), contained in a specialized intra-cellular organelles termed lipid droplets (LDs) (Walther and Farese, 2012).
A key property of adipocytes is their dynamic response to an organism’s systemic energy state. Under a positive nutritional state, lipids are stored as TAG, and in low energy states TAG is mobilized to generate free fatty acids (Duncan et al., 2007) that fuel the organism. This dynamic regulation is made possible by the ability of adipocytes to respond to anabolic hormones such as insulin and catabolic hormones such as glucagon that promote lipogenesis and lipolysis, respectively.
Adipocytes not only respond to insulin and glucagon but also communicate their stored energy reserves systemically by secreting proteins, referred to as adipokines (Trayhurn and Beattie, 2001). These include cytokines such as TNF-α and Adiponectin(Scherer et al., 1995) that act in other peripheral tissues to regulate energy metabolism, and the peptide hormone Leptin (Zhang et al., 1994) which impinges on central brain circuits to regulate appetite and energy expenditure (Flak and Myers, 2015; Morton et al., 2006). Thus, energy homeostasis is maintained by a complex interplay between hormonal systems, with adipocytes playing an integral role in both sensing systemic nutritional state, and by communicating total energy stores to the organism. Mutations of Leptin or its receptor are associated with severe obesity in humans (Farooqi and O’Rahilly, 2009; Montague et al., 1997), highlighting the key role played by this signaling axis in maintenance of energy homeostasis. Leptin production in response to total stored energy is regulated at the level of both translation and secretion (Barr et al., 1997b; Fried et al., 2000; Lee and Fried, 2006; Lee et al., 2007). However, the molecular mechanisms underlying how energy sensing is coupled to Leptin secretion are poorly understood (Dugail and Hajduch, 2007).
In Drosophila, the functional ortholog of Leptin are the Unpaired cytokines (Upd1 and Upd2). While neuronal derived Upd1 regulates feeding behavior by inhibiting the food-seeking neuropeptide-Y (NPY) circuit (Beshel et al., 2017), Upd2 is a secreted factor produced from the fat body in response to dietary fat and sugars (Rajan and Perrimon, 2012). The physiological roles of Upd2 and Leptin are similar in the context of response to nutrient deprivation and energy sensing. For example, both Upd2 and Leptin are upregulated by increased fat stores, and downregulated by reduced systemic nutrient levels. In mice, Leptin downregulation during starvation is required for increasing survival capacity of the organism under adverse nutrient conditions (Ahima et al., 1996). Consistent with this, upd2 mutants are starvation resistant (Rajan and Perrimon, 2012). Hence, the ancestral role of Leptin and Upd2 likely arose from the need to remotely signal systemic nutrient status (Flier and Maratos-Flier, 2017). This functional conservation, along with the genetic tractability of Drosophila, makes this an ideal system in which to study the mechanisms linking energy store sensing and adipokine secretion.
Our studies, in Drosophila adult fat body cells, reveal that Upd2 is secreted via a Golgi bypass mechanism mediated by Golgi reassembly stacking protein (GRASP), a component involved in non-conventional protein secretion (Kinseth et al., 2007). GRASP mutants display systemic energy storage defects that resemble loss of Upd2, consistent with the role of GRASP in Upd2 secretion. Importantly, we find that GRASP apico-basal localization and phosphorylation is sensitive to nutrient state, and regulated by Adipokinetic hormone (AKH), the Drosophila functional analog of glucagon (Kim and Rulifson, 2004), signaling. Increased cytosolic Ca2+ concentrations and Ca2+ sensing Calmodulin kinase II (CaMKII) activity affect Upd2 secretion. Thus, we have uncovered a molecular link showing how the second messenger Ca2+ negatively regulates adipokine secretion in Drosophila fat cells.
Results
Upd2 is secreted by an unconventional secretion pathway mediated by GRASP
To investigate how Upd2 secretion is regulated by nutrients, we set out to identify which secretory route is required for Upd2 production. We used Drosophila S2R+ cells which have been used previously to characterize genes involved in secretion (Bard et al., 2006; Kondylis et al., 2011), JAK/STAT signaling (Baeg et al., 2005) and LD biology (Guo et al., 2008). Specifically, we assayed GFP-tagged Upd2 secretion (upd2::GFP) which is functional and capable of activating the STAT receptor (Hombria et al., 2005; Rajan and Perrimon, 2012; Wright et al., 2011).
Most secreted proteins are transported from the endoplasmic reticulum (ER) to the Golgi. We used three different assays in S2R+ cells to determine whether Golgi function was required for Upd2 secretion. We treated cells with the fungal toxin Brefeldin A1 (BFA), which disrupts Golgi recruitment (Lippincott-Schwartz et al., 1989). Upd2 was detectable in the media from S2R+ cells treated with BFA (Figure 1A), whereas the positive control Spitz, an EGF-like ligand whose trafficking via Golgi is required for its secretion (Lee et al., 2001), was detected at reduced levels (79% reduction) in the media. Next, we tested whether Upd2 secretion was sensitive to Endoglycosidase H (Endo H) (Maley et al., 1989), which removes specific N-linked glycans added in the ER. Proteins that pass through the Golgi acquire resistance to Endo H due to glycans added only in the Golgi. Upd2 was sensitive to Endo H, as shown by a mobility shift in PAGE (Figure S1), suggesting that it is not secreted by the conventional Golgi pathway. Finally, we asked whether Upd2 secretion was dependent on the intra-Golgi SNARE proteins Syntaxin5 (Dascher et al., 1994) and Rab2 (Friggi-Grelin et al., 2006), which are both required for anterograde transport from the Golgi. Strikingly, Upd2 secretion was not impaired in cells with either Syntaxin5 or Rab2 knockdown (Figure 1B). Also unexpectedly, Upd2 secretion is significantly upregulated when Golgi based anterograde transport is inhibited by BFA treatment (Figure 1A) or genetic disruption of anterograde transport (Figure 1B). Such an observation has been reported for proteins which adopt a non-traditional secretion route (Tveit et al., 2009). Taken together, these data suggest that Upd2 secretion bypasses the Golgi and instead depends on the unconventional secretion pathway. Hence, we examined if Upd2 requires GRASP, an evolutionarily conserved protein that mediates unconventional secretion in organisms ranging from amoeba to humans (Dupont et al., 2011; Gee et al., 2011; Kinseth et al., 2007; Manjithaya et al., 2010; Schotman et al., 2008). While there are two forms of GRASP in mammals, GRASP55 and GRASP65, Drosophila has a single ortholog dGRASP, which we refer to as GRASP. We observed that dsRNAs against GRASP cause significant reduction in Upd2 secretion (Figure 1B), strongly suggesting that GRASP is required for Upd2 secretion by the unconventional route.
Figure 1. Drosophila Upd2 adopts an unconventional secretion route mediated by GRASP.

(A) Quantification of normalized fold change in secreted GFP signal detected by GFP sandwich ELISA assay performed on conditioned media of S2R+ cells. Cells were transfected with spitz::GFP and Upd2::GFP, and treated with Brefeldin A1 (17.85μM) or DMSO (Control) for 18 hrs.
(B) Normalized fold change of secreted Upd2::GFP assayed by GFP sandwich ELISA assay from conditioned media of S2R+ transfected cells treated with Upd2::GFP and dsRNAs [dsRNA LacZ (control) or dsRNAs targeting syntaxin-5, Rab2 and GRASP.
Error bars represent %SD (Standard Deviation). Statistical significance quantified by t-test on 6 biological replicates per condition. *p<0.1 in (A) and *p<0.01 in (B). See also Figure S1.
Drosophila GRASP, via its role in Upd2 secretion, affects systemic lipid homeostasis
To further examine the relationship between GRASP and Upd2, we generated a GRASP mutant, GRASP-del, using the CRISPR/Cas9 technology (see Experimental Procedures and Figure S2A). GRASP-del homozygous mutant flies do not produce GRASP protein (Figure S2B) and are viable and fertile, although they exhibit a slight developmental delay.
The requirement for GRASP in Upd2 secretion in S2R+ cells led us to test the physiological role of GRASP in energy balance. The primary metabolic phenotype of Upd2 is a significant reduction in stored fat, i.e., triacylglycerol (TAG) levels. Hence, we assayed relative normalized TAG levels in GRASP-del mutants compared to a background matched control. As predicted, homozygous GRASP-del and trans-heterozygous GRASP/Deficiency animals show a significant reduction in TAG levels (Figure 2A), reminiscent of the reduction in energy stores observed in upd2 mutants (Rajan and Perrimon, 2012).
Figure 2. Drosophila GRASP, via its role in Upd2 secretion, affects systemic lipid homeostasis.

(A–D) Normalized triacylglycerol (TAG) levels in adult Drosophila males relative to controls. A) Control (Cas9/CRISPR background strain) compared to heterozygous GRASP deletion strain (GRASP-del/+), homozygous GRASP deletion (GRASP-del) and trans-heterozygotes GRASP deletion (GRASP-del/Df). The two deficiencies, Df(3L)BSC552 and Df(3L)BSC445, uncover the cytological region of GRASP. (B) Fat cell specific GRASP knockdown, using three independent transgenic strains (GRASP-RNAi), compared to control (GFP-RNAi). (C) Fat cell specific over-expression of GFP tagged GRASP (GRASP::GFP) and control transgene (GFP) in GRASP deletion (GRASP-del) background, relative to triglyceride levels of control (Cas9/CRISPR background strain). (D) Effect of fat cell specific Upd2 overexpression (UAS-Upd2) relative to GFP overexpression (UAS-GFP) in GRASP knockdown strains (GRASP-RNAi), compared to control (Luciferase-RNAi).
(E) Confocal images showing single optical section (XY slice) and projection of numerous optical slices (XY projection) of Drosophila adult fat cells expressing of Upd2::tagRFP-T (green). To identify the difference between GRASP knockdowns (GRASP-RNAi) versus control (GFP-RNAi), accumulation of Upd2 (green) in fat cells is assayed by confocal image analysis. Quantification of total Upd2 signal in fat cells shows a significant increase in Upd2 signal in GRASP knockdown. Scale bar – yellow line- represents 5μM.
(F) Projection of optical XY sections of insulin producing cells (IPCs) in the Drosophila adult brain stained with an antibody against Drosophila insulin (Dilp5) in control (Lpp-Gal4> UAS-GFP-RNAi background) and fat specific GRASP-knockdown (Lpp-Gal4>UAS-GRASP-RNAi). Quantification of the relative change in total Dilp5 fluorescence in IPC cell bodies from images acquired under the same conditions from control and two independent transgenic strains (GRASP-RNAi). Scale bar- yellow line- represents 10μM.
(G) Quantification of normalized TAG levels in flies that have insulin neuron specific expression of a control transgene (GFP), or transgene that activates neurons (TrpA1) in GRASP-del background, relative to control (Cas9/CRISPR background strain).
Error bars represent %SD. Statistical significance quantified by t-test on 3–6 biological replicates per condition for TAG assays, and 7–10 animals for image acquisition experiments. P-values for each experiment are indicated in graphs. See also Figure S2.
Removal of upd2 specifically in fat cells is sufficient to reduce fat stores, while its removal in other tissues, such as the muscle, has no effect on energy stores (Rajan and Perrimon, 2012). Therefore, we next asked whether the role of GRASP in maintaining energy balance is also fat tissue specific and phenocopies upd2. Knockdown of GRASP specifically in fat cells, using three independent GRASP-RNAi lines, significantly reduced TAG levels, whereas knockdown of GRASP in muscles (Mhc-Gal4>GRASP-i) did not affect fat storage (Figure S2C). These data suggest that GRASP plays a fat cell specific role in the maintenance of lipid stores, a phenotype consistent with a role in mediating Upd2 secretion.
In order to establish a fat cell specific role of GRASP in maintaining lipid stores, we determined whether the TAG storage defect in GRASP-del homozygous mutants (Figure 2A) could be rescued by fat tissue specific expression of GRASP. We generated flies that expressed a GFP-tagged GRASP transgene (UAS-GRASP::GFP) only in fat cells of GRASP-del mutant flies. This was sufficient to rescue the fat storage defect of GRASP-del mutants (Figure 2C), strongly suggesting that GRASP regulates fat stores primarily via its activity in fat cells. Note the variability in GRASP-del fat storage levels between the two datasets (Figure 2A and 2C). This is an age-dependent effect of the fat storage phenotype in GRASP-del mutants. For initial analysis of GRASP-del mutants, fat storage was assessed on Day 7 (Figure 2A). As we progressed in our phenotypic characterization, we found that the fold change in TAG stores, for both Upd2-del and GRASP-del, was more pronounced with age. Hence, we performed the rescue experiments under more stringent conditions by testing TAG storage rescue at a 15 day time point (Figure 2C).
To establish whether GRASP plays a role in Upd2-mediated lipid storage, we tested the requirement of GRASP for the increase in stored fat levels associated with Upd2 overexpression (Figure 2D). RNAi-mediated knockdown of GRASP suppressed the effect of Upd2 over-production on fat storage (Figure 2D), strongly suggesting that GRASP function is required for the effect of Upd2 on systemic fat storage.
Similar to how insulin accumulation in insulin producing cells (IPCs) is used as a read out for circulating insulin levels [(Geminard et al., 2009); see discussion], we tested the level of Upd2 accumulation in fat cells in which GRASP levels are reduced by RNAi. Consistent with the hypothesis that GRASP is required for Upd2 secretion in vivo, we observed an increase in Upd2 accumulation in Lpp-Gal4::GRASP-RNAi fat cells (Figure 2E). Based on this result (Figure 2E), together with the requirement of GRASP for Upd2 to exert its effect on TAG storage (Figure 2D), and the Upd2 secretion defect upon GRASP removal in S2R+ cells (Figure 1C), we conclude that GRASP mediates Upd2 secretion in Drosophila fat cells.
Upd2 remotely controls insulin secretion from IPCs in the fly brain (Rajan and Perrimon, 2012). Therefore, we assayed whether the defects in fat storage in GRASP mutants result from impaired insulin secretion. We quantified insulin accumulation in IPCs when GRASP was specifically removed from fat cells (Lpp-Gal4>GRASP-RNAi), and observed a significant increase in insulin accumulation from two independent RNAi lines (Figure 2F). In addition, GRASP removal from IPCs themselves did not have an impact on insulin accumulation, suggesting that GRASP plays a non-autonomous role in regulating insulin release (Figure S2F).
To test whether the insulin secretion defect is the primary cause of the lipid storage defects in GRASP mutants, we generated flies in which the IPCs remain depolarized (Dilp-Gal4>UAS-TrpA1) in a GRASP-del mutant background. Strikingly, IPC depolarization resulted in constitutive insulin release, which was sufficient to rescue the fat storage defects of GRASP-del flies (Figure 2G). In addition to fat storage defects, both insulin (Dilp) deletion flies and upd2 null mutants show starvation resistance (Rajan and Perrimon, 2012; Zhang et al., 2009). GRASP-del flies also display a starvation resistance phenotype (Figure S2D). In addition, GRASP does not have a cell autonomous role in the IPCs with respect to fat storage, as IPC-specific GRASP knockdown (Dilp2-Gal4> UAS-GRASP-RNAi) did not cause any fat storage defects (Figure S2E). Altogether, these results suggest that GRASP is required for Upd2-mediated insulin release. Our observations are consistent with a model where GRASP plays a role in Upd2 secretion from fat tissue, which in turn impinges on remote regulation of insulin release from the brain, thus regulating systemic lipid homeostasis.
GRASP phosphorylation in Drosophila adult fat cells is nutrient sensitive and regulated by CaMKII
Given the involvement of GRASP in Upd2 secretion, a protein which signals systemic nutrient state, we tested whether GRASP itself, similar to Upd2 is regulated in a nutrient sensitive manner. Prior work on GRASP regulation during mitosis revealed that a primary mode of GRASP regulation is its phosphorylation by mitotic kinases such as Cdc2 and polo kinase (Wang et al., 2005; Yoshimura et al., 2005). Hence, we speculated that GRASP phosphorylation state could be contingent on systemic nutrient status, regulated by nutrient sensitive kinases. To test this, we expressed the 92 kDa GFP-tagged GRASP in Drosophila adult fat cells and assessed its phosphorylation status using phosphoprotein stains and Western blots of lysates from fed and starved states). In three independent experiments, under starvation conditions, GRASP protein levels slightly decreased, and GRASP phosphorylation increased (Figure 3A, S3A, 3B, S3D). Note that for this analysis we used a tagged form of GRASP, UAS-GRASP::GFP that can rescue the metabolic phenotypes of GRASP-del (Figure 2C), as it permits us to probe GRASP phosphorylation status during systemic nutritional change in a tissue-specific manner. In addition, we focused our analysis in fat tissues because removal of GRASP in other cells and tissues did not impact energy physiology (Figure S2C, E). Altogether, our observations (Figure 3A, S3A, 3B) suggest that GRASP protein levels and phosphorylation are regulated by systemic nutrient state in fat tissues.
Figure 3. GRASP phosphorylation in Drosophila adult fat cells is nutrient sensitive and regulated by CaMKII.

(A) Protein lysates from flies expressing GFP tagged GRASP specifically in fat cells. 25μg of protein was loaded per lane from flies subjected to starvation versus those fed ad libitum. The Western blot was stained with ProQ®-Diamond phosphoprotein stain and laser scanned (see Experimental Procedures) to identify protein bands that specifically fluoresce when phosphoproteins are present. Compare the change in the 92kDA GRASP band between fed and starved states. The same blot is probed with anti-GRASP antibody which recognizes GRASP::GFP band at 92kDa. See figure S3A for control ProQ®-Diamond phosphoprotein stain and anti-GRASP blots with lysates treated with lambda phosphatase.
(B) In vivo test to assay the effect of CaMKII on GRASP phosphorylation in fat cells. 25μg of protein lysates from flies expressing GFP tagged GRASP in fat tissue together with different CaMKII transgenes - CaMKII constitutively active (CaMKII-CA TtoD-lane 1), CaMKII dominant negative (CaMKII-DN TtoA-lane 2), and CaMKII wild type (CaMKII-WT -lane 3) - were Western blotted and stained with ProQ®-Diamond phosphoprotein stain (see Experimental Procedures). In addition, lysates from GRASP::GFP expressing flies, subject to ad libitum feeding (lane 4) or starvation (lane 5), were probed for altered phosphorylation using ProQ®-Diamond phosphoprotein stain. Note that lysates from CaMKII constitutive activation (lane 1) showed increased phosphorylation signature, similar to starved flies (lane 5). The same blot was probed with anti-GRASP antibodies. Note that the total GRASP level remains unaltered in the context of CaMKII activation (lane 1) or inhibition (lane 2), compared to control (lane 3) - whereas a slight reduction in GRASP levels were observed during starvation (lane 5). See S3D for control MemCode®-total protein stain and anti-Lsp1-gamma blots serving as loading control of another fat protein.
(C) In vitro kinase assay of Drosophila GRASP (6XHis-MBP::GRASP) incubated with CaMKII (see Experimental Procedures). The mock control (−) and experimental (+) reactions were probed for changes in phosphorylation using ProQ®-Diamond phosphoprotein stain (a) and with an anti-phospho-Threonine antibody (b). A significant increase in phosphorylation is detected when GRASP is incubated with CaMKII. Blots were probed with anti-GRASP antibody to test for equal loading. Note that the CaMKII auto-phosphorylation band is detected with anti-phospho-threonine (b).
(D) Quantification of normalized TAG levels in flies with fat cell specific expression of CaMKII variant transgenes. Note the significant reduction in stored fat when the CaMKII constitutively active form is expressed (CaMKII-CA). P-values are based on two tailed t-test, and error bars represent % standard deviation. 3 biological replicates were used per data point.
(E) Representative images at an apical section of adult fat tissue from flies expressing GFP tagged GRASP together with different CaMKII transgenes- CaMKII wild type (CaMKII-WT –a′, a″), CaMKII dominant negative (CaMKII-DN –b′, b″), and CaMKII constitutively active (CaMKII-CA –c′, c″). White arrows point to GRASP clustered apical localization. The intensity of GRASP is represented in a″–c″ [see look up table (LUT)]. Note that acute CaMKII inhibition results in a significant increase of GRASP apical localization (b′, b″) compared to control (a′, a″). GRASP apical localization is undetectable in the context of CaMKII constitutive activation (c′, c″).
(F) Ex vivo assay to test the effect of acute CaMKII inhibition on GRASP hub formation. Confocal images captured at an apical plane from fat explants of flies expressing GFP tagged GRASP in fat tissues. Explants were cultured for 15 minutes prior to imaging with control drug [inactive CaMKII inhibitor KN92 (a′, a″)] or with CaMKII inhibitor (b′, b″ - KN93). Note the striking expansion of GRASP apical localization (white arrows) at the LD periphery in the context of acute CaMKII inhibition. The intensity of GRASP is represented in a″, b″ (see look up table (LUT).
(G) Drosophila fat cells expressing GFP tagged GRASP WT (a′, a″) and putative phosphomimetic for CaMKII GRASP (b′, b″). (a′, b′) XY projections of all planes through a confocal Z-stack. (a″, b″). The mean grey values of GRASP::GFP in the entire Z-stack of fat tissue in both WT (a′) and phosphomimetic (b′) in a sample set of 4 animals per genotype is comparable. Average Mean grey value: WT (a′) = 23.6 and phosphomimetic (b′) = 20.7 (p-value in 2 tailed t-test= 0.38, indicating not a significant difference). This is consistent with the observation that CaMKII over-activation does not alter GRASP protein level (compare 3B lane 1 and lane 3). These data indicate that CaMKII mediated phosphorylation affects the ability of GRASP to exhibit a clustered localization at LD and membrane. Single XY slice images of confocal micrographs acquired at an approximate depth of 3.5μM from the apical surface of fat cells expressing GFP tagged GRASP WT (a″) and and putative phosphomimetic GRASP (b″). Yellow arrows point to LD-associated GRASP clusters; pink arrows to membrane associated; white arrows to punctate localization. Note the absence of GRASP membrane and cluster localization in the GRASP putative phosphomimetic versions (b′, b″). See S3F for a montage view of XY-slices through a Z-stack in order to represent a sample of apical XY slices from 2–6μM. The intensity of GRASP is represented in a″, b″ [see look up table (LUT)]. Note that the CaMKII phosphomimetic mutant GRASP transgene (3G b′, b″) phenocopies GRASP localization in fat tissues when CaMKII is constitutively activated (3E c′, c″). See S3E for Clustal W alignment of Drosophila GRASP with mammalian GRASP 55 and 65, used for prediction of conserved CaMKII phosphorylation sites.
Note that in Figures 3E–G yellow scale bar represents 5μM. See also Figure S3.
In order to identify which proteins interact with GRASP in a nutrient dependent manner, we performed label free semi-quantitative mass spectrometry (mass-spec) on GRASP immunoprecipitated (IP) from adult Drosophila fat tissues obtained from flies which were fed ad libitum or starved (Figure S3B). We analyzed mass-spec datasets from four independent IP-mass-spec experiments, done in triplicate, to identify interactors. Two kinases, the intracellular calcium (Ca2+) sensing kinase CaMKII (Figure S3C) and diacylglycerol sensing kinase PKC-D, had differential spectral counts between fed and starved states. We focused on CaMKII because we recovered a number of Ca2+ sensing and binding proteins as GRASP interactors (Figure S3C).
We assayed the effect of CaMKII on GRASP phosphorylation in vivo in fat cells and engineered flies expressing wild-type (WT), constitutively active (CA) and dominant negative (DN) forms of CaMKII (Koh et al., 1999) in fat cells that also expressed GFP-tagged GRASP. Note that since constitutive expression of these transgenes in fat cells produced lethality, we expressed them using the tubGal80ts system from day 5–10 and then assayed the effect on GRASP. Protein lysates were probed for alterations in the phosphorylation state of the 92 kDa GRASP::GFP band (Figure 3B- lane 1, 2, 3). For comparison to altered systemic nutrient state, we also prepared protein lysates from GFP-tagged GRASP expressing flies that were fed ad libitum or starved (Figure 3B- lane 4, 5). We observed increased phosphoprotein staining of the GRASP::GFP band from flies expressing constitutively active CaMKII (Figure 3B-lane 1), which is comparable to the increased phosphoprotein stain observed in the starved state (Figure 3B- lane 5). The same blot was probed with anti-GRASP. Whereas starvation affects both GRASP protein level and its phosphorylation state (Figure 3A, 3B-lanes 4, 5), the GRASP::GFP protein levels in all three CaMKII transgenes were comparable (Figure 3B lane 1–3). This suggests that CaMKII activation or inhibition does not change total GRASP::GFP protein levels but only the GRASP phosphorylation state (See also companion Figure S3D for loading controls).
We confirmed that Drosophila GRASP is a CaMKII substrate by performing in vitro kinase assays using recombinant Drosophila GRASP incubated with activated CaMKII. The reaction product, after Western blotting using both phosphoprotein staining (Figure 3Ca) and anti-phospho-Threonine (Figure 3Cb), revealed a strong phosphorylation signature only in the experimental incubation (Figure 3C). Taken together, these data suggest that GRASP is a target of CaMKII in Drosophila fat cells, and that phosphorylation by CaMKII does not increase or decrease GRASP protein levels.
Given that GRASP is a CaMKII target (Figure 3B, C), and that lack of GRASP activity in fat cells results in reduced stored fat levels (Figure 2A, B), we investigated whether genetically altering CaMKII activity in fat cells had an impact on TAG levels. Thus, we compared the levels of fat when CaMKII-DN or CaMKII-CA transgenes were expressed in fat tissue with the CaMKII-WT control (Koh et al., 1999). Activation of CaMKII significantly reduced fat stores (Figure 3D). While this is likely due to its effect on numerous downstream targets, it resembles the effect on fat stores in a starved state as well as phenocopies loss of GRASP or upd2.
Next, we expressed WT, CA, or DN forms of CaMKII (Figure 3E) and examined how GRASP::GFP expression in fat tissues was affected. We imaged tissues under the same conditions and at the same depth from apical surfaces (4μM). The expression of CaMKII-DN caused a significant increase in GRASP intensity (Figure 3E b′, b″) compared to wild-type control (Figure 3E a′, a″ - see look up table (LUT)), while constitutive activation of CaMKII-CA was associated with decreased GRASP intensity (Figure 3E c′, c″). However, as phosphorylation by CaMKII does not increase or decrease GRASP protein levels (Figure 3B- lane 1–3), and that molecular brightness analysis of EGFP tagged proteins has been used as a measure of aggregation state of proteins, such as nuclear receptors (Chen et al., 2003), it suggests that alterations in GRASP intensity represent the extent of GRASP oligomerization in response to phosphorylation by CaMKII. This observation is reminiscent of the role of phosphorylation by other kinases that regulate GRASP oligomerization during mitosis (Wang et al., 2005; Yoshimura et al., 2005).
To further test whether CaMKII acutely regulates GRASP clustering, we performed a CaMKII inhibition ex vivo assay in which we cultured adult fly fat tissue explants expressing GFP-tagged GRASP in the presence of the CaMKII inhibitor KN93 briefly (15 minutes) and imaged fat tissues. CaMKII inhibition within 15 minutes significantly increased GRASP intensity (Figure 3F b′). Given the brief period in which we observe this effect, it is unlikely to be a result of increased GRASP protein production, but instead clustering of GRASP that produces a brighter intensity signal (Chen et al., 2003). This model is consistent with our observations that manipulating CaMKII does not affect GRASP protein levels but only its phosphorylation status (Figure 3B).
CaMKII has potentially two phosphorylation motifs (RXXS/T) on Drosophila GRASP. This motif is also conserved in human GRASP55 protein (T83 and T270- see sequence alignment Figure S3E). We generated GRASP::GFP transgenic flies in which these two putative phosphorylation sites are mutated [Threonine (T) to Aspartate (D)] to mimic a constitutively phosphorylated state, i.e., phosphomimetic versions. Next, we assayed how these point mutations affect GRASP localization in fat cells. The XY projection of Z stacks (Figure 3G a′, b″) and montage of XY-slices (Figure S3Fa, b) show that GRASP-phosphomimetic is expressed, but is excluded from clusters and membrane, and largely present in the punctate fraction. The punctate expression of GRASP phosphomimetic version (3G-b′, b″) phenocopies GRASP localization under a CaMKII constitutively active state (Figure- 3Ec′, c″). The mean grey values of GRASP::GFP in the entire Z-stack of fat tissue is comparable between GRASP wildtype (a′) and GRASP phosphomimetic (b′). Specifically, in a sample set of 4 animals per genotype, average mean grey values of wildtype (3Ga′=23.6) and phosphomimetic (3Gb′= 20.7) are not significant different (p-value in 2 tailed t-test= 0.38). These data indicate that CaMKII mediated phosphorylation does not affect GRASP protein levels, but affects GRASP phosphorylation. In summary, in the fly fat, we have strong evidence supporting the model that CaMKII mediated phosphorylation negatively regulates GRASP apical localization and clustering.
Cytosolic Ca2+ downstream of AKH regulates GRASP localization and Upd2 secretion
Next, we asked whether there was a specific molecular connection between CaMKII and the nutrient deprived state. Glucagon, the catabolic hormone which is the primary mediator of the starvation response, increases cytosolic Ca2+ levels by activating the Inositol phosphate 3-Receptor (IP3R) channel on the ER (Burgess et al., 1984). in some contexts CaMKII is activated by Glucagon (Ozcan et al., 2013; Ozcan et al., 2012). Thus, we tested whether Glucagon-like signaling in flies couples systemic energy status with Upd2 secretion.
In fat cells, Adipokinetic hormone (AKH), the Drosophila functional analog of glucagon (Kim and Rulifson, 2004), signals through the AKH-receptor (AKHR) (Gronke et al., 2007) to control lipolysis in response to starvation. Similar to prior work, we found that flies were unable to breakdown stored fat during starvation when AKHR was removed from fat cells (Figure S4A). We examined the presence of GRASP apical clustered localization during starvation in fat cells that lack AKHR (Figure 4A), and observed that GRASP continues to be present in apical sections even under starvation conditions (Figure 4Ad), whereas it is not present in controls (Figure 4Ab). Given that affecting the AKH response in fat cells is sufficient to retain GRASP apical localization in starved flies. Thisit suggests that GRASP responds to systemic energy state downstream of Glucagon-like signaling.
Figure 4. Intracellular Ca2+ levels affect GRASP localization in fat cells and Upd2 secretion.

(A) Representative confocal images from adult fly fat cells expressing GFP tagged GRASP with fat-cell specific reduction in the receptor for fly glucagon, adipokinetic hormone receptor (AKHR) (AKHR-RNAi), compared to control (GFP-RNAi). Compare the presence of clustered GRASP apical localization (arrow) in fed conditions (a, c) with starved conditions (b, d). Note the continued presence of apically localized GRASP in AKHR knockdown (d) in starved conditions compared to control (b). Note that images acquisition for all was performed with the same settings. See also Figure S4A which shows that flies with AKHR knockdown in fat cells are unable to breakdown triglyceride stores on starvation. Yellow scale bar represents 5μM.
(B) Representative images from an apical section of adult fly fat cells expressing GFP tagged GRASP with fat-cell specific reduction in the endoplasmic reticulum (ER) Inositol-3-phosphate receptor (IP3R) (IP3R-RNAi) compared to control (GFP-RNAi). Compare the presence of GRASP apical structures (arrow) in fed (a, c) versus starved (b, d) conditions. Note the continued presence of GRASP apical localization in IP3R knockdown (d) in starved conditions compared to control (b). The effect of IP3R removal on GRASP hubs during starvation (Bd) is similar to AKHR knockdown (Ad). See also Figure 4C showing that flies with IP3R knockdown in fat cells are unable to breakdown triglyceride stores under starvation conditions. Yellow scale bar represents 5μM.
(C) Quantification of relative normalized TAG levels in starved flies compared to fed state, with fat cell specific knockdown of two independent IP3R knockdown (IP3R-RNAi) and control (GFP-RNAi). Note that the starved control has significantly reduced fat content compared to IP3R-RNAi flies that exhibit defects in fat breakdown upon starvation.
(D) Effect of fat cell specific Upd2 overexpression (UAS-Upd2) relative to GFP overexpression (UAS-GFP) in IP3R knockdown strains (IP3R-RNAi), compared to control (Luciferase-RNAi). Relative normalized TAG levels are quantified. Note that IP3R removal in fat cells causes a 3–5 fold increase in fat stores compared to control in GFP overexpression background. IP3R knockdown in an Upd2 overexpression background does not significantly increase fat stores relative to control RNAi. 3 biological replicates per data point, error bars represent %SD. 2-tailed t-test was performed to determine statistical significance.
(E) Quantification of normalized fold change in secreted GFP signal detected by GFP sandwich ELISA assay performed on conditioned media of S2R+ cells transfected with Upd2::GFP and treated with DMSO (Control) or BAPTA-AM(5μM), Ionomycin(5μM), U73122(2μM), and KN93(100nM) for 18 hrs. Error bars represent %SD. Statistical significance quantified by t-test on 6 biological replicates per condition. **p<0.01, *p<0.025. Refer to companion Figure S4 for effect of Ca2+ drugs on Upd2 and GRASP transcription.
See also Figure S4.
Next, we tested whether cytosolic Ca2+ influx due to Glucagon-like signaling acts as a second messenger in terms of relaying AKH signal to GRASP. We assayed the effect of reducing the function of IP3R, the ER Ca2+ channel that responds to AKH, and observed that RNAi of IP3R in fat cells resulted in continued presence of GRASP clusters (Figure 4B). These results provide evidence for the role of cytosolic Ca2+, downstream of Glucagon-like signaling, in regulating GRASP localization during nutrient deprivation.
Previous studies have reported that flies mutant for IP3R are obese and do not breakdown lipid stores during starvation (Subramanian et al., 2013); however, it is unclear whether this is due to a fat cell specific role of IP3R. We examined the effect of starvation on TAG levels in flies with fat cell-specific IP3R knockdown and observed that they were unable to breakdown fat stores (Figure 4C), resembling upd2 over-expression in the fat body (Rajan and Perrimon, 2012). This suggests an antagonistic link between increased cytosolic Ca2+ levels and Upd2 action on fat storage. To test whether Upd2 and IP3R affects the same fat storage pathway, we compared the fold change in fat storage of IP3R knockdown in flies over-producing Upd2 versus a heterologous protein (GFP). While IP3R knockdown flies are obese (3.5–5 fold increase in fat stores) in comparison to control flies in a normal background (Figure 4Da), overproduction of upd2 in IP3R knockdown flies did not significantly increase their fat stores (Figure 4Db), suggesting that Upd2 acts downstream of IP3R. In order to test the effect of cytosolic Ca2+ on Upd2 secretion, we used S2R+ cells as it is not technically feasible to assay Upd2 secretion in adult fly hemolymph. Upd2 is secreted constitutively by S2R+ cells (Hombria et al., 2005; Wright et al., 2011) most likely because S2R+ cells lacks the components to respond to Glucagon/AKH signaling [fly Glucagon AKH expression amount =0.639, and the Glucagon receptor AKHR= 0.000 based on RNAseq analysis data from modENCODE project (Hu et al., 2017)]. But S2R+ cells express Ca2+ signaling components such as IP3R and CaMKII. Hence this cell system allows us to test specific predictions of our model downstream of Glucagon. We altered cytosolic Ca2+ levels and activity by treating S2R+ cells with the Ca2+ chelator BAPTA-AM, phospholipase C (PLC) inhibitor that reduces IP3 levels (U73122) or the CaMKII inhibitor KN93, and observed enhanced Upd2 secretion (Figure 4E). Conversely, treatment with the Ca2+ ionophore Ionomycin, which increases cytosolic Ca2+, impaired Upd2 secretion (Figure 4E). Note that the data is represented as percent change in Upd2 secretion normalized to transfection efficiency (see Method Details) with 0% (DMSO) as baseline. We also tested whether the effects on Upd2 secretion were post-transcriptional. On performing quantitative real time PCR analysis of steady state GRASP and Upd2 levels, we found that BAPTA-AM and KN93 did not affect upd2 and GRASP transcription (Figure S4B). Further, the effect of the PLC inhibitor on transcription was not coupled to its effects on Upd2 secretion or GRASP regulation (Figure S4B). Finally, although the Ca2+ ionophore repressed GRASP transcription, it did not alter upd2 transcription (Figure S4C). Our results on the post-transcriptional effect of cytosolic Ca2+ channel on Upd2 (Figure S4B) are consistent with a report that knockdown of the Drosophila store-operated Ca+ entry regulator (SOCE) dStim does not regulate upd2 transcription (Baumbach et al., 2014). However, we did find that dStim knockdown increased Upd2 secretion (Figure S4D). We propose that increased Upd2 secretion in dStim knockdown explains in part the obese phenotype of dStim mutants (Baumbach et al., 2014). Altogether, we manipulated Ca2+ signaling in S2R+ cells, and show that increased Ca2+ signaling inhibits basal Upd2 secretion.
Upd2 is constitutively secreted, circulating at a ‘basal’ level to indicate a ‘fed’ state systemically. Our results point to a model in which during nutrient deprivation, cells use cytosolic Ca2+ spikes downstream of Glucagon as a negative signal for adipokine secretion.
Human Leptin localizes with GRASP in Drosophila cells and its secretion is regulated via the cytosolic Ca2+ sensing kinase CaMKII
Previously, we showed that Upd2 is an ancestral functional ortholog of human Leptin, specifically in the context of remotely conveying systemic nutrient status (Rajan and Perrimon, 2012). Thus, we examined the cytoplasmic localization of human Leptin (hLeptin) in Drosophila cells and asked if its localization and secretion also requires GRASP.
In lipid loaded S2R+ cells cultured with oleic acid, hLeptin localized to LD periphery and appeared to co-localize with GRASP (Figure 5A). In addition, adding Bafilomycin A1 in S2R+ cells severely impaired hLeptin secretion whereas Brefeldin A1 had no effect (Figure 5B), consistent with our observations for Upd2 secretion (Figure 1A). Further, impairment of conventional secretion by knock down of Syntaxin5 (Syx5) did not reduce hLeptin secretion, and in fact led to upregulation (Figure 5C), whereas knocking down GRASP caused a modest but significant reduction of hLeptin secretion (Figure 5C), indicating that the unconventional secretion machinery is required for hLeptin secretion.
Figure 5. Human Leptin (hLeptin) adopts an unconventional secretion route in Drosophila cells that is regulated by intracellular Ca2+ via CaMKII.

(A) S2R+ cells, loaded with oleic acid for 24 hrs to accumulate LDs, were transiently transfected with GRASP::GFP (green) and human Leptin::RFP (hLeptin, magenta). AaI–AaVII are high magnification confocal micrographs of AaI. hLeptin is observed at the LD periphery (aIII, aVI-yellow arrow). GRASP positive staining is observed at these locations (aII, aV-yellow arrow). Yellow scale bar represents 2μM.
(B) Quantification of normalized fold change in secreted GFP signal detected using a GFP sandwich ELISA assay performed on conditioned media of S2R+ cells transfected with hLeptin::GFP, and treated with DMSO (Control) and drugs Brefeldin A1 (5μM), Bafilomycin A1 (200nM) for 18 hrs. Error bars represent %SD. Statistical significance quantified by t-test on 6 biological replicates per condition.
(C) Relative normalized secreted GFP signal detected by GFP sandwich ELISA assay performed on conditioned media of S2R+ cells incubated with dsRNAs targeting LacZ (control), Drosophila syntaxin 5 (Syx5), or GRASP. Statistical significance quantified by t-test on 6 biological replicates per condition.
(D) Quantification of relative normalized secreted GFP signal detected by GFP sandwich ELISA assay performed on conditioned media of S2R+ cells transfected with hLeptin::GFP and treated with DMSO (Control) and drugs BAPTA-AM(5μM), Ionomycin(5μM), U73122(2μM). Error bars represent %SD. Statistical significance quantified by t-test on 6 biological replicates per condition.
(E) Dose sensitive increase in hLeptin::GFP secretion following CaMKII inhibition in S2R+ cells. Quantification of relative normalized secreted GFP signal detected by GFP sandwich ELISA assay performed on conditioned media of S2R+ cells transfected with hLeptin::GFP and treated with indicated amounts of CaMKII inhibitor KN93. Error bars represent %SD. Statistical significance quantified by t-test on 6 biological replicates per condition.
Finally, we tested the effect of cytosolic Ca2+ on hLeptin secretion by manipulating Ca2+ levels in S2R+ cells expressing hLeptin. Similar to the results with Upd2 (Figure 4E), hLeptin secretion was upregulated by the cytosolic Ca2+ chelator BAPTA-AM but was inhibited by the Ca2+ ionophore Ionomycin, and was upregulated by IP3R inhibition (Figure 5D). In agreement with our results on the role of CaMKII in Upd2 secretion, hLeptin secretion displayed a dose dependent increase during CaMKII inhibition (Figure 5E). Altogether these results show that hLeptin secretion in a heterologous system behaves as Upd2 and is negatively regulated by cytosolic Ca2+ levels and CaMKII.
In adult Drosophila fat cells GRASP and Upd2 are apically enriched in close apposition to lipid droplets
Given that GRASP is required for Upd2 secretion (Figure 1B, 2D) and for Upd2 to exert its physiological effects on fat storage (Figure 2E), we were interested in visualizing GRASP and Upd2 cellular localization in fat cells (see Method Details & Figure S5A). In the subsequent descriptions the term ‘Apical’ refers to the surface of the fat cell that is in contact with the lumen and hemolymph, and ‘Basal’ is the side of the fat cell that is attached to the cuticle (Refer to diagrams in Figure 6, S5A for orientation).
Figure 6. Distribution of tagged GRASP and Upd2 in adult Drosophila fat cells.

Diagram depicts the orientation (XY and XZ) and depth of apical sections (2–4μM) during laser scanning confocal acquisition. Note ‘Apical’ refers to the surface of the fat cell that is in contact with the lumen and hemolymph, and ‘Basal’ is the side of the fat cell which is attached to the cuticle. See diagram in companion Figure S5A for adult Drosophila fat tissue preparation used for imaging.
(A) Single optical section of Drosophila adult fat tissue expressed GFP tagged GRASP (green) stained with anti-perilipin1 (PLIN1) antibody (red). PLIN1 is used as a marker for lipid droplet (LD) surface. (a) Confocal image of a single optical section along the XY axis at the apical side of adult Drosophila fat cells expressing GFP tagged GRASP. Note the wide cytoplasmic distribution of GRASP (see S5B). Box is location of inset shown in (b) and arrows point to location where XZ slice (c) was acquired. GRASP exhibits a wide cytoplasmic distribution, but exhibits specificity in its localization to LD periphery. Note that control myristoylated GFP proteins do not exhibit this localization (S5C) and that GRASP also forms ‘clusters’ in the most apical sections. (b) High magnification view to show clusters (pink arrow) and LD peripheral localization (white arrow) of GRASP (c) Orthogonal YZ axis view of GRASP localization. Note the concentration of GRASP ‘clusters’ on the apical side of the cell (pink arrows) while PLIN1 displays approximately equal distribution from basal to apical.
(B) (a) Confocal micrograph representing XY view of fat cells expressing Upd2::tagRFP-T (red), nucleus (blue), DIC reveals LD. White arrows point to Upd2 punctae. XY serial sections from apical (a′) at 4μM depth from the top of the cell to basal (a‴) at a depth of 12.5μM. (b) YZ slice orthogonal view. Note that the Upd2 punctae are enriched at a plane above the nucleus.
(C) Confocal micrographs of optical sections of adult fat tissues expressing tagged Upd2 and GRASP (Upd2::tagRFP-T in red, GRASP::GFP in green, and nucleus in blue). (a) XY view of fat cell at 4μM depth. Upd2 punctae appear in the proximity of GRASP enriched regions. (b) Orthogonal view along the XZ axis. Arrow points to the co-localization of GRASP and Upd2 in a sub-apical location above the plane of the nucleus.
In micrographs 6A–C, yellow scale bar represents 5μM. See also Figure S5.
GFP-tagged GRASP (UAS-GRASP::GFP), which is functional and able to rescue GRASP-del mutants (Figure 2C), was expressed in fly fat cells using the fat body specific driver Lpp-Gal4 and co-stained with antibodies to the LD associated protein PERILIPIN1 (PLIN1)(Beller et al., 2010) (Figure 6A). Confocal imaging analyses revealed that GRASP exhibits a widely distributed cytoplasmic and membrane localization (Figure 6Aa, S5B). GRASP localization can be broadly characterized to distinct locations (Figure 6Ab, S5B) that include: i) the ring periphery of LDs (Figures 6Ab, S5Ba); ii) clustered GRASP enrichment periphery of the LDs (Figure 6Ab, 6Ac, S5Bb); and iii) cytosolic punctae and PM (Figure S5Bc). Specifically, on examining the most apical sections (at 2–4μM from the apical surface of the cell), we observed GRASP enrichment juxtaposed to LD surface (see pink arrows, Figure 6Ab, c). While PLIN1 exhibited approximately equal apico-basal distribution (Figure 6Ac), GRASP localization was skewed to the apical side of the cell (Figure 6Ac).
The localization of GRASP at close apposition to LD periphery is not due to its myristoylation motif as GRASP in fat cells expressing myristoylated GFP (myr::GFP) under the same conditions as GRASP::GFP does not localize to LD proximity (Figure S5C).
Given the role of GRASP in Golgi organization (Barr et al., 1997a), we examined Golgi markers in conjunction with GRASP (Figure S5D). We observed that the punctate vesicles localized with Golgi but ‘circular’ GRASP localization in the apical periphery of the LDs did not (Figure S5D), suggesting that GRASP localization in LD periphery is not associated with its Golgi localization (See Discussion).
Upd2 distribution in adult fat cells was assayed by expressing a tagged version of Upd2 (Lpp-Gal4> UAS-Upd2::TagRFP-T). We detected a cytoplasmic vesicular distribution of Upd2, with an enrichment at the LD periphery (Figure 6Ba′). Also, the Upd2 signal was enriched in planes apical to the nucleus (approximately 4μM from cell surface compare Figure 6Ba′- a‴; see orthogonal view 6Bb). Next, we examined the localization of Upd2 with respect to GRASP in fat cells of transgenic flies expressing differentially tagged forms of GRASP and Upd2 (Lpp-Gal4> UAS-Upd2::TagRFP-T, UAS-GRASP::GFP). Upd2 localized close to the GRASP compartments at the periphery of LDs (Figure 6Ca) at the apical side of fat cells (4μM from cell surface). Further, orthogonal sections through fat cells along the XZ axis revealed that the co-localization between GRASP and Upd2 increases in sections apical to the nuclear plane (Figure 6Cb).
Overall, we observe that both Upd2 and GRASP display an apico-basal polarity in their distribution in fat cells and in more apical regions of the cell localize in close proximity to LDs.
GRASP localization in Drosophila adult fat cells is dependent on systemic nutritional status and regulated by cytosolic calcium
Next, we asked whether the apical-basal polarity of GRASP (Figure 6Ac) and GRASP clustering was influenced by altered nutritional status. Adult males expressing GRASP::GFP in their fat cells were subjected to a starvation regime. We imaged optical sections through fat tissue from fed and starved flies under the same imaging conditions and analyzed GRASP distribution in fat cells in all optical planes (Figure 7 a′, b′). We observed a reduction in the intensity of GRASP apical localization in starved state (Figure 7B: compare sections 4–10 in fed (7a′) versus starved (7b′) fat tissue). Significantly, at more basal compartments, GRASP punctae were higher in starved versus fed fat tissue (Figure 7B: compare sections 11–20 in fed (7a′) versus starved (7b′) fat tissue). The same effect of systemic nutrient state on GRASP apical localization was observed when GRASP was tagged with a different fluorophore (Figure S6A), suggesting that this is not due to a particular protein tag. The reduction in GRASP levels is likely an effect of reduced protein synthesis during starvation, which is consistent with what we observe by western blot analysis (Figure 3A, 3B, S3A, S3D). Nevertheless, we note that GRASP was preferentially basally localized in starved fat cells (see Figure 7Ab′ sections 11–20), whereas it displays a marked apical localization in the well-fed state.
Figure 7. GRASP localization in Drosophila adult fat cells is dependent on systemic nutritional status and regulated by cytosolic calcium.

(A) Confocal images documenting the expression of GRASP::GFP in adult fat tissue under normal food (a′) and starvation (b′). Montage of XY-stack from apical to more basal sections (optical slices 1–25). In the fed state (a′) note the presence of high intensity GRASP localization in apical sections (arrow in slice 8, yellow framed slices) compared with similar sections in the starved state. In contrast, a higher intensity of GRASP punctae are observed in mid-basal slices (orange framed slices) in starved (b′) and reduced basal localization of GRASP in fed state (a′) in optical slices 14–20. Note Images acquired under same settings for both conditions. GRASP tagged with another fluorophore shows a similar change in localization in the starved state (See companion figure S6A). (a″, b″) quantification of %area of GRASP GFP pixels localization to specific compartment. These are subdivided into three categories (punctae, membrane and hubs). Note that while the membrane and ‘hub’ localization of GRASP is significantly reduced in the starved state, the punctate localization (~40%) remains similar. See Figure S6B for details on image segmentation and on how %area was computed.
(B) To test the effect of acutely inhibiting cytosolic Ca2+ efflux downstream of Glucagon like signaling on GRASP hubs during starvation, flies expressing GFP tagged GRASP (a) were starved in the presence of vehicle DMSO (b), PLC inhibitor (U73122- see c), or an inactive analog of PLC inhibitor (d). Confocal images were captured at an apical plane from Drosophila fat explants. Note the continued presence of GRASP localization in ‘clusters’ when PLC is inhibited (c- outlined in yellow) in starved conditions compared to controls (b, d). The % area of GRASP localization in the apical clusters (outlined in yellow dashed lines) is quantified relative to the fed control (e). The persistent GRASP localization compared to control drugs is statistically significant and comparable to the fed state. Image acquisition was performed with the same settings and 5–7 fat explants from different animals were used for quantification per data point. Note b′ and d′ show higher gain images of b & d to allow visualization of GRASP::GFP. See companion Figure S6B for details on quantification. 2-tailed t-test was performed to calculate statistical significance. Error bars represent %SD.
In all micrographs yellow scale bar represents 5μM. See also Figure S6.
As described previously, in standard lab food conditions, GRASP is distributed at the membrane, LD periphery and cytosolic punctae (Figure S5B). We sought to identify whether any particular pool of cytoplasmic GRASP was most sensitive to starvation or whether all pools were equally affected by reduction in protein levels. We performed image segmentation analysis on z-stacks from fed and starved cells (See S6B and Methods details) and queried the percentage of area occupied by each pool in the entire fat cell. Our analysis revealed that clustered GRASP (5% in fed vs 0.1% in starved) and membrane localized GRASP (14% in fed vs 1.1%) were significantly reduced during starvation (>92% reduction) compared to well-fed states (See graph in Figure 7A a″, b″). However, the punctate GRASP localization is largely insensitive to low energy states, (approximately 40% of GRASP was detected as punctae in both states). The observation, that specific GRASP pools, especially those that are likely formed by oligomerization, are most sensitive to starvation, correlates with increased GRASP phosphorylation (Figures 3A, B; S3A), and consistent with prior reports that GRASP phosphorylation results in GRASP ‘unlinking’ (Wang et al., 2005; Yoshimura et al., 2005).
The role of cytosolic Ca2+, downstream of Glucagon-like signaling, in regulating GRASP localization during nutrient deprivation (Figure 4A, B), prompted us to ask whether specific pools of GRASP were sensitive to Ca2+ during nutrient deprivation. Therefore we assayed GRASP localization during starvation while manipulating cytosolic Ca2+ levels. We starved flies in the presence of PLC inhibitor, U73122, which causes defects in cytosolic IP3R production (Bleasdale et al., 1990) and hence will affect the release of Ca2+ from the ER. We observed that treatment of flies with PLC inhibitor causes persistent apical GRASP clusters during starvation (Figure 7Bc) compared to controls (Figure 7Bb, 7Bd); this effect is statistically significant (Figure 7be; quantified using image segmentation analysis Figure S6B). These results suggest that the apical localization of GRASP to LD proximity is most sensitive to nutrient levels and is regulated by cytosolic Ca2+ increases downstream of IP3R.
Discussion
How adipokines are released from adipocytes depending on energy store levels is an outstanding question in physiology. Previously, we documented that Upd2 is produced from fat cells in response to dietary fat and sugars (Rajan and Perrimon, 2012). In the present study, we describe how Upd2 secretion depends on GRASP, a component of the unconventional secretion pathway. We demonstrate a surprising antagonistic effect of increased cytosolic Ca2+ on adipokine secretion. We show that this negative regulation is at least in part the effect of CaMKII-mediated phosphorylation of the unconventional secretion component GRASP.
A novel role for GRASP
GRASP, a myristoylated PDZ-domain has two mammalian isoforms GRASP55 and GRASP65, but only one isoform in flies. It has been previously implicated in a number of processes including Golgi stacking(Barr et al., 1997a) and, unconventional secretion from amoeba (Kinseth et al., 2007), to humans (Gee et al., 2011). Here, we found that GRASP mutants have lipid storage defects that phenocopy upd2 mutants (Figure 2A), and that the role of GRASP in fat storage is tissue specific (Figure 2B). Future work will resolve how GRASP mediated trafficking causes the adipokine to be released from the cell.
Whether our findings regarding GRASP’s role in adipokine secretion are relevant to higher order model systems requires studies in mammalian models. GRASP65 mutant mice appear viable and fertile, but detailed information on its energy physiology is lacking (Veenendaal et al., 2014). Furthermore, experiments have suggested that GRASP65 and GRASP55 play redundant roles (Xiang and Wang, 2010), hence examination of double mutant mice will likely be important to characterize the role of GRASP in energy physiology.
We have shown using different assays that Upd2 adopts an unconventional secretion route (Figure 1 and S1). However, we note that it is unexpected that Upd2 is glycosylated (Figure S1) even though there is no ‘traditional’ ER targeting signal in the Upd2 protein sequence. Further studies will be required to clarify the mechanisms governing Upd2 glycosylation in the absence of an ER targeting signal. One possibility is that Upd2 has a “hidden” signal sequence that needs further characterization. Since we observe Upd2 localizes in close apposition to LD (see Figure 6C), another probable mechanism could be glycosylation by LD localized glycosyltransferases (Krahmer et al., 2013).
GRASP apical localization
GRASP hubs are positioned at LD proximity, and others have reported that ER-Golgi intermediate compartments (ERGIC) are found at close juxtaposition to the LD, and demonstrated that trafficking of LD-associated proteins occurs via this compartment (Soni et al., 2009). Our observations with GFP tagged GRASP are reminiscent of these findings and other studies that have shown that GRASP is present at both the Golgi and the ERGIC (Marra et al., 2001). Whether and how these GRASP clusters interact with ERGIC will require future studies, and we were unable to resolve those using antibodies to ERGIC components and conventional fluorescence microscopy (data not shown). Super resolution microscopy on tagged components of ERGIC and GRASP should clarify whether ERGIC/ERES localize with GRASP ‘clusters’.
A caveat of our work is that we have used tagged versions of Upd2 and GRASP in these studies because of limitations related to a lack antibodies that recognize endogenous protein in fat tissue by immunohistochemistry. Nevertheless, the tagged versions we used have been tested for functionality and hence are a useful surrogate for endogenous localization.
Disruption of Ca2+ homeostasis and obesity
Previous studies in both mammals and flies have suggested that dysfunctional Ca2+ homeostasis is linked to obesity, although the mechanism underlying this phenomenon is unclear. In mammals, under starvation, Glucagon triggers an IP3R mediated transcriptional program in hepatocytes to promote survival during fasting (Wang et al., 2012). In addition, studies of Glucagon action in mice have shown that CaMKII is activated by Glucagon in hepatocytes to regulate insulin sensitivity (Ozcan et al., 2013; Ozcan et al., 2012), and that dysregulation of Ca2+ homeostasis leads to obesity (Fu et al., 2011). In flies, a number of studies have reported that mutations in genes that alter cytosolic Ca2+ levels cause changes in fat storage (Baumbach et al., 2014; Bi et al., 2014; Moraru et al., 2017; Subramanian et al., 2013).., Nevertheless, the mechanistic basis for how Ca2+ levels and fat storage are linked has remained unclear. Our study, showing that increased cytosolic Ca2+, by negatively regulating GRASP via CaMKII mediated phosphorylation, affects Upd2 secretion, provides a specific molecular pathway linking Ca2+ to fat storage. Importantly, the pathway we have identified is likely evolutionarily conserved as we find that hLeptin secretion adopts an unconventional secretion route, and, like Upd2, is negatively regulated by increased cytosolic Ca2+ and CaMKII activity.
Implications of Upd2 secretion for understanding Leptin release
As Leptin rescues upd2 mutants and is structurally similar to Upd2, it is likely that the mechanism we identified for Upd2 secretion is relevant to Leptin production. However, unlike Upd2, Leptin possesses a signal peptide, and has been reported to localize to the ER(Barr et al., 1997b; Roh et al., 2000). Leptin has two strongly predicted disulfide bonds (2 bonds predicted with score of 0.98; score of 1 being 100% probability). In contrast, Upd2 has no high scoring disulfide bonds (3 predicted bonds with highest score of 0.014); predictions were made using DiANNA, an artificial neural network web tool for ternary cysteine classification and disulfide bond prediction (Ferre and Clote, 2006). Since disulfide-bridge forming enzymes are ER localized (Frand and Kaiser, 1998), the signal sequence of Leptin and its ER localization is probably a requirement for its proper folding.
A number of proteins with conventional secretion signals, such as Drosophila α-Integrin, human CFTR, CD45 are ER targeted proteins, which bypass the Golgi (Grieve and Rabouille, 2011). Thus, it is possible that Leptin, similar to Upd2, does not traffic through the Golgi. In support of the Golgi bypass model for Leptin, two studies carried out in rat primary adipocytes and adipose tissue explants (Barr et al., 1997b; Roh et al., 2000), using immunofluorescence and sucrose gradient centrifugation, did not find evidence for Leptin Golgi localization. These studies favored a model that Leptin is released via ‘special’ secretory vesicles that are devoid of other adipocyte secretory products (Barr et al., 1997b; Lee and Fried, 2006; Roh et al., 2000). Whether these vesicles correspond to GRASP positive compartments will need to be investigated. Leptin and Upd2 likely arose from the need to remotely signal systemic nutrient status (Ahima et al., 1996; Flier and Maratos-Flier, 2017; Rajan and Perrimon, 2012). Hence our findings on how Upd2 secretion from fly fat cells is coupled to energy levels is likely to be relevant to mammalian adipokine production.
STAR Methods Text
CONTACT FOR REAGENT AND RESOURCE SHARING
Further information and requests for resources and reagents should be directed to and will be fulfilled by the Lead Contact, Akhila Rajan (akhila@fredhutch.org).
EXPERIMENTAL MODEL AND SUBJECT DETAILS
Experimental Animals
Species: Drosophila melanogaster
Only males were used in experiments at an age of 7–15 days post-eclosion.
For the RNAi experiments, crosses were maintained at 25C for 3 days, after which the progeny were shifted to 27C.
Flies were cultured in a humidified incubator at 25C on standard lab food containing per liter: 15 g yeast, 8.6 g soy flour, 63 g corn flour, 5g agar, 5g malt, 74 mL corn syrup.
Fly strains used in this study were from previous work (Rajan and Perrimon, 2012) and/or obtained from the Bloomington Drosophila stock center (BDSC): UAS-GRASP::GFP (BSDC# 8507, 8508), UAS-myr::GFP (BDSC#32197), UAS-Golgi-RFP (BDSC# 30908), Lpp-Gal4 (Brankatschk and Eaton, 2010), Mhc-Gal4 (Schuster et al., 1996), Df(3L)BSC552 (BDSC# 26502), Df(3L)BSC445 (BDSC# 24949). The following Transgenic RNAi Project (TRiP) lines were used: IP3R-RNAi (JF01957), IP3R-RNAi (HMC03228), AkhR-RNAi (JF03256), Luciferase-RNAi (JF01355), and GFP-RNAi (HMS00314). In addition, three independent GRASP RNAi lines, SH08449, SH08450 and SH08451, were generated by the TRiP. qPCR analyses showed that GRASP knockdown is >75% for all three lines. Finally, the following UAS lines were generated: UAS-GRASP::GFP, UAS-GRASP::GFP-CaMKII TtoD, UAS-GRASP::tagRFP-T, UAS-upd2::tagRFP-T.
Cell lines
Drosophila S2R+ cells were used for all cell culture related experiments. This cell line was chosen because previous studies have validated their applicability to study LD biogenesis (Guo et al., 2008) and protein secretion (Bard et al., 2006). The cells were maintained in Schneider’s medium (GIBCO), 10% heat-inactivated FBS (SIGMA) and 5% Pen-Strep (GIBCO) at 25°C.
METHOD DETAILS
Tissue culture
The day before transfection, cells were passaged to 60–80% confluency. For transfections related to ELISA experiments, cells were cultured in 96 well plates. They were transfected with 20ng/well pAc-upd2::GFP (Hombria et al., 2005), 10ng/well pACRenilla::Luciferase, and 150ng of dsRNA/well for knockdown experiments. Transfections were done using the Effectene kit (Cat# 301427, QIAGEN) as per the manufacturer’s instructions.
dsRNA production and cell treatments
Amplicons for dsRNAs were obtained from the Drosophila RNAi screening center (DRSC) and in vitro transcribed (IVT) using MEGAscript® T7 Transcription Kit (Cat# AMB1334-5, ThermoFisher). IVT reactions were carried out as per the protocol provided by the DRSC (available at: http://www.flyrnai.org/DRSC-PRS.html). Amplicons used in this study are: GRASP (DRSC28969 and see below), dStim (DRSC20158), Syntaxin-5 (DRSC03432 and DRSC30696), Rab2 (DRSC05017 and DRSC31649), LacZ dsRNA and eGFP dsRNA were used as controls. For GRASP, we designed two additional dsRNA amplicons, GRASP-CH-1 and GRASP-CH-2. Details of primers used for generating these amplicons are provided in Oligonucleotide section of Key resource table. Except for dStim, all dsRNA knockdown experiments were carried out using a dsRNA pool of 2 or more independent dsRNAs per gene. We found that this produced a knockdown efficiency of >85% (based on qPCR analysis) in S2R+ cells. S2R+ transfected with dsRNAs were incubated for 4 days to allow for gene knockdown. On the 4th day, media was changed and the ELISA assay was carried out on the 5th day. Note the data is represented as percent change in Upd2/Leptin secretion normalized to transfection efficiency with 0% change indicating baseline level of secretion. See ELISA assay procedure below.
KEY RESOURCES TABLE.
| REAGENT or RESOURCE | SOURCE | IDENTIFIER |
|---|---|---|
| Antibodies | ||
| GFP-nAb™ Agarose | Allele Biotech | ABP-nAb-GFPA050 |
| Chicken anti-GFP | Abcam | ab13970 |
| GFP coating antibody for ELISA | Allele Biotech | ACT-CM-GFPTRAP |
| GFP detection antibody for ELISA | Rockland | 600-401-215 |
| Rabbit anti-GRASP65 | Abcam | ab30315 |
| Anti-phospho-Threnonine | Cell Signaling | 9381 |
| Rabbit-anti-Lsp1-gamma | (Burmester et al., 1999) | N/A |
| Mouse monoclonal Anti-α-Tubulin | Sigma | T5168 |
| Rabbit-anti-PLIN1 | (Beller et al., 2010) | N/A |
| Rabbit-anti-tRFP | Evrogen | AB233 |
| Rabbit-anti-Dilp5 | (Geminard et al., 2009) | N/A |
| Bacterial and Virus Strains | ||
| BL21(DE3)pLysS | EMD Millipore | 69451-3 |
| NEB® 10-beta Competent E. coli | NEB | C3019H |
| Biological Samples | ||
| N/A | ||
| Chemicals, Peptides, and Recombinant Proteins | ||
| U73122 | Tocris | 1268 |
| U73343 | Tocris | 4133 |
| Brefeldin A1 | Sigma | B5936-200UL |
| BAPTA-AM | Sigma | A1076-25MG |
| Ionomycin | Sigma | I9657-1MG |
| KN93 | Santa Cruz Biotech | sc-202199 |
| KN92 | Santa Cruz Biotech | sc-311369 |
| Effectene | QIAGEN | 301427 |
| Gibco™ Schneider’s Drosophila Sterile Medium | ThermoFisher | 21720024 |
| SlowFade Gold antifade reagent with DAPI | Invitrogen | S36938 |
| M3RM medium also known as Cl.8 | (Zartman et al., 2013) | N/A |
| Fetal Bovine Serum | ThermoFisher | 10437028 |
| Gibco™ Penicillin-Streptomycin (5,000 U/mL) | ThermoFisher | 15-070-063 |
| Low melting agarose | Invitrogen | 16520-100 |
| Activated recombinant CaMKII | NEB | P6060S |
| Glycerol standard | Sigma | G7793-5ML |
| Free glycerol Reagent | Sigma | F6428-40ML |
| Triglyceride reagent | Sigma | T2449-10ML |
| Recombinant GFP protein | Vector Labs | MB-0752 |
| Ni-NTA His•Bind® Superflow™ Resin | EMD Millipore | 70691-3 |
| Recombinant 6XHis-MBP-Drosophila GRASP protein | This paper | N/A |
| Gateway® LR Clonase® II Enzyme mix | Invitrogen | 11791-020 |
| Gateway® BP Clonase II Enzyme mix | Invitrogen | 11789-020 |
| MEGAscript® T7 Transcription Kit | ThermoFisher | AMB1334-5 |
| Q5® Site-Directed Mutagenesis Kit | NEB | E0554S |
| Critical Commercial Assays | ||
| 1-step Ultra-TMB ELISA substrate | Pierce | 34028 |
| Renilla-Glo® Luciferase reagent | Promega | E2710 |
| Pro-Q® Diamond Phosphoprotein Blot Stain | Thermo Fisher Scientific Inc | P33356 |
| Deposited Data | ||
| N/A | ||
| Experimental Models: Cell Lines | ||
| D. melanogaster: Cell line S2R+ | Laboratory of Norbert Perrimon | N/A |
| Experimental Models: Organisms/Strains | ||
| UAS-GRASP::GFP | BDSC | 8507, 8508 |
| UAS-myr::GFP | BDSC | 32197 |
| UAS-Golgi-RFP | BDSC | 30908 |
| Lpp-Gal4 | (Brankatschk and Eaton, 2010) | N/A |
| Df(3L)BSC552 | BDSC | 26502 |
| Df(3L)BSC445 | BDSC | 24949 |
| GRASP-RNAi | TRiP. This paper. | SH08449 |
| GRASP-RNAi | TRiP. This paper. | SH08450 |
| GRASP-RNAi | TRiP. This paper. | SH08451 |
| IP3R-RNAi | BDSC/TRiP | JF01957 |
| IP3R-RNAi | BDSC/TRiP | HMC03228 |
| AkhR-RNAi | BDSC/TRiP | JF03256 |
| Luciferase-RNAi | BDSC/TRiP | JF01355 |
| GFP-RNAi | BDSC/TRiP | HMS00314 |
| Dilp2-Gal4 | (Wu et al., 2005) | N/A |
| UAS-Luciferase | (Rajan and Perrimon, 2012) | N/A |
| Lsp-Gal4 | (Lazareva et al., 2007) | N/A |
| UAS-TrpA1 | BDSC | 26263 |
| Mhc-Gal4 | (Schuster et al., 1996) | N/A |
| UAS-GRASP::GFP | This paper | N/A |
| UAS-GRASP::GFP-CaMKII TtoD | This paper | N/A |
| UAS-GRASP::tagRFP-T | This paper | N/A |
| UAS-upd2::tagRFP-T | This paper | N/A |
| GRASP-del | This paper | N/A |
| Recombinant DNA | ||
| pAc-upd2::GFP | (Hombria et al., 2005) | N/A |
| pACRenilla::Luciferase | Laboratory of Norbert Perrimon | N/A |
| pRmHa3 Spitz-GFP | (Lee et al., 2001) | N/A |
| GRASP cDNA | DGRC | BAC13N10 |
| pDEST-HisMBP | Addgene | 11085 |
| pENTR-hLeptin | (Rajan and Perrimon, 2012) | N/A |
| Oligonucleotides | ||
| GRASP-CH-1 (amplicon- forward primer with T7 promoter) | Designed by DRSC for this paper; Synthesized by IDT. | TAATACGACTCACTATAGGGGCCTCGATCAGGACAATGAT |
| GRASP-CH-1 (amplicon- reverse primer with T7 promoter) | Designed by DRSC for this paper; Synthesized by IDT. | TAATACGACTCACTATAGGGGAACAGGTCGTCGTTCTCGT |
| GRASP-CH-2 (amplicon- forward primer with T7 promoter) | Designed by DRSC for this paper; Synthesized by IDT. | TAATACGACTCACTATAGGGCAGTACGCAGCAAAACGCTA |
| GRASP-CH-2 (amplicon- reverse primer with T7 promoter) | Designed by DRSC for this paper; Synthesized by IDT. | TAATACGACTCACTATAGGGGTCCGGATAGTTCGTCGTTG |
| GRASP_CKII_T270D_F | Q5-Site directed mutagenesis. This paper. Synthesized by IDT. | caccggcacTATTGAGCCACCGGCACAG |
| GRASP_CKII_T270D_R | Q5-Site directed mutagenesis. This paper. Synthesized by IDT. | gctcaatatcCGGTGGTCTGACCTCGGC |
| GRASP_CKII_T83D_F | Q5-Site directed mutagenesis. This paper. Synthesized by IDT. | tacaCCTTACACCGAGCAACAAC |
| GRASP_CKII_T83D_R | Q5-Site directed mutagenesis. This paper. Synthesized by IDT. | aggtcCAGTTCGCGGACCGTCTG |
| Software and Algorithms | ||
| ZenLite 2012 | Zeiss | N/A |
| imageJ/FIJI | (Schindelin et al., 2012) | N/A |
| WEKA machine learning tool | http://fiji.sc/Trainable_Weka_Segmentation | N/A |
| Other | ||
| Semi quantitative Mass Spectrometry Data | This Paper | S3C |
Treatment of cells with drugs
For drug treatment experiments, the media was replaced with media containing the drug on day 3 after transfection with upd2::GFP. 18 hours later the conditioned media was used for ELISA, except for Ionomycin for which the treatment was done for 2–4 hours as increased exposure times caused cell death. Drugs used in this study for ELISA treatment include Brefeldin A1 (Cat# B5936-200UL, Sigma), BAPTA-AM (A1076-25MG, Sigma), Ionomycin (Cat#I9657-1MG, Sigma), KN93 (Cat#sc-202199, Santa Cruz), and U73122(Cat#1268, Tocris). Stocks solutions of the drugs were made in DMSO as per the manufacturer’s instructions, and used at a working concentration indicated in the figure legends of each experiment. DMSO treated replicates were used as controls. Note the data is represented as percent change in Upd2/Leptin secretion normalized to transfection efficiency, with 0% change indicating baseline level of secretion. See ELISA assay procedure below.
ELISA assays
GFP sandwich ELISA assay was used for detecting Upd2::GFP. On day 1, 96 well medium bind polystyrene plates (Cat#CLS3368-100EA, Sigma) were incubated overnight at 4C with coating antibody (Cat# ACT-CM-GFPTRAP, Allele Biotechnology) diluted in 0.01M pH8.0 bicarbonate buffer at a concentration of 1μg/ml. On day 2, plates were washed briefly with PBS, blocked for 30 minutes with 1% BSA block in PBS, and coated with conditioned media and incubated overnight at 4C. Recombinant GFP protein (Cat# MB-0752, Vector labs), diluted in S2R+ cell growth media (64ng/μl to 4 ng/μl), was used in every ELISA plate as positive control to ensure linearity of GFP readings. On day 3, the plates were washed with PBS+0.05% Tween-20 (PBS-T), blocked with 1% BSA in PBS for 30 minutes at RT. GFP detection antibody (Cat# 600-401-215, Rockland) was added to the diluted 1:1000 in 0.1% BSA in PBS-T. Plates were washed with PBS-T and incubated with secondary HRP conjugated anti Rabbit secondary antibodies (Cat# ab136636, Abcam) diluted at 1:5000 in 1% BSA block. Plates were washed in PBS-T with a final wash in PBS. For detection, each well was incubated 100μl 1-step Ultra-TMB ELISA substrate (Cat# 34028, Pierce), which was previously equilibrated to RT, for approximately 5–15 minutes until detectable blue colorimetric reaction occurred. Reaction was stopped with 2N sulphuric acid and absorbance was measured at 450nm. The TMB readings were normalized to transfection efficiency as measured from Renilla Luciferase assays (see below).
Renilla Luciferase assay
On day 2 of the ELISA assay, after the conditioned medium was transferred for use in ELISA assays, cells were re-suspended in 50μl of PBS, and incubated with 50μl/well Renilla-Glo® Luciferase reagent (Cat# E2710, Promega) for 10 minutes and read using a multiwell luminometer.
Endo H sensitivity assay
9μl of protein, obtained by GFP-Immunoprecipitation (see below) from conditioned media of upd2::GFP transfected S2R+ cells, were digested with either Endo H(Cat# P0702S, NEB), PNGase F(Cat# P0704S, NEB), or Protein Deglycosylation Mix(Cat# P6039S, NEB) at 37C for 1 hour, as per NEB protocol. The digest was then and run on SDS-PAGE gel, and blotted to detect GFP. RNAaseB and Fetuin were used as positive controls for glycosidase reactions.
Cloning
All cloning was done using the Gateway® Technology. Entry cDNA clones were PCR amplified from the appropriate templates [GRASP cDNA (from BAC13N10) and upd2 cDNA (from plasmid pAc-upd2GFP (Hombria et al., 2005)] and cloned into pENTR-D/TOPO and pDONR221 using BP reaction (Gateway® BP Clonase II enzyme mix, Cat#11789-020, Invitrogen). For human Leptin, the pENTR-hLeptin clone derived previously (Rajan and Perrimon, 2012) was used. For site directed mutagenesis of putative GRASP putative CaMKII sites, pENTR-GRASP was mutagenized using the Q5® Site-Directed Mutagenesis Kit from NEB (Cat # E0554S) to convert threonine encoding codons to aspartate. The sequence of oligonucleotides used for this mutagenesis reaction are provided in the Key Resource Table. The entry vectors were then moved using LR clonase reaction (Gateway® LR Clonase® II Enzyme mix, Cat#11791-020, Invitrogen) into destination vectors compatible with fly transformation, protein production, or cell culture and with the appropriate C-terminal tags.
Immunoprecipitation, Mass Spectrometry and Western blots
For Immunoprecipitation (IP) from S2R+ cells, protein for each condition was prepared by lysing 1 well of a 6-well dish, 4 days after transfection. For IP from fly fat bodies, GFP tagged GRASP was expressed using the LPP-Gal4 driver. 120 fed male flies or 150 starved male flies were harvested per replicate. Tissue was homogenized using 1mm zirconium beads (Cat#ZROB10, Next Advance) in Bullet Blender® Tissue homogenizer (Model BBX24, Next Advance) in IP lysis buffer in the presence of protease inhibitors. 2mg/ml was used per IP experiments performed with camelid antibodies GFP-nAb™ Agarose (Cat# ABP-nAb-GFPA050, Allele Biotech) as per the manufacturer’s protocol. The sample was prepared for mass-spec as previously described (Neumuller et al., 2012). Western blots were performed as detailed in (Neumuller et al., 2012). Antibodies used include Chicken anti-GFP (Cat#ab13970, abcam) 1:2000 in TBS-0.05% tween-20 (TBS-T), Rabbit anti-GRASP65(Cat# ab30315, abcam) 1:10000 in 1% BSA block in TBS, Rabbit anti-Lsp1-gamma used at 1:10000 in milk block; as per directions in (Burmester et al., 1999) and monoclonal Anti-α-Tubulin 1:5000 in TBS-T(Cat# T5168, Sigma).
Recombinant protein expression
Full length GRASP was cloned into an E.Coli protein expression vector, pDEST-HisMBP, [gift of David Waugh (Addgene plasmid # 11085) (Nallamsetty et al., 2005)]. The plasmid was transformed into BL21DE3 pLysS strain of bacteria, 2 liter cultures were induced for 6 hours with 1M IPTG at 30°C. The 6XHis-MBP-GRASP protein was purified from bacterial lysates using Ni-NTA His•Bind® Superflow™ Resin (EMD Millipore, 70691-3) to obtain purified recombinant 6x-His-MBP-GRASP (87kDA).
In vitro kinase assay and phosphoprotein blot stains
For in vitro kinase assays, activated recombinant CaMKII (NEB, P6060S) was incubated with recombinant Drosophila GRASP for 60 minutes. We followed the kinase manufacturer’s guidelines for setting up the kinase reaction. Briefly, the kinase was activated with Calmodulin, CaCl2 and ATP for 10 minutes at 30°C. The activated kinas e was incubated with the substrate for 30 minutes. The reaction was then run on a SDS-PAGE gel and Western blotted. The blot was probed with polyclonal antibodies that recognize phospho-Threonine (Cell Signaling, #9381) or with Pro-Q® Diamond Phosphoprotein Blot Stain (Thermo Fisher Scientific Inc, P33356) as per the manufacturer’s protocol.
TAG assay
TAG assays were carried out as per the protocol described in (Tennessen et al., 2014). 3 adult male flies were used per biological replicates. Note that for adult TAG assays the most consistent results and lowest standard deviations were obtained using 10 days old male flies. The reagents used for assay were from Sigma Free glycerol (Cat # F6428-40ML), Triglyceride reagent (Cat# T2449-10ML) and Glycerol standard (Cat# G7793-5ML). It is critical that the triglyceride and free glycerol reagents are fresh. We used aliquots stored at −20C and never reused thawed reagents as reagents were unstable at 4C for longer than 2 days causing inconsistent readings. The TAG readings were normalized to total protein measured using BCA assay.
Generation of GRASP CRISPR mutant
The gRNA sequence for GRASP65-A was designed using “DRSC find CRISPR (version 2)” (Housden et al., 2015). The GRASP65-A construct was generated by cloning annealed oligonucleotides encoding the gRNA sequence (TGTCCTGTACCTTGAGTACG) between the BbsI cut sites of the pl100 vector (Ren et al., 2013).
Nutrient deprivation and drug feeding
Flies were cultured in a humidified incubator at 25C on standard lab food containing per liter: 15 g yeast, 8.6 g soy flour, 63 g corn flour, 5g agar, 5g malt, 74 mL corn syrup.
For nutrient deprivation experiments, 10 days old adult male flies were shifted to 1% sucrose agar for 5 days at 25C, after which they were used for experiments.
For drug feeding experiments, stock solutions for U73122 (Cat # 1268, Tocris) and control U73343 (Cat # 4133, Tocris) were dissolved first in chloroform and then in DMSO as per the manufacturer’s instructions. The 5mM DMSO stock was then added at a concentration of 10μM to 1% sucrose in low melting agarose (Cat# 16520-100, Invitrogen). Flies were cultured in this condition for 4 days at 25C before they were used for imaging experiments.
Adult brain immunostaining
Immunostaining of adult brains were performed based on protocols from (Pfeiffer et al., 2010). Rabbit-anti-Dilp5 (Geminard et al., 2009) was used at a concentration of 1:800. Adult brains were dissected in PBS and fixed in cold 0.8% Para-formaldehyde (PFA) in PBS overnight at 4C. Tissues were washed the following day multiple times in 0.5% BSA and 0.5% Triton X-100 in PBS (PAT), pre-blocked in PAT+ 5% NDS for 2 hours at RT, and then incubated with the primary antibody overnight at 4C. The following day, the tissues were washed numerous times in PAT and then blocked again for 30 minutes in PAT+ 5% NDS and incubated in a cocktail with secondary antibodies (obtained from Jackson Immunoresearch) in block (final concentration of 1:500) 4 hours at room temperature. The samples were washed 3X–5X for 15 minutes per wash in PAT and mounted on slides with one layer of scotch tape spacers in Slowfade gold antifade and imaged using Zeiss LSM 780 and 800 confocal systems.
Fat body preparation for fixed immunostaining and ex vivo assays
As shown in Supplementary Figure 5A, incisions, using dissection scissors (Cat# 500086, World Precision Instruments Inc), were made to release the ventral abdomen from the rest of the fly body. Flies used for dissection were adult males, 7–15 days old. Dissections were done in Ringer’s medium (1.8 mM CaCl2, 2mM Kcl, 128mM Nacl, 4mM MgCl2. 35mM sucrose, 5mM HEPES) and fixed in 4% formaldehyde for 20 minutes. They were rinsed with PBS and mounted in SlowFade Gold antifade reagent with DAPI (Cat# S36938, Invitrogen), with the cuticle side facing down.
For immunohistochemistry the fixed fat tissue was permeabilized in PBS+ 1.0% Triton-X-100 for 3X washes 5 minutes, subsequently washed with PBS+0.3% Triton-X-100 (Fat wash). Blocked for 30 minutes at room temperature (RT) with gentle agitation in Fat wash+5% Normal donkey serum (Block). Antibodies were diluted in block Rabbit-anti-PLIN1 (Beller et al., 2010)(1:1000); Chicken-anti-GFP (1:2000, Abcam, #ab13970); Rabbit-anti-tRFP (1:500, Evrogen, #AB233) and incubated overnight at 4c. Washed multiple times following day in fat wash at (RT) incubated with appropriate secondary antibody (from Jackson Immunoresearch) in block for 2–4 hours at RT. Washed 3X–5X for 5–15 minutes in fat wash, mounted in SlowFade Gold antifade reagent with DAPI (Cat# S36938, Invitrogen).
For live imaging and ex vivo assays, dissections were done in M3-based reference medium (M3RM medium also known as Cl.8). For details on media prep refer to (Zartman et al., 2013). For ex vivo assays the dissected fat body explants were incubated with the appropriate drug, or DMSO control, for 30 minutes, followed by fixation in 4% formaldehyde for 20 minutes. They were rinsed with PBS and mounted in SlowFade Gold antifade reagent with DAPI. The following drugs were used in ex-vivo assays: KN93 (Cat# sc-202199, Santa Cruz Biotech) and its inactive analog KN92 (Cat# sc-311369, Santa Cruz Biotech) used at 100nM.
QUANTIFICATION AND STATISTICAL ANALYSIS
Image analysis quantification
Image analysis was carried out in ZenLite 2012 and ImageJ (Schindelin et al., 2012). To calculate the intensity of Dilp and Upd2::tagRFP staining, mean gray value was calculated from maximum intensity projections of a similar number of confocal stacks using Image J.
We used the WEKA machine learning tool (http://fiji.sc/Trainable_Weka_Segmentation) to train datasets for classification of GRASP::GFP localization into 4 different categories. The training datasets were a collation of experiments from various conditions and fed into the tool as random Z-stacks and then trained. The trained classifier was then applied to control datasets and images were analyzed by eye to ensure that the classifier selected the right regions. The classifier was then applied in an unbiased manner to all experimental datasets. The classifier generated an image (as shown in S6B) that was then separated into different colors (yellow, violet, green, blue), by thresholding, followed by particle analysis to quantify the number of pixels per color. This was then represented as %area occupied by a particular compartment per XY slice, which was then averaged across the entire Z-stack.
Quantification and Statistical analysis
ELISA
For ELISA assays, the ELISA signal readings are normalized to transfection efficiency; the data is represented as percent fold change from control used as baseline. Specifically, the ratio of TMB readings to Renilla Luciferase readings is calculated. This ratio from the control is used as a baseline and the data is represented as percent fold change of experimental conditions with respect to the control. Statistical significance quantified by 2-tailed t-test on 6 biological replicates per condition. Error bars represent %SD (Standard Deviation).
TAG assays
For TAG assays, the TAG signal readings from whole fly lysate are normalized to total protein levels from BCA assay and/or the number of flies used per experiment. This normalized ratio from the control is used as a baseline and the data is represented as fold change of experimental genotypes with respect to the control. Statistical significance quantified by 2-tailed t-test on 3–6 biological replicates per condition. Error bars represent %SD (Standard Deviation).
Supplementary Material
Highlights.
Adipokine Upd2 localizes to GRASP clusters in the proximity of lipid-droplets.
Starvation increases GRASP phosphorylation and inhibits its apical clustering.
Glucagon mediated Ca2+ increase triggers CaMKII phosphorylation of GRASP.
Increased cytosolic Ca2+ negatively regulates adipokine secretion via GRASP.
Acknowledgments
We thank R.P. Kühnlein for generous gift of PERILIPIN1 antibody, P. Leopold for sharing the Dilp5 antibody and J.A. Lepesant for gift of Lsp1-gamma antibody; M. Freeman for Spitz::GFP construct; M. Zeidler, M. Freeman, S. Eaton, C.S. Goodman, P. Shen, the Transgenic RNAi facility (TRiP) and the Bloomington Drosophila Stock Center for flies; the Drosophila RNAi screening center (DRSC) for dsRNA reagents and plate reader equipment; Y. Hu at the DRSC for designing new GRASP amplicons; L. Perkins and A. Miller at the TRiP for generating GRASP-RNAi lines; C. Villalta, S. Vora, M. Pyle and M. Foos for technical assistance; Label-free quantitative mass-spec for GRASP complex identification was performed at the BIDMC Mass Spectrometry core with the help of J. Asara; H. Elliot at the Image and Data analysis core (IDAC) at Harvard Medical School provided advice on segmentation methods and WEKA tool usage. Drosophila Genomics Resource Center (DGRC), supported by NIH grant 2P40OD010949, for GRASP cDNA clones. We are grateful to P. Jouandin, and P. Raghavan for discussions and critical feedback. We thank S. Mohr, A. Petsakou, P. Saavedra, C. Xu, and A. Brent for critical comments on manuscript. N.P is an investigator of the Howard Hughes Medical Institute. This project was supported by P01CA120964 (N.P) and K99/R00DK101605 (A.R).
Footnotes
Author contributions: Conceptualization, Funding Acquisition & Project Administration, A.R. and N.P.; Methodology, Data curation & Visualization, A.R.; Resources, B.H. and F.W.P.; Investigation, A.R. and L.H.; Writing – Original Draft, A.R.; Writing-Review & Editing, N.P.
Publisher's Disclaimer: This is a PDF file of an unedited manuscript that has been accepted for publication. As a service to our customers we are providing this early version of the manuscript. The manuscript will undergo copyediting, typesetting, and review of the resulting proof before it is published in its final citable form. Please note that during the production process errors may be discovered which could affect the content, and all legal disclaimers that apply to the journal pertain.
References
- Ahima RS, Prabakaran D, Mantzoros C, Qu D, Lowell B, Maratos-Flier E, Flier JS. Role of leptin in the neuroendocrine response to fasting. Nature. 1996;382:250–252. doi: 10.1038/382250a0. [DOI] [PubMed] [Google Scholar]
- Baeg GH, Zhou R, Perrimon N. Genome-wide RNAi analysis of JAK/STAT signaling components in Drosophila. Genes & development. 2005;19:1861–1870. doi: 10.1101/gad.1320705. [DOI] [PMC free article] [PubMed] [Google Scholar]
- Bard F, Casano L, Mallabiabarrena A, Wallace E, Saito K, Kitayama H, Guizzunti G, Hu Y, Wendler F, Dasgupta R, et al. Functional genomics reveals genes involved in protein secretion and Golgi organization. Nature. 2006;439:604–607. doi: 10.1038/nature04377. [DOI] [PubMed] [Google Scholar]
- Barr FA, Puype M, Vandekerckhove J, Warren G. GRASP65, a protein involved in the stacking of Golgi cisternae. Cell. 1997a;91:253–262. doi: 10.1016/s0092-8674(00)80407-9. [DOI] [PubMed] [Google Scholar]
- Barr VA, Malide D, Zarnowski MJ, Taylor SI, Cushman SW. Insulin stimulates both leptin secretion and production by rat white adipose tissue. Endocrinology. 1997b;138:4463–4472. doi: 10.1210/endo.138.10.5451. [DOI] [PubMed] [Google Scholar]
- Baumbach J, Hummel P, Bickmeyer I, Kowalczyk KM, Frank M, Knorr K, Hildebrandt A, Riedel D, Jackle H, Kuhnlein RP. A Drosophila in vivo screen identifies store-operated calcium entry as a key regulator of adiposity. Cell Metab. 2014;19:331–343. doi: 10.1016/j.cmet.2013.12.004. [DOI] [PubMed] [Google Scholar]
- Beller M, Bulankina AV, Hsiao HH, Urlaub H, Jackle H, Kuhnlein RP. PERILIPIN-dependent control of lipid droplet structure and fat storage in Drosophila. Cell Metab. 2010;12:521–532. doi: 10.1016/j.cmet.2010.10.001. [DOI] [PubMed] [Google Scholar]
- Beshel J, Dubnau J, Zhong Y. A Leptin Analog Locally Produced in the Brain Acts via a Conserved Neural Circuit to Modulate Obesity-Linked Behaviors in Drosophila. Cell Metab. 2017;25:208–217. doi: 10.1016/j.cmet.2016.12.013. [DOI] [PMC free article] [PubMed] [Google Scholar]
- Bi J, Wang W, Liu Z, Huang X, Jiang Q, Liu G, Wang Y, Huang X. Seipin promotes adipose tissue fat storage through the ER Ca(2)(+)-ATPase SERCA. Cell Metab. 2014;19:861–871. doi: 10.1016/j.cmet.2014.03.028. [DOI] [PubMed] [Google Scholar]
- Bleasdale JE, Thakur NR, Gremban RS, Bundy GL, Fitzpatrick FA, Smith RJ, Bunting S. Selective inhibition of receptor-coupled phospholipase C-dependent processes in human platelets and polymorphonuclear neutrophils. J Pharmacol Exp Ther. 1990;255:756–768. [PubMed] [Google Scholar]
- Brankatschk M, Eaton S. Lipoprotein particles cross the blood-brain barrier in Drosophila. J Neurosci. 2010;30:10441–10447. doi: 10.1523/JNEUROSCI.5943-09.2010. [DOI] [PMC free article] [PubMed] [Google Scholar]
- Burgess GM, Godfrey PP, McKinney JS, Berridge MJ, Irvine RF, Putney JW., Jr The second messenger linking receptor activation to internal Ca release in liver. Nature. 1984;309:63–66. doi: 10.1038/309063a0. [DOI] [PubMed] [Google Scholar]
- Burmester T, Antoniewski C, Lepesant JA. Ecdysone-regulation of synthesis and processing of fat body protein 1, the larval serum protein receptor of Drosophila melanogaster. Eur J Biochem. 1999;262:49–55. doi: 10.1046/j.1432-1327.1999.00315.x. [DOI] [PubMed] [Google Scholar]
- Chen Y, Wei LN, Muller JD. Probing protein oligomerization in living cells with fluorescence fluctuation spectroscopy. Proc Natl Acad Sci U S A. 2003;100:15492–15497. doi: 10.1073/pnas.2533045100. [DOI] [PMC free article] [PubMed] [Google Scholar]
- Dascher C, Matteson J, Balch WE. Syntaxin 5 regulates endoplasmic reticulum to Golgi transport. J Biol Chem. 1994;269:29363–29366. [PubMed] [Google Scholar]
- Dugail I, Hajduch E. A new look at adipocyte lipid droplets: towards a role in the sensing of triacylglycerol stores? Cell Mol Life Sci. 2007;64:2452–2458. doi: 10.1007/s00018-007-7277-6. [DOI] [PMC free article] [PubMed] [Google Scholar]
- Duncan RE, Ahmadian M, Jaworski K, Sarkadi-Nagy E, Sul HS. Regulation of lipolysis in adipocytes. Annu Rev Nutr. 2007;27:79–101. doi: 10.1146/annurev.nutr.27.061406.093734. [DOI] [PMC free article] [PubMed] [Google Scholar]
- Dupont N, Jiang S, Pilli M, Ornatowski W, Bhattacharya D, Deretic V. Autophagy-based unconventional secretory pathway for extracellular delivery of IL-1beta. Embo J. 2011;30:4701–4711. doi: 10.1038/emboj.2011.398. [DOI] [PMC free article] [PubMed] [Google Scholar]
- Farooqi IS, O’Rahilly S. Leptin: a pivotal regulator of human energy homeostasis. The American journal of clinical nutrition. 2009;89:980S–984S. doi: 10.3945/ajcn.2008.26788C. [DOI] [PubMed] [Google Scholar]
- Ferre F, Clote P. DiANNA 1.1: an extension of the DiANNA web server for ternary cysteine classification. Nucleic Acids Res. 2006;34:W182–185. doi: 10.1093/nar/gkl189. [DOI] [PMC free article] [PubMed] [Google Scholar]
- Flak JN, Myers MG., Jr CNS Mechanisms of Leptin Action. Mol Endocrinol. 2015:me20151232. doi: 10.1210/me.2015-1232. [DOI] [PMC free article] [PubMed] [Google Scholar]
- Flier JS, Maratos-Flier E. Leptin’s Physiologic Role: Does the Emperor of Energy Balance Have No Clothes? Cell Metab. 2017;26:24–26. doi: 10.1016/j.cmet.2017.05.013. [DOI] [PubMed] [Google Scholar]
- Frand AR, Kaiser CA. The ERO1 gene of yeast is required for oxidation of protein dithiols in the endoplasmic reticulum. Mol Cell. 1998;1:161–170. doi: 10.1016/s1097-2765(00)80017-9. [DOI] [PubMed] [Google Scholar]
- Fried SK, Ricci MR, Russell CD, Laferrere B. Regulation of leptin production in humans. J Nutr. 2000;130:3127S–3131S. doi: 10.1093/jn/130.12.3127S. [DOI] [PubMed] [Google Scholar]
- Friggi-Grelin F, Rabouille C, Therond P. The cis-Golgi Drosophila GMAP has a role in anterograde transport and Golgi organization in vivo, similar to its mammalian ortholog in tissue culture cells. Eur J Cell Biol. 2006;85:1155–1166. doi: 10.1016/j.ejcb.2006.07.001. [DOI] [PubMed] [Google Scholar]
- Fu S, Yang L, Li P, Hofmann O, Dicker L, Hide W, Lin X, Watkins SM, Ivanov AR, Hotamisligil GS. Aberrant lipid metabolism disrupts calcium homeostasis causing liver endoplasmic reticulum stress in obesity. Nature. 2011;473:528–531. doi: 10.1038/nature09968. [DOI] [PMC free article] [PubMed] [Google Scholar]
- Gee HY, Noh SH, Tang BL, Kim KH, Lee MG. Rescue of DeltaF508-CFTR trafficking via a GRASP-dependent unconventional secretion pathway. Cell. 2011;146:746–760. doi: 10.1016/j.cell.2011.07.021. [DOI] [PubMed] [Google Scholar]
- Geminard C, Rulifson EJ, Leopold P. Remote control of insulin secretion by fat cells in Drosophila. Cell Metab. 2009;10:199–207. doi: 10.1016/j.cmet.2009.08.002. [DOI] [PubMed] [Google Scholar]
- Grieve AG, Rabouille C. Golgi bypass: skirting around the heart of classical secretion. Cold Spring Harb Perspect Biol. 2011:3. doi: 10.1101/cshperspect.a005298. [DOI] [PMC free article] [PubMed] [Google Scholar]
- Gronke S, Muller G, Hirsch J, Fellert S, Andreou A, Haase T, Jackle H, Kuhnlein RP. Dual lipolytic control of body fat storage and mobilization in Drosophila. PLoS biology. 2007;5:e137. doi: 10.1371/journal.pbio.0050137. [DOI] [PMC free article] [PubMed] [Google Scholar]
- Guo Y, Walther TC, Rao M, Stuurman N, Goshima G, Terayama K, Wong JS, Vale RD, Walter P, Farese RV. Functional genomic screen reveals genes involved in lipid-droplet formation and utilization. Nature. 2008;453:657–661. doi: 10.1038/nature06928. [DOI] [PMC free article] [PubMed] [Google Scholar]
- Hombria JC, Brown S, Hader S, Zeidler MP. Characterisation of Upd2, a Drosophila JAK/STAT pathway ligand. Dev Biol. 2005;288:420–433. doi: 10.1016/j.ydbio.2005.09.040. [DOI] [PubMed] [Google Scholar]
- Housden BE, Valvezan AJ, Kelley C, Sopko R, Hu Y, Roesel C, Lin S, Buckner M, Tao R, Yilmazel B, et al. Identification of potential drug targets for tuberous sclerosis complex by synthetic screens combining CRISPR-based knockouts with RNAi. Sci Signal. 2015;8:rs9. doi: 10.1126/scisignal.aab3729. [DOI] [PMC free article] [PubMed] [Google Scholar]
- Hu Y, Comjean A, Perrimon N, Mohr SE. The Drosophila Gene Expression Tool (DGET) for expression analyses. BMC Bioinformatics. 2017;18:98. doi: 10.1186/s12859-017-1509-z. [DOI] [PMC free article] [PubMed] [Google Scholar]
- Kim SK, Rulifson EJ. Conserved mechanisms of glucose sensing and regulation by Drosophila corpora cardiaca cells. Nature. 2004;431:316–320. doi: 10.1038/nature02897. [DOI] [PubMed] [Google Scholar]
- Kinseth MA, Anjard C, Fuller D, Guizzunti G, Loomis WF, Malhotra V. The Golgi-associated protein GRASP is required for unconventional protein secretion during development. Cell. 2007;130:524–534. doi: 10.1016/j.cell.2007.06.029. [DOI] [PubMed] [Google Scholar]
- Koh YH, Popova E, Thomas U, Griffith LC, Budnik V. Regulation of DLG localization at synapses by CaMKII-dependent phosphorylation. Cell. 1999;98:353–363. doi: 10.1016/s0092-8674(00)81964-9. [DOI] [PMC free article] [PubMed] [Google Scholar]
- Kondylis V, Tang Y, Fuchs F, Boutros M, Rabouille C. Identification of ER proteins involved in the functional organisation of the early secretory pathway in Drosophila cells by a targeted RNAi screen. PLoS One. 2011;6:e17173. doi: 10.1371/journal.pone.0017173. [DOI] [PMC free article] [PubMed] [Google Scholar]
- Krahmer N, Hilger M, Kory N, Wilfling F, Stoehr G, Mann M, Farese RV, Jr, Walther TC. Protein correlation profiles identify lipid droplet proteins with high confidence. Mol Cell Proteomics. 2013;12:1115–1126. doi: 10.1074/mcp.M112.020230. [DOI] [PMC free article] [PubMed] [Google Scholar]
- Lazareva AA, Roman G, Mattox W, Hardin PE, Dauwalder B. A role for the adult fat body in Drosophila male courtship behavior. PLoS Genet. 2007;3:e16. doi: 10.1371/journal.pgen.0030016. [DOI] [PMC free article] [PubMed] [Google Scholar]
- Lee JR, Urban S, Garvey CF, Freeman M. Regulated intracellular ligand transport and proteolysis control EGF signal activation in Drosophila. Cell. 2001;107:161–171. doi: 10.1016/s0092-8674(01)00526-8. [DOI] [PubMed] [Google Scholar]
- Lee MJ, Fried SK. Multilevel regulation of leptin storage, turnover, and secretion by feeding and insulin in rat adipose tissue. Journal of lipid research. 2006;47:1984–1993. doi: 10.1194/jlr.M600065-JLR200. [DOI] [PubMed] [Google Scholar]
- Lee MJ, Wang Y, Ricci MR, Sullivan S, Russell CD, Fried SK. Acute and chronic regulation of leptin synthesis, storage, and secretion by insulin and dexamethasone in human adipose tissue. American journal of physiology Endocrinology and metabolism. 2007;292:E858–864. doi: 10.1152/ajpendo.00439.2006. [DOI] [PubMed] [Google Scholar]
- Lippincott-Schwartz J, Yuan LC, Bonifacino JS, Klausner RD. Rapid redistribution of Golgi proteins into the ER in cells treated with brefeldin A: evidence for membrane cycling from Golgi to ER. Cell. 1989;56:801–813. doi: 10.1016/0092-8674(89)90685-5. [DOI] [PMC free article] [PubMed] [Google Scholar]
- Maley F, Trimble RB, Tarentino AL, Plummer TH., Jr Characterization of glycoproteins and their associated oligosaccharides through the use of endoglycosidases. Anal Biochem. 1989;180:195–204. doi: 10.1016/0003-2697(89)90115-2. [DOI] [PubMed] [Google Scholar]
- Manjithaya R, Anjard C, Loomis WF, Subramani S. Unconventional secretion of Pichia pastoris Acb1 is dependent on GRASP protein, peroxisomal functions, and autophagosome formation. J Cell Biol. 2010;188:537–546. doi: 10.1083/jcb.200911149. [DOI] [PMC free article] [PubMed] [Google Scholar]
- Marra P, Maffucci T, Daniele T, Tullio GD, Ikehara Y, Chan EK, Luini A, Beznoussenko G, Mironov A, De Matteis MA. The GM130 and GRASP65 Golgi proteins cycle through and define a subdomain of the intermediate compartment. Nat Cell Biol. 2001;3:1101–1113. doi: 10.1038/ncb1201-1101. [DOI] [PubMed] [Google Scholar]
- Montague CT, Farooqi IS, Whitehead JP, Soos MA, Rau H, Wareham NJ, Sewter CP, Digby JE, Mohammed SN, Hurst JA, et al. Congenital leptin deficiency is associated with severe early-onset obesity in humans. Nature. 1997;387:903–908. doi: 10.1038/43185. [DOI] [PubMed] [Google Scholar]
- Moraru A, Cakan-Akdogan G, Strassburger K, Males M, Mueller S, Jabs M, Muelleder M, Frejno M, Braeckman BP, Ralser M, et al. THADA Regulates the Organismal Balance between Energy Storage and Heat Production. Dev Cell. 2017;41:72–81. e76. doi: 10.1016/j.devcel.2017.03.016. [DOI] [PMC free article] [PubMed] [Google Scholar]
- Morton GJ, Cummings DE, Baskin DG, Barsh GS, Schwartz MW. Central nervous system control of food intake and body weight. Nature. 2006;443:289–295. doi: 10.1038/nature05026. [DOI] [PubMed] [Google Scholar]
- Nallamsetty S, Austin BP, Penrose KJ, Waugh DS. Gateway vectors for the production of combinatorially-tagged His6-MBP fusion proteins in the cytoplasm and periplasm of Escherichia coli. Protein Sci. 2005;14:2964–2971. doi: 10.1110/ps.051718605. [DOI] [PMC free article] [PubMed] [Google Scholar]
- Neumuller RA, Wirtz-Peitz F, Lee S, Kwon Y, Buckner M, Hoskins RA, Venken KJ, Bellen HJ, Mohr SE, Perrimon N. Stringent analysis of gene function and protein-protein interactions using fluorescently tagged genes. Genetics. 2012;190:931–940. doi: 10.1534/genetics.111.136465. [DOI] [PMC free article] [PubMed] [Google Scholar]
- Ozcan L, Cristina de Souza J, Harari AA, Backs J, Olson EN, Tabas I. Activation of calcium/calmodulin-dependent protein kinase II in obesity mediates suppression of hepatic insulin signaling. Cell Metab. 2013;18:803–815. doi: 10.1016/j.cmet.2013.10.011. [DOI] [PMC free article] [PubMed] [Google Scholar]
- Ozcan L, Wong CC, Li G, Xu T, Pajvani U, Park SK, Wronska A, Chen BX, Marks AR, Fukamizu A, et al. Calcium signaling through CaMKII regulates hepatic glucose production in fasting and obesity. Cell Metab. 2012;15:739–751. doi: 10.1016/j.cmet.2012.03.002. [DOI] [PMC free article] [PubMed] [Google Scholar]
- Pfeiffer BD, Ngo TT, Hibbard KL, Murphy C, Jenett A, Truman JW, Rubin GM. Refinement of tools for targeted gene expression in Drosophila. Genetics. 2010;186:735–755. doi: 10.1534/genetics.110.119917. [DOI] [PMC free article] [PubMed] [Google Scholar]
- Rajan A, Perrimon N. Drosophila Cytokine Unpaired 2 Regulates Physiological Homeostasis by Remotely Controlling Insulin Secretion. Cell. 2012;151:123–137. doi: 10.1016/j.cell.2012.08.019. [DOI] [PMC free article] [PubMed] [Google Scholar]
- Ren X, Sun J, Housden BE, Hu Y, Roesel C, Lin S, Liu LP, Yang Z, Mao D, Sun L, et al. Optimized gene editing technology for Drosophila melanogaster using germ line-specific Cas9. Proc Natl Acad Sci U S A. 2013;110:19012–19017. doi: 10.1073/pnas.1318481110. [DOI] [PMC free article] [PubMed] [Google Scholar]
- Roh C, Thoidis G, Farmer SR, Kandror KV. Identification and characterization of leptin-containing intracellular compartment in rat adipose cells. American journal of physiology Endocrinology and metabolism. 2000;279:E893–899. doi: 10.1152/ajpendo.2000.279.4.E893. [DOI] [PubMed] [Google Scholar]
- Scherer PE, Williams S, Fogliano M, Baldini G, Lodish HF. A novel serum protein similar to C1q, produced exclusively in adipocytes. J Biol Chem. 1995;270:26746–26749. doi: 10.1074/jbc.270.45.26746. [DOI] [PubMed] [Google Scholar]
- Schindelin J, Arganda-Carreras I, Frise E, Kaynig V, Longair M, Pietzsch T, Preibisch S, Rueden C, Saalfeld S, Schmid B, et al. Fiji: an open-source platform for biological-image analysis. Nat Methods. 2012;9:676–682. doi: 10.1038/nmeth.2019. [DOI] [PMC free article] [PubMed] [Google Scholar]
- Schotman H, Karhinen L, Rabouille C. dGRASP-mediated noncanonical integrin secretion is required for Drosophila epithelial remodeling. Dev Cell. 2008;14:171–182. doi: 10.1016/j.devcel.2007.12.006. [DOI] [PubMed] [Google Scholar]
- Schuster CM, Davis GW, Fetter RD, Goodman CS. Genetic dissection of structural and functional components of synaptic plasticity. I. Fasciclin II controls synaptic stabilization and growth. Neuron. 1996;17:641–654. doi: 10.1016/s0896-6273(00)80197-x. [DOI] [PubMed] [Google Scholar]
- Soni KG, Mardones GA, Sougrat R, Smirnova E, Jackson CL, Bonifacino JS. Coatomer-dependent protein delivery to lipid droplets. Journal of cell science. 2009;122:1834–1841. doi: 10.1242/jcs.045849. [DOI] [PMC free article] [PubMed] [Google Scholar]
- Subramanian M, Metya SK, Sadaf S, Kumar S, Schwudke D, Hasan G. Altered lipid homeostasis in Drosophila InsP3 receptor mutants leads to obesity and hyperphagia. Dis Model Mech. 2013;6:734–744. doi: 10.1242/dmm.010017. [DOI] [PMC free article] [PubMed] [Google Scholar]
- Tennessen JM, Barry WE, Cox J, Thummel CS. Methods for studying metabolism in Drosophila. Methods. 2014;68:105–115. doi: 10.1016/j.ymeth.2014.02.034. [DOI] [PMC free article] [PubMed] [Google Scholar]
- Trayhurn P, Beattie JH. Physiological role of adipose tissue: white adipose tissue as an endocrine and secretory organ. Proc Nutr Soc. 2001;60:329–339. doi: 10.1079/pns200194. [DOI] [PubMed] [Google Scholar]
- Tveit H, Akslen LK, Fagereng GL, Tranulis MA, Prydz K. A secretory Golgi bypass route to the apical surface domain of epithelial MDCK cells. Traffic. 2009;10:1685–1695. doi: 10.1111/j.1600-0854.2009.00984.x. [DOI] [PubMed] [Google Scholar]
- Veenendaal T, Jarvela T, Grieve AG, van Es JH, Linstedt AD, Rabouille C. GRASP65 controls the cis Golgi integrity in vivo. Biol Open. 2014;3:431–443. doi: 10.1242/bio.20147757. [DOI] [PMC free article] [PubMed] [Google Scholar]
- Walther TC, Farese RV., Jr Lipid droplets and cellular lipid metabolism. Annu Rev Biochem. 2012;81:687–714. doi: 10.1146/annurev-biochem-061009-102430. [DOI] [PMC free article] [PubMed] [Google Scholar]
- Wang Y, Li G, Goode J, Paz JC, Ouyang K, Screaton R, Fischer WH, Chen J, Tabas I, Montminy M. Inositol-1,4,5-trisphosphate receptor regulates hepatic gluconeogenesis in fasting and diabetes. Nature. 2012;485:128–132. doi: 10.1038/nature10988. [DOI] [PMC free article] [PubMed] [Google Scholar]
- Wang Y, Satoh A, Warren G. Mapping the functional domains of the Golgi stacking factor GRASP65. J Biol Chem. 2005;280:4921–4928. doi: 10.1074/jbc.M412407200. [DOI] [PMC free article] [PubMed] [Google Scholar]
- Wright VM, Vogt KL, Smythe E, Zeidler MP. Differential activities of the Drosophila JAK/STAT pathway ligands Upd, Upd2 and Upd3. Cell Signal. 2011;23:920–927. doi: 10.1016/j.cellsig.2011.01.020. [DOI] [PubMed] [Google Scholar]
- Wu Q, Zhang Y, Xu J, Shen P. Regulation of hunger-driven behaviors by neural ribosomal S6 kinase in Drosophila. Proc Natl Acad Sci U S A. 2005;102:13289–13294. doi: 10.1073/pnas.0501914102. [DOI] [PMC free article] [PubMed] [Google Scholar]
- Xiang Y, Wang Y. GRASP55 and GRASP65 play complementary and essential roles in Golgi cisternal stacking. J Cell Biol. 2010;188:237–251. doi: 10.1083/jcb.200907132. [DOI] [PMC free article] [PubMed] [Google Scholar]
- Yoshimura S, Yoshioka K, Barr FA, Lowe M, Nakayama K, Ohkuma S, Nakamura N. Convergence of cell cycle regulation and growth factor signals on GRASP65. J Biol Chem. 2005;280:23048–23056. doi: 10.1074/jbc.M502442200. [DOI] [PubMed] [Google Scholar]
- Zartman J, Restrepo S, Basler K. A high-throughput template for optimizing Drosophila organ culture with response-surface methods. Development. 2013;140:667–674. doi: 10.1242/dev.088872. [DOI] [PubMed] [Google Scholar]
- Zhang H, Liu J, Li CR, Momen B, Kohanski RA, Pick L. Deletion of Drosophila insulin-like peptides causes growth defects and metabolic abnormalities. Proc Natl Acad Sci U S A. 2009;106:19617–19622. doi: 10.1073/pnas.0905083106. [DOI] [PMC free article] [PubMed] [Google Scholar]
- Zhang Y, Proenca R, Maffei M, Barone M, Leopold L, Friedman JM. Positional cloning of the mouse obese gene and its human homologue. Nature. 1994;372:425–432. doi: 10.1038/372425a0. [DOI] [PubMed] [Google Scholar]
Associated Data
This section collects any data citations, data availability statements, or supplementary materials included in this article.