Abstract
In this article, we demonstrate the use of bio-conjugated 2D graphene oxide (bio-GO) nanostructure to probe breast cancer cell (SKBR3) with excellent discrimination over other types of circulating tumor cells. We distinctly observed that bio-GO nanostructure targets and bind SKBR3 cell selectively in the cell mixture. Longer incubation of SKBR3 cell with bio-GO causes Raman signal “turn off” when excited with 532 nm laser. This is attributed to penetration of the bio-GO through the plasma membrane of the cell by generating transient hole. Extraction of GO after cell digestion also support the internalization rubric of 2D graphene through cell membrane. Our experimental data with the HaCaT healthy cell line, as well as with LNCaP prostate cancer cell line clearly demonstrated that this Raman scattering assay is highly selective to SKBR3. The mechanism of selectivity and the assay’s response change have been verified and discussed utilizing fluorescence properties of GO and various other techniques. The experimental results open up a possibility of new label free Raman scattering assay, for reliable diagnosis of cancer cell lines by monitoring “turn-off” of the Raman signal from Bio-GO nanostructure.
Keywords: Raman Scattering, Graphene Oxide, SKBR3 Cells, LNCaP Cells, Imaging
Introduction
According to word health organization 8.2 million people die each year and an alarming 70 % increase in new cases of cancer expected over the next two decades (http://www.who.int/cancer/en/)1–4. More than 30 % of cancer deaths can be prevented by avoiding key risk factors or using state or art preventive diagnosis techniques. Early detection, accurate diagnosis and effective treatment not only helps in increasing cancer survival rate but also aids in effective pain management in terminal patients 5–7. Therefore, a comprehensive cancer control plan is needed to improve cancer prevention and care. Amongst all type of cancer, breast cancer is most common cancer among American women as well as men. According to American cancer society, about one in eight (12 %) women in the US will develop invasive breast cancer during their lifetime (http://www.cancer.org/cancer/breastcancer/detailedguide/breast-cancer-key-statistics). According to American cancer society about ~0.23 million new cases of invasive breast cancer will be diagnosed and about 40,000 women will die from breast cancer in 20168. Therefore, there is urgent need to develop an effective early diagnosis strategic key to combat this chronic disease. Among various available method of early stage diagnosis, nanotechnology is an emerging research area that integrates highly active material at nanoscale to the biological targets and has potential to provide novel diagnostic tools for early stage detection of primary cancer and to provide improved therapeutic protocols.
Graphene oxide is a proven material for bio-sensing and imaging in preclinical stage 9–20. GO is an oxidized derivative of graphene containing multifunctional group and sp2 conjugated bonds on its surface 21–23. Construction of GO-based biomedical device requires understanding of electric-field-induced changes in the structure of the GO at molecular level. Raman spectroscopy is a proven nondestructive tool for characterization of carbon-based materials because of its ability to monitor the structure of sp2 networks, doping, defects, and chemical modifications. Raman spectrum of GO consists of prominent G peak near 1580 cm−1 due to bond stretching of all pairs of sp2 atoms and intense D band near 1360 cm−1 associated with breathing modes of sp2 atoms in rings24–27. Defects are required for activation of this mode. Increase in relative intensity of D band indicates reduction in size of sp2 domains and/or formation of sp3 defects. Sensitivity of G-band position upon doping of charged compounds leading to an influence on the photon–electron coupling by the electric field was demonstrated in the case of graphene and graphene oxide24, 27. It is well demonstrated that GO with high surface area to volume ratio and are similar in size to biological macromolecule are promising candidate for the development of bio sensing and imaging devices 28–30. Attaching antibodies or other targeting agent such as specifically designed aptamer to the surface of nano-carriers to achieve specific targeting of cancerous cell is already been demonstrated by several groups and proven to promising modality for therapeutic and diagnostic oncology11, 28, 30–33. Over expression of human epidermal growth factor receptor 2 (HER2)/neu is found in about 30% of different breast cancer cases and 25 % cases of ovarian cancer cases. Due to the unique optical properties of nanosystems, over the last decades several groups have been developing suitable combination of conjugation chemistry to achieve high level of selectivity and sensitivity of the targeted cancer cells. Very recently, Kim and coworkers has developed Ag nano-cell encoded graphene oxide nano probe and used as ultrasensitive Raman reporter exhibiting strong resonance Raman scattering including very D and G modes and demonstrated it potential for bio-imaging34. Fluorescent based tags are the most preferred existing method to detect biological cells, using this method, risk of adverse effect on the immunoreactivity of the primary antibody by the labeling somehow limits the sensitivity of this method35. Moreover, labeling primary fluorophore is time consuming, expansive and sometime flexibility in the choice of labeling contrast agent from one experiment to another lead minimal signal amplification. Numerous other optical approaches such as fluorescence or surface enhanced Raman spectroscopy offers high level of sensitivity. There is great interest in developing biosensors that allow direct label-free optical identification to avoid additional enrichment and conjugation of the infected sample to be tested. Tian et al has recently reported a highly sensitive biosensor utilizing the polarization dependent absorption property of graphene oxide that is capable of tracking small quantity of cancer cell mixed with normal cells16. Raman spectroscopy has attracted significant attention, because it is direct, does not require any labeling and involves simple instrumentation, nondestructive, label-free and highly sensitive. Moreover, analytes may be detected with or without pre-enrichment steps. Due to the strong inherent Raman signals of GO and carbon related materials Liu and coworkers recently reported a fast targeted Raman imaging of cancer cells using SWNTs-nobel metal nanocomposites as Raman label36. Yang and coworkers has reported a direct GO based Raman scattering probe for cancer cell imaging, where they used Ag-Go composite to enhance the Raman bands of GO for fast cellular probing37. This method is also useful where immunophenotypic analysis of cancer cell encounters limitation due to the fact that the antigens used for cell recognition are normally non-exclusively expressed on any single cell type and greatly influences selectivity by producing falls positive signals38–40. Given the complexity and diversity of the cancer cells we report herein the direct evidence of GO internalization through aquaporine of breast cancer cell that causes disappearance of bond stretching peak of sp2 atoms at 1580 cm−1 (G band) and breathing modes 1360cm−1 (D band) of sp2 atoms in GO. Meanwhile poor penetration of the visible light through the tissue presents a challenge, this article demonstrates that anti-HER2/c-erb-2 anti-body conjugated GO can easily penetrate through aquaporine water channel of the cell, and prohibits direct exposer of 532 nm (visible) laser light to GO. Consequently, Raman signal from the test sample turns off. The concentration dependent incubation of bio-GO with breast cancer cell revels that the sensitivity of the system is up to ~60 cell/mL. The internalization of GO through the SKBR3 aquaporine channels and consequent quenching of Raman signal has been evaluated using second NIR window light which is popularly used for targeted imaging and photo thermal therapy. We used dual functionalization method of micron sized graphene oxide with S6 aptamer along with anti-HER2/c-erb-2 anti-body to optimize the selectivity and sensitivity of this Raman scattering signal quenching technique.
Experimental
Material and experiments
Graphite powder, Sodium Nitrate (NaNO3), Potassium Permanganate (KMnO4), (N-hydroxysulfosuccinimide) NHS, (1-ethyl-3-(3-dimethylaminopropyl)carbodiimide hydrochloride) EDC, phosphate buffered saline (PBS), 2-ethanesulfonic acid (MES) and HEPES buffer solution were purchased from Sigma-Aldrich. Monoclonal anti-HER2/c-erb-2 antibodies are purchased from Thermo Fisher Scientific, -SH-modified S6 RNA aptamers were purchased from Midland Certified Reagent. The human adenocarcinoma breast cancer cell line SKBR3, which overexpresses HER2/c-erb-2 gene product is obtained from the American Type Culture collection (ATCC, Rockville, MD). We also purchased another batch of breast cancer cell line (MDA-MB-231) from ATCC. Human skin keratinocytes, a transformed human epidermal cell line, is obtained from Dr. Norbert Fusenig of the Gremany Cancer Research Center, Heidelberg, Germany.
Synthesis of water-soluble Graphene oxide (GO)
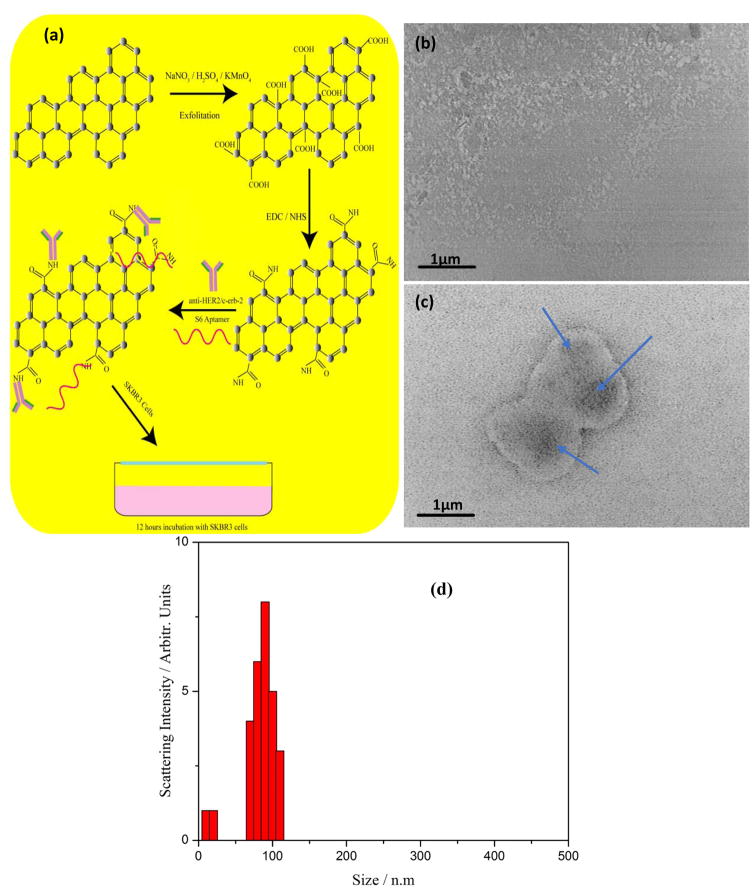
Biocompatible water-soluble graphene oxide nanoparticle is prepared from natural graphite powder using Hummers method 41, 42 as shown in Figure 1(a). Briefly, 0.5 g of NaNO3 and 25 ml of concentrated H2SO4 is mixed at 0°C and the reaction mixture is kept for 30 minute in ice-cold condition. To this mixture, 3.0 g of saturated KMnO4 (in water) is slowly added at 0°C with constant stirring for two hours. The reaction mixture is heated to 40°C for another two hours and left overnight at room temperature. The mixture is then diluted with 25 ml distilled water and heated at 90°C for 15 minutes. The reaction is stopped by adding 100 ml distilled water and 5 ml, 30% H2O2 resulting in a color change from dark brown to bright yellow. Further, the solution is filtered to remove metal ions from the reaction mixture and washed with 50 mL dilute HCl solution. Obtained graphene oxide solution was dialyzed for a week to completely remove the metal ions and acids. The product was collected after high speed centrifugation (13,000 rpm) and washed several times by resuspending in distilled water. Finally, pristine graphene oxide (GO) is obtained by freeze-drying at 45°C for 15 days. TEM image analysis of the prepared sample indicated that the average lateral size of the layered graphene oxide sheet is ~0.08μm – 0.1μm as shown in Figure 1(b). It is further confirmed with hydrodynamic ratio analysis of the wet sample.
Figure 1.
(a) Schematics of synthesis and bioconjugation protocol of water soluble and biocompatible Graphene oxide from graphite powder. (b) Transmission electron microscope image of synthesized nanometer size two-dimensional graphene oxide soluble in aqueous media. (c) Transmission electron microscope image showing a significant binding and accumulation of S6 RNA aptamer and anti-HER2/c-erb-2 functionalized GO on the SKBR3 cell surface. (d) Size distribution of synthesized graphene oxide nanoparticle measured by the dynamic light scattering technique for monodisperse ~100 nm size.
Conjugation of 2D Graphene Oxide (GO)
To target SKBR3 cell, we used EDC/NHS esterification of GO followed by anti-HER2 antibody and S6 aptamer functionalization on the two-dimensional sheet. For experimental purposes, 6.0 mg of GO is dissolved in 3 mL MES buffer, 2 mL of 2 mg/mL NHS(N-hydroxysulfosuccinimide) was added into GO suspension. After vortex, 1 mL of 2 mg/mL EDC(1-ethyl-3-(3-dimethylaminopropyl)carbodiimide hydrochloride) was added to the reaction mixture. At the final step anti-HER2, antibody and S6 aptamer was functionalized to the nano-sheet. Testing the biocompatibility is a very important step in order ensure the feasibility for biological application. For this purpose, different kinds infected cell lines as well as normal skin cell HaCaT cells (6.2 × 10⁶ cells/mL) are incubated separately with functionalized GO sheet colloid for 24 h. Cell viability is measured using MTT assay. We observed 98 % cell viability after 24 h of incubation. No prominent cytotoxicity is observed from the 50 set of experimental samples. Alternate assessment of cytotoxicity was performed using tetrazolium salt (WST-8) and reactive oxygen species assay, we did not observe any promising effect on the SKBR3 cells viability from bioconjugated and unconjugated GO. This clearly demonstrates that bio- GO can be effectively used for biological studies.
Cellular Incubation with conjugated Graphene Oxide colloid
Cancer cells are cultured using standard ATCC protocols in humidified incubator at 37°C under 5 % CO2 and 95 % oxygen atmosphere. Before each experiment, cells are diluted in PBS buffer to maintain cell concentration of 1.5 × 10⁸ cells/mL. An enzyme-linked immunosorbent assay kit was used to quantify HER2 in different test cells. We found ~ 510 ng/mL of HER2 attached on SKBR3 cells, whereas ~ 68 pg/ml in the case of healthy HaCaT cells, and ~ 360 pg/ml is found in MDA-MB-231 cancer cells.
Measurement of Raman spectra from bio-GO
We have used a continuous wavelength DPSSL laser from laser glow technology (LSR-0671-TFM-00300-10) and (LSR-532-TFM-500-10). The laser is operated with 670nm and 532nm as an excitation light source, in combination with InPhotonics 670 nm (TT265044) and 532 nm (TT237316) Raman fiber optic probe. The probe has 105μm excitation and 200μm collection capability with filtering and steering micro-optics. Ocean Optics QE65000 spectrometers equipped with CCD and spectra suite software is used to process Raman scattering data and analysis. IR radiations are prone to damage biological cells, to avoid this situation we maintained the ultra-low doses (~0.22W/cm2) of 670 nm radiation through the course of experiment. Though GO does not show prominent fluorescence at NIR, IR or FIR, however in order to avoid any residual fluorescence background from the Raman spectra, we used LabRam HR, from Horriba Jobin Yvon confocal Raman setup at confocal hole and slit width ranging from 10 μm – 100 μm to minimize fluorescence background from Raman spectrum.
Result and Discussion
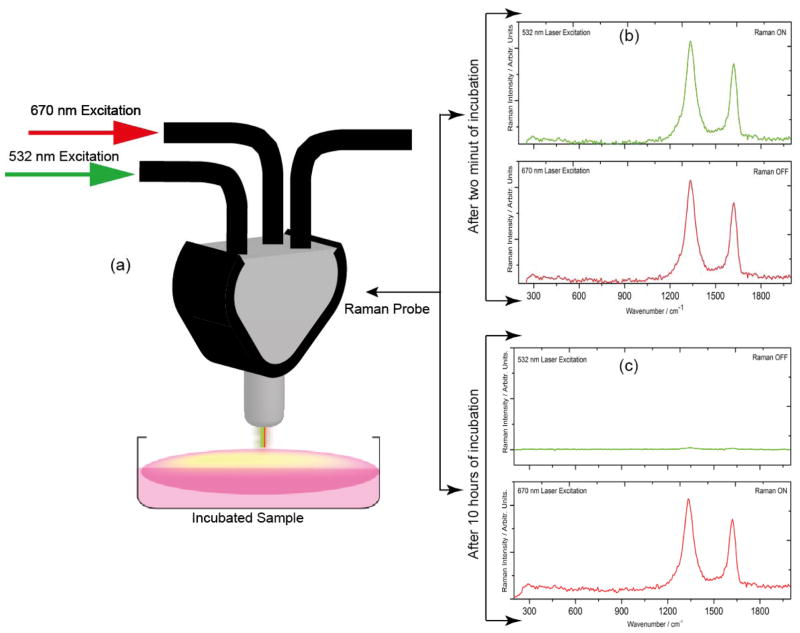
To understand whether bio-GO is compatible for cell analysis in a settings close to clinical diagnosis, different concentrations of SKBR3 cells are spiked into 100 mL of bio-GO. The solution is gently shaken for 5 hours at room temperature. Before each Raman measurement, the solution is washed five times with a buffer, and centrifuged at 14000 rpm. The samples are further characterized using TEM, Raman, Fluorescence and enzyme-linked immunosorbent assay to remove any unused functional graphene and to ensure the existence of graphene loaded with SKBR3 in the suspension. Enzyme-linked immunosorbent assay showed 90 % recovery, indicating that SKBR3 cells are separated along with GO after washing. As shown in Figure 1(c) Transmission electron microscope image of the washed and separated sample, an intense deposition of GO on the cell surface. In order to confirm that bio-GO is still intact with SKBR3 cells, Raman spectra of the colloidal mixture was recorded to monitor ‘D’ and ‘G’ signature band of graphene at 1350 cm−1 and 1582 cm−1 respectively. To accomplish this step, 532 nm laser radiation in the visible region and 670 nm laser radiation in NIR region are selected for this study. It is a well-known fact that electromagnetic radiation in the wavelength range 650 – 1350 nm has maximum penetration in biological cells. Moreover, recent reports show that D and G, Raman bands of graphene oxide are distinctly noticed at these wavelengths 24, 27, 43. As shown in Figure 2(b), a discrete Raman peak around 1350 cm−1(D band) and 1582 cm−1 (G band) can be seen in both (670 nm and 532 nm) excitation wavelengths. We have also noted that the same Raman spectra under 532 nm laser radiation disappeared after 10 hours’ incubation of GO with SKBR3 cells. It is attributed to, the penetration of graphene sheet through aquaporin of the cell wall after long time incubation with SKBR3 cells, where 532 nm radiation encounters opacity from the cell and cell media exhibits no Raman signal from graphene oxide. Whereas graphene signature Raman bands still exists when the solution mixture is exposed with 670 nm laser radiation, indicating that, prolonged incubation, of the nano sized bio-GO penetrated into the cell. As a result, bio-GO is not available for exposure to the 532nm light resulting in the “turn-off” of the Raman signal.
Figure 2.
(a) Raman scattering signal measurement technique from the functionalized graphene oxide solution after 532 nm and 670 nm laser excitation. (b) Raman scattering spectra of graphene oxide functionalized with S6 RNA aptamer and anti-HER2/c-erb-2 antibody incubated with SKBR3 breast cancer cell for two hours, demonstrates the observance Raman D and G band from graphene oxide under both 670 nm and 532 nm laser excitation. (c) Raman spectra of graphene oxide functionalized with S6 RNA aptamer and anti-HER2/c-erb-2 antibody incubated with SKBR3 breast cancer cell for 10 hours clearly demonstrate Raman signal turn off under 532 nm laser excitation whereas Raman signal is still visible when the sample was excited with 670 nm laser radiation.
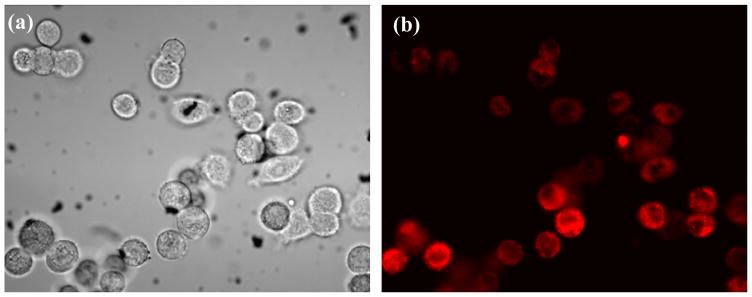
Graphene is a zero-optical band gap Dirac cone material and hence it is not suitable for luminescent studies. However, to enable photoluminescence, the band gap of graphene can be opened by reducing its size to the nanometer scale, introducing reduction in size of sp2 domains and/or formation of sp3 defects or modifying its two-dimensional carbon-carbon network with functional groups44–46. Recent reports show a strong emission from the electronic transitions at various energy levels when the GO is modified to oxy functional groups25, 47, 48. The luminescence properties can be optimized with pH of the GO in aqueous solution. Therefore, to explore the internalization of (anti-HER2/c-erb-2 and S6) bio-GO to SKBR3 cell membrane, 105 cells/mL of SKBR3 cells are incubated with bio-GO for 10 hours. Later, bright field and luminescent image are recorded as shown in Figure 3(a) and 3(b). We observed a significant amount of SKBR3 cells captured by luminescent GO, fluorescing in red region under 514 nm excitation, which clearly indicates that bio-GO is highly specific to SKBR3 breast cancer cell.
Figure 3.
(a) Bright-field inverted microscope image of SKBR3 breast cancer cells incubated with graphene oxide functionalized with S6 RNA aptamer and anti-HER2/c-erb-2 for 10 hours. (b) Fluorescence image of the same sample at 514 nm light exposure demonstrate that bio-GO up take by SKBR3 cell after longer incubation times.
Graphene Oxide recovery and cell digestion (cell-lysis) studies
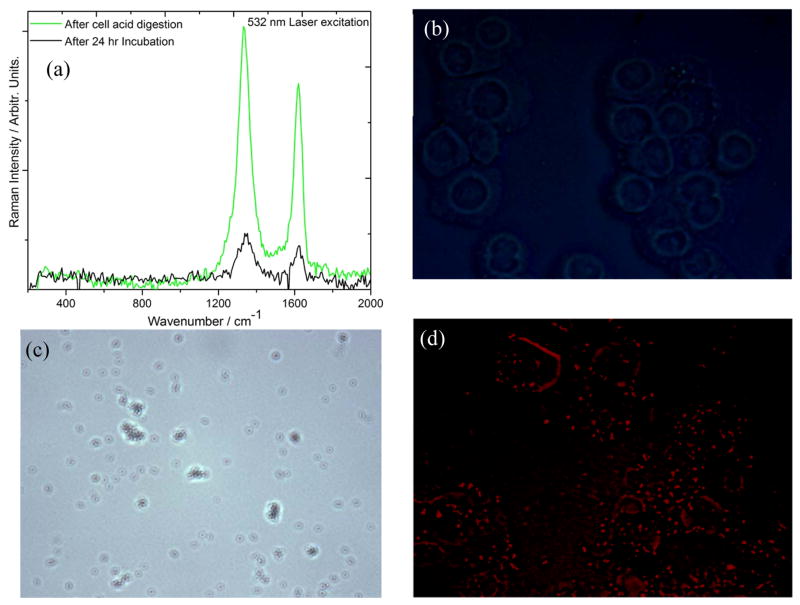
Cell digestion is conducted to understand whether Raman signal “turn-off” of D and G bands at 532 nm excitation is due to internalization process of GO sheet in to the cell wall. To perform this step, 1000 μL of 99.99 % H2SO4 solution is transferred into a 5ml conical flask containing 2000 μL of graphene internalized SKBR3 sample and incubated for 40 minutes in an 80°C water bath. Samples are stored for 10 minutes in ice, later centrifuged at 13000 rpm to collect and separate all the liquid and diluted in 3 mL nanopure water for Raman measurement. We observed a complete retrieval of Raman signal from graphene oxide at 532 nm excitation along with a strong optical background through the spectra in every set of lysed samples as in Figure 4(a). Moreover, we did not observe any significant luminescence of the graphene oxide, when the sample is incubated for 24 hours with SKBR3 cancer cell. However, there is a huge luminescence when the sample is digested with the strong acid Figure 4(b), (c) and 4(d). This is attributed to the defragment the graphene sheet due to the treatment with strong acid. To confirm this inference, 1000 μL of graphene oxide solution was incubated with 500 μL of 99.99 % nitric acid for 40 minutes, we observed similar fluorescence emission pattern as H2SO4 incubated sample. This hypothesis of GO internalization in to the cytoplasm of the SKBR3 cell, is consistent with several other reports showing strong fluorescence after strong acid treatment by conversion of graphene oxide to quantum dots 15, 49–52.
Figure 4.
(a) Raman spectra of bio-GO incubated with SKBR3 cell for 24 hours after that extracted by cell acid digestion. (b) Inverted microscope image shows no fluorescence after 24 hours incubated cell under 514 nm light illumination. (c) Bright field inverted microscope image of acid digested sample showing accumulated GO in white light background. (d) Fluorescence microscope image of acid digested sample shows a strong luminescence directly from nano size graphene oxide retrieved after acid digestion.
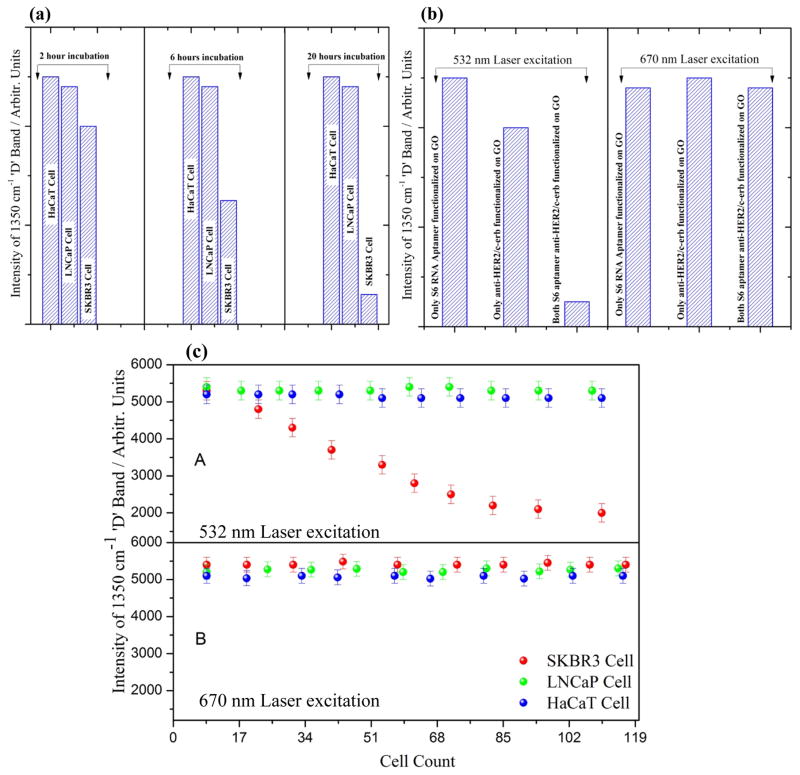
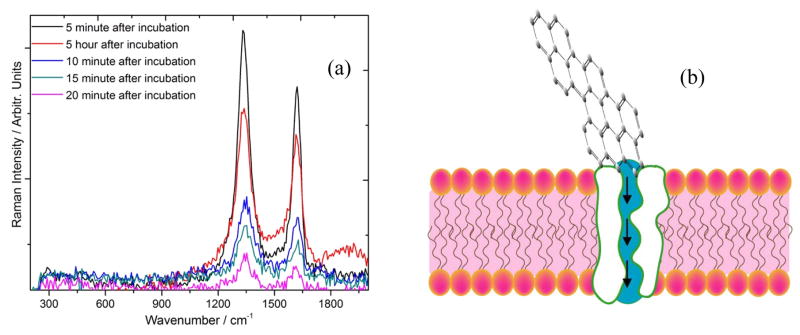
The cellular internalization of bio-GO is monitored in order to determine the parametric effect of time on the cellular uptake and Raman spectra from the biologically loaded graphene oxide colloidal solution. Figure 7(a) shows the cellular up take histogram at different time of incubation at 532 nm laser excitation. For this purpose, SKBR3 cell are incubated with graphene oxide suspension from 5 minutes to 20 hours in presence of 10 % FBS buffer. The cellular uptake efficiency of GO was quantified using ICP-MS. Post treatment cytotoxicity of the graphene oxide was monitored carefully and found ~ 90 % cell viability after 24 hours of incubation. As shown in Figure 5(a), we observed a gradual decrease of Raman signal intensity with the increase of incubation time.
Figure 7.
(a) Bar plot demonstrate the selectivity of S6 RNA aptamer and anti-HER2/c-erb-2 conjugated graphene oxide for SKBR3 cell based on the 1350 cm−1 ‘D’ Raman band at different incubation time. (b) Bar graph indicates, doubly functionalized graphene oxide with S6 RNA aptamer and anti-HER2/c-erb-2 is about 6 times more sensitive then singly functionalized one, and Raman band from the solution mixture disappears under 532 nm excitation where as it is still visible under 670 nm excitation indicates internalization through cell membrane of the SKBR3. (c) Number of cell verses Raman intensity of ‘D’ band of functionalized graphene oxide at 532 nm laser excitation and 670 nm excitation indicates that using 532 nm green laser, ~ 60 SKBR3 cells can be detected with excellent discrimination over LNCaP cell and HaCaT cell.
Figure 5.
(a) Time dependent Raman spectra of graphene oxide conjugated with S6 RNA aptamer and anti-HER2/c-erb-2 under 532 nm excitation. (b) Schematics of possible mechanism of internalization of graphene oxide through aquaporin channels of the cell membrane.
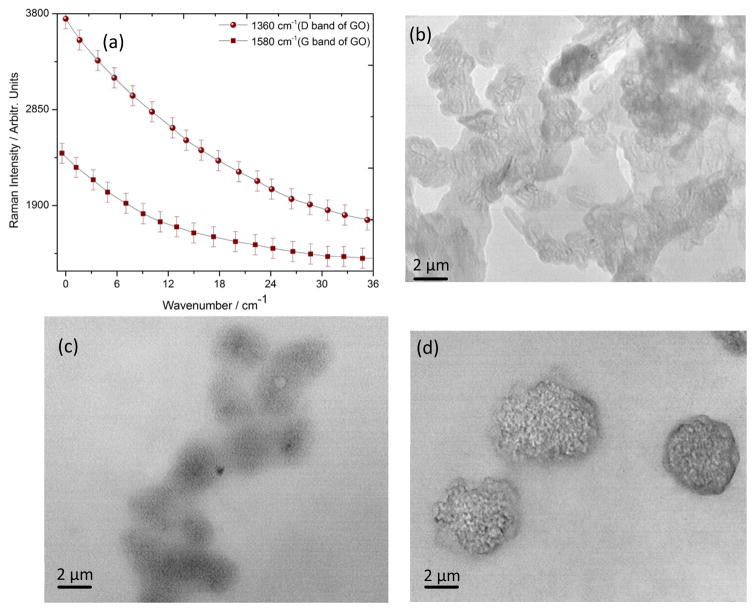
Cellular uptake and metal internalization through the lipid bilayer is not yet understood well, since these layers are made to actively resist any foreign element to pass through the cellular wall. However, numerous reports indicate that, surface functionalization of the nano materials with hydrophilic or hydrophobic or mixed ligands can aid in the penetration by the one or combination of the following mechanism53–58. (1) Nano structures can penetrate the plasma membrane of the cell by generating transient holes. (2) Striated nano sized GO near the aquaporin encounters the lowest energy barrier during translocation across the cell membrane. (3) During translocation, bio-GO is facilitated by the constraint of its rotational degree of freedom due to its anisotropic pattern, which further prevents the free energy of the system from sinking as the GO sheet passes through the hydrophobic core of the bilayer. (4) Finally, the critical force of GO nano sheet allows penetration of these bio functionalized system across the bilayer membrane. Interestingly, we observed a saturation in Raman signal Figure 6(a) and an overall decrement in the D and G band after a critical incubation time. This is attributed to the clustering of GO oxide and formation of bigger aggregate type accumulates as it is well known that smaller clusters are better for scattering hotspot formation and Raman signal enhancement. Large incubation time might decrease the optically active hotspot and as a result the intensity decreases after optimal incubation time. Also TEM images in Figure 6(b–c), indicate well dispersed GO at lower incubation time. However, as we increase the incubation time, GO are drawn closer and eventually result in high level of agglomeration on the cell surface. This clearly demonstrate that the reduction of D and G band intensity is due to the agglomeration followed by internalization of GO on the SKBR3 cell. To further demonstrate the practical application of this phenomenon, we treated bio-GO with HaCaT and the LNCaP prostate cancer cell for various incubation time. We did not observe any significant change in the Raman signal in case of HaCaT and LNCaP prostate cancer cell line treated with S6 RNA aptamer and anti-HER2/c-erb-2 antibody, whereas we observed a huge change in the D and G band intensity in case of SKBR3 breast cancer. As shown in Figure 7(a) and 7(b) Raman signal changes only 0.25 times in presence of 105 HaCaT cells/mL, 0.30 times when we incubated 105 LNCaP cells/mL to functionalized graphene oxide nanoparticle. This result clearly demonstrates that our bio-GO is highly specific for SKBR3 cancer cell line and it can even distinguish different cell lines. To understand the role of dual functionalization of GO with S6 RNA aptamer and anti-HER2/c-erb-2 antibody on Raman response, we performed experiments on the addition of 105 SKBR3 cancer cell/mL, with only S6 RNA aptamer conjugated GO and only anti-HER2/c-erb-2 anti-body conjugated GO. As depicted in Figure 7(b), Raman band intensity of GO almost disappears under 532 nm laser excitation when GO was duly functionalized with S6 RNA aptamer along with anti-HER2/c-erb antibody together whereas no significant effect on the Raman intensity of GO was observed when the sample was exposed with 670 nm laser radiation suggests all the 2D GO is intact on the inner side of the cell wall. We also noted a distinguishable change in the Raman signal intensity for a singly functionalized GO with anti-HER2/c-erb-2 antibody treated with SKBR3 cell. As shown in Figure 7(b) the Raman intensity change was almost 4.5 times when SKBR3 cancer cell is added to anti-HER2/c-erb-2 antibody conjugated GO and around 2.3 in the case of S6 RNA aptamer conjugated GO. Whereas Raman intensity changes about 7 times when we use multifunctional GO. Therefore, these results clearly indicate that using a dually functionalization technique with RNA aptamer along with antibody on the graphene oxide, yielded Raman intensity close to 7 times. This provides enough room to rely on the fact of internalization of GO to detect SKBR3 cancer cell using visible light Raman spectroscopy.
Figure 6.
(a) Critical monitoring of GO internalization with respect to incubation time based on ‘D’ and ‘G’ band Raman intensity of graphene oxide under 532 nm laser excitation. (b) Transmission electron microscope image of bio-conjugated graphene oxide and SKBR3 solution mixture just after 2 minutes of incubation. (c) Transmission electron microscope image of bio-conjugated graphene oxide and SKBR3 solution mixture after 5 hours of incubation. (d) Transmission electron microscope image of bio-conjugated graphene oxide and SKBR3 solution mixture after 24 hours of incubation indicates accumulation of bio-conjugated graphene oxide on the cell membrane surface.
Further the experimental result also demonstrates that addition of other cells like HaCaT and the LNCaP breast cancer cell Raman intensity from GO remains almost unchanged. This is due to non-internalization and nonspecific binding at the LNCaP and HaCaT cell surface. Further, to confirm this inference, we added excessive amount of conjugated GO in to the LNCaP and HaCaT samples separately in five batch of samples. We did not observe any change in D and G band of GO, on the other hand microscopic image revels no sign of internalization into the cell. Therefore, this enhancement in Raman intensity is indication of small cluster formation of GO in the solution which is well known for better hotspot formation after reaching certain concentration of GO in the suspension.
Conclusion
In summary, we have developed Raman active bio-GO nanoparticle for the direct and label free identification of breast cancer circulating tumor cell in vitro with excellent specificity and high sensitivity. Graphene oxide is conjugated with S6 RNA aptamer and anti-HER2/c-erb-2 to construct a biofunctional composite to target SKBR3 breast cancer cell in solution. TEM and DLS results indicate that the well dispersed 2D nano GO which is of a great benefit to reducing blinking effect and enhancing photostability during Raman spectra measurement. After surface conjugation of GO, we observed a direct evidence of internalization of graphene oxide nanoparticle through breast cancer cell that causes disappearance of bond stretching peak of sp2 atoms at 1580 cm−1 (G band) and breathing modes (D band) of sp2 atoms in rings near 1360 cm−1. We hypothesize that, since poor penetration of the visible light through the tissue is well documented, a longer incubation time of bio-GO with breast cancer cell causes penetration of GO as a result, does not show any Raman signal after 532 nm excitation whereas, it does show clear Raman signal when the sample was exposed with NIR 670 nm radiation. Extraction of GO after cell digestion also support the internalization rubric of 2D graphene through the cell membrane. Our experimental data with the HaCaT healthy cell line, as well as with LNCaP prostate cancer cell line clearly demonstrated that this Raman scattering assay is highly sensitive to SKBR3 and it can distinguish it from other kinds of cancer cell present in the mixture. Our experiment indicates that this bioassay is quite efficient and it can be 2 orders of magnitude more sensitive than the usual colorimetric methods. The concentration dependent study of GO with breast cancer cell (SKBR3) shows that using this technique we can detect up to ~60 cell/mL SKBR3 cell in vitro with excellent specificity and high sensitivity.
Acknowledgments
AKS thanks to Mississippi INBRE, funded by an Institutional Development Award (IDeA) from the National Institute of General Medical Sciences of the National Institutes of Health under grant number P20GM103476. AKS also thanks the Department of Chemistry and Biochemistry, Jackson State University, for providing access to Analytical core equipment facility funded by NIH under NIH NCRR Grant No. G12RR013459 and NIH/NIMHD Grant No. G12MD007581.
References
- 1.Cancer Facts & Figures. 2015 http://www.cancer.org/research/cancerfactsstatistics/cancerfactsfigures2015/index)
- 2.Advancing the Global Fight Against Cancer. http://www.cancer.org/aboutus/globalhealth/index)
- 3.International Agency for Research on Cancer. http://www.iarc.fr/en/media-centre/pr/2013/pdfs/pr223_E.pdf)
- 4.http://www.who.int/cancer/en/, Key Facts about Cancer, http://www.who.int/cancer/en/).
- 5.Alix-Panabières C, Pantel K. Nat Rev Cancer. 2014;14:623–631. doi: 10.1038/nrc3820. [DOI] [PubMed] [Google Scholar]
- 6.Cristofanilli M, Budd GT, Ellis MJ, Stopeck A, Matera J, Miller MC, Reuben JM, Doyle GV, Allard WJ, Terstappen LW, Hayes DF. N Engl J Med. 2004;351:781–791. doi: 10.1056/NEJMoa040766. [DOI] [PubMed] [Google Scholar]
- 7.Hayes DF, Cristofanilli M, Budd GT, Ellis MJ, Stopeck A, Miller MC, Matera J, Allard WJ, Doyle GV, Terstappen LW. Clin Cancer Res. 2006;12:4218–4224. doi: 10.1158/1078-0432.CCR-05-2821. [DOI] [PubMed] [Google Scholar]
- 8.Key statistics about breast cancer. http://www.cancer.org/cancer/breastcancer/detailedguide/breast-cancer-key-statistics)
- 9.Zhou M, Zhai Y, Dong S. Analytical Chemistry. 2009;81:5603–5613. doi: 10.1021/ac900136z. [DOI] [PubMed] [Google Scholar]
- 10.Jung JH, Cheon DS, Liu F, Lee KB, Seo TS. Angewandte Chemie International Edition. 2010;49:5708–5711. doi: 10.1002/anie.201001428. [DOI] [PubMed] [Google Scholar]
- 11.Sun X, Liu Z, Welsher K, Robinson JT, Goodwin A, Zaric S, Dai H. Nano Res. 2008;1:203–212. doi: 10.1007/s12274-008-8021-8. [DOI] [PMC free article] [PubMed] [Google Scholar]
- 12.Pumera M. Materials Today. 2011;14:308–315. [Google Scholar]
- 13.Maji SK, Mandal AK, Kim Truc N, Borah P, Zhao Y. Acs Applied Materials & Interfaces. 2015;7:9807–9816. doi: 10.1021/acsami.5b01758. [DOI] [PubMed] [Google Scholar]
- 14.Kenry P, Chaudhuri K, Loh KP, Lim CT. Acs Nano. 2016;10:3424–3434. doi: 10.1021/acsnano.5b07409. [DOI] [PubMed] [Google Scholar]
- 15.Nurunnabi M, Khatun Z, Reeck GR, Lee DY, Lee Y-k. Acs Applied Materials & Interfaces. 2014;6:12413–12421. doi: 10.1021/am504071z. [DOI] [PubMed] [Google Scholar]
- 16.Xing F, Meng GX, Zhang Q, Pan LT, Wang P, Liu ZB, Jiang WS, Chen Y, Tian JG. Nano Letters. 2014;14:3563–3569. doi: 10.1021/nl5012036. [DOI] [PubMed] [Google Scholar]
- 17.Hu SH, Chen YW, Hung WT, Chen IW, Chen SY. Advanced Materials. 2012;24:1748–1754. doi: 10.1002/adma.201104070. [DOI] [PubMed] [Google Scholar]
- 18.Chen ML, He YJ, Chen XW, Wang JH. Bioconjugate Chemistry. 2013;24:387–397. doi: 10.1021/bc3004809. [DOI] [PubMed] [Google Scholar]
- 19.Yang L, Tseng YT, Suo G, Chen L, Yu J, Chiu WJ, Huang CC, Lin CH. ACS Applied Materials & Interfaces. 2015;7:5097–5106. doi: 10.1021/am508117e. [DOI] [PubMed] [Google Scholar]
- 20.Hu C, Liu Y, Qin J, Nie G, Lei B, Xiao Y, Zheng M, Rong J. ACS Appl Mater Interfaces. 2013;5:4760–4768. doi: 10.1021/am4000485. [DOI] [PubMed] [Google Scholar]
- 21.Zhu Y, Murali S, Cai W, Li X, Suk JW, Potts JR, Ruoff RS. Adv Mater. 2010;22:3906–3924. doi: 10.1002/adma.201001068. [DOI] [PubMed] [Google Scholar]
- 22.Gomez-Navarro C, Weitz RT, Bittner AM, Scolari M, Mews A, Burghard M, Kern K. Nano Letters. 2007;7:3499–3503. doi: 10.1021/nl072090c. [DOI] [PubMed] [Google Scholar]
- 23.Suk JW, Piner RD, An J, Ruoff RS. Acs Nano. 2010;4:6557–6564. doi: 10.1021/nn101781v. [DOI] [PubMed] [Google Scholar]
- 24.Ferrari AC, Meyer JC, Scardaci V, Casiraghi C, Lazzeri M, Mauri F, Piscanec S, Jiang D, Novoselov KS, Roth S, Geim AK. Physical Review Letters. 2006:97. doi: 10.1103/PhysRevLett.97.187401. [DOI] [PubMed] [Google Scholar]
- 25.Yang D, Velamakanni A, Bozoklu G, Park S, Stoller M, Piner RD, Stankovich S, Jung I, Field DA, Ventrice CA, Jr, Ruoff RS. Carbon. 2009;47:145–152. [Google Scholar]
- 26.Saito Y, Verma P, Masui K, Inouye Y, Kawata S. Journal of Raman Spectroscopy. 2009;40:1434–1440. [Google Scholar]
- 27.Ferrari AC. Solid State Communications. 2007;143:47–57. [Google Scholar]
- 28.Fiorillo M, Verre AF, Iliut M, Peiris-Pagés M, Ozsvari B, Gandara R, Cappello AR, Sotgia F, Vijayaraghavan A, Lisanti MP. Graphene oxide selectively targets cancer stem cells, across multiple tumor types: Implications for non-toxic cancer treatment, via “differentiation-based nano-therapy”. 2015 doi: 10.18632/oncotarget.3348. [DOI] [PMC free article] [PubMed] [Google Scholar]
- 29.Li JL, Hou XL, Bao HC, Sun L, Tang B, Wang JF, Wang XG, Gu M. Journal of Biomedical Materials Research Part A. 2014;102:2181–2188. doi: 10.1002/jbm.a.34871. [DOI] [PubMed] [Google Scholar]
- 30.Shi X, Gong H, Li Y, Wang C, Cheng L, Liu Z. Biomaterials. 2013;34:4786–4793. doi: 10.1016/j.biomaterials.2013.03.023. [DOI] [PubMed] [Google Scholar]
- 31.Liu Z, Guo Z, Zhong H, Qin X, Wan M, Yang BY. Physical Chemistry Chemical Physics. :2961. doi: 10.1039/c2cp43715e. [DOI] [PubMed] [Google Scholar]
- 32.Lu Y, Wu P, Yin Y, Zhang H, Cai C. Journal of Materials Chemistry B. 2014;2:3849–3859. doi: 10.1039/c4tb00521j. [DOI] [PubMed] [Google Scholar]
- 33.Yoon HJ, Kim TH, Zhang Z, Azizi E, Pham TM, Paoletti C, Lin J, Ramnath N, Wicha MS, Hayes DF, Simeone DM, Nagrath S. Nat Nanotechnol. 2013;8:735–741. doi: 10.1038/nnano.2013.194. [DOI] [PMC free article] [PubMed] [Google Scholar]
- 34.Yim D, Kang H, Jeon SJ, Kim HI, Yang JK, Kang TW, Lee S, Choo J, Lee YS, Kim JW, Kim JH. Analyst. 2015;140:3362–3367. doi: 10.1039/c4an02382j. [DOI] [PubMed] [Google Scholar]
- 35.Bruchez M, Moronne M, Gin P, Weiss S, Alivisatos AP. Science. 1998;281:2013–2016. doi: 10.1126/science.281.5385.2013. [DOI] [PubMed] [Google Scholar]
- 36.Wang X, Wang C, Cheng L, Lee ST, Liu Z. Journal of the American Chemical Society. 2012;134:7414–7422. doi: 10.1021/ja300140c. [DOI] [PubMed] [Google Scholar]
- 37.Liu Z, Guo Z, Zhong H, Qin X, Wan M, Yang B. Physical Chemistry Chemical Physics. 2013;15:2961–2966. doi: 10.1039/c2cp43715e. [DOI] [PubMed] [Google Scholar]
- 38.Rakha EA, Putti TC, El-Rehim DMA, Paish C, Green AR, Powe DG, Lee AH, Robertson JF, Ellis IO. Journal of Pathology. 2006;208:495–506. doi: 10.1002/path.1916. [DOI] [PubMed] [Google Scholar]
- 39.Stratigos AJ, Kapranos N, Petrakou E, Anastasiadou A, Pagouni A, Christofidou E, Petridis A, Papadopoulos O, Kokka E, Antoniou C, Georgala S, Katsambast AD. Journal of the European Academy of Dermatology and Venereology. 2005;19:180–186. doi: 10.1111/j.1468-3083.2005.01094.x. [DOI] [PubMed] [Google Scholar]
- 40.Estrela-Lima A, Araujo MSS, Costa-Neto JM, Teixeira-Carvalho A, Barrouin-Melo SM, Cardoso SV, Martins-Filho OA, Serakides R, Cassali GD. Bmc Cancer. 2010:10. doi: 10.1186/1471-2407-10-256. [DOI] [PMC free article] [PubMed] [Google Scholar]
- 41.Hummers WS, Offeman RE. Journal of the American Chemical Society. 1958;80:1339–1339. [Google Scholar]
- 42.Marcano DC, Kosynkin DV, Berlin JM, Sinitskii A, Sun Z, Slesarev A, Alemany LB, Lu W, Tour JM. Acs Nano. 2010;4:4806–4814. doi: 10.1021/nn1006368. [DOI] [PubMed] [Google Scholar]
- 43.Fu X, Bei F, Wang X, O’Brien S, Lombardi JR. Nanoscale. 2010;2:1461–1466. doi: 10.1039/c0nr00135j. [DOI] [PubMed] [Google Scholar]
- 44.Koppens FHL, Mueller T, Avouris P, Ferrari AC, Vitiello MS, Polini M. Nature Nanotechnology. 2014;9:780–793. doi: 10.1038/nnano.2014.215. [DOI] [PubMed] [Google Scholar]
- 45.Xu M, Liang T, Shi M, Chen H. Chemical Reviews. 2013;113:3766–3798. doi: 10.1021/cr300263a. [DOI] [PubMed] [Google Scholar]
- 46.Sun Z, Chang H. Acs Nano. 2014;8:4133–4156. doi: 10.1021/nn500508c. [DOI] [PubMed] [Google Scholar]
- 47.Kudin KN, Ozbas B, Schniepp HC, Prud’homme RK, Aksay IA, Car R. Nano Letters. 2008;8:36–41. doi: 10.1021/nl071822y. [DOI] [PubMed] [Google Scholar]
- 48.King AAK, Davies BR, Noorbehesht N, Newman P, Church TL, Harris AT, Razal JM, Minett AI. Scientific Reports. 2016:6. doi: 10.1038/srep19491. [DOI] [PMC free article] [PubMed] [Google Scholar]
- 49.Akhavan O, Ghaderi E, Emamy H. Journal of Materials Chemistry. 2012;22:20626–20633. [Google Scholar]
- 50.Chavva SR, Pramanik A, Nellore BPV, Sinha SS, Yust B, Kanchanapally R, Fan Z, Crouch RA, Singh AK, Neyland B, Robinson K, Dai X, Sardar D, Lu Y, Ray PC. Particle & Particle Systems Characterization. 2014;31:1252–1259. [Google Scholar]
- 51.Ji DK, Zhang Y, Zang Y, Liu W, Zhang X, Li J, Chen GR, James TD, He XP. Journal of Materials Chemistry B. 2015;3:9182–9185. doi: 10.1039/c5tb02057c. [DOI] [PubMed] [Google Scholar]
- 52.Shibu ES, Ono K, Sugino S, Nishioka A, Yasuda A, Shigeri Y, Wakida S-i, Sawada M, Biju V. Acs Nano. 2013;7:9851–9859. doi: 10.1021/nn4043699. [DOI] [PubMed] [Google Scholar]
- 53.Li Y, Li X, Li Z, Gao H. Nanoscale. 2012;4:3768–3775. doi: 10.1039/c2nr30379e. [DOI] [PubMed] [Google Scholar]
- 54.Wu C, Wang C, Zheng J, Luo C, Li Y, Guo S, Zhang J. Acs Nano. 2015;9:7913–7924. doi: 10.1021/acsnano.5b01685. [DOI] [PubMed] [Google Scholar]
- 55.Li Y, Yuan H, von dem Bussche A, Creighton M, Hurt RH, Kane AB, Gao H. Proceedings of the National Academy of Sciences of the United States of America. 2013;110:12295–12300. doi: 10.1073/pnas.1222276110. [DOI] [PMC free article] [PubMed] [Google Scholar]
- 56.Lammel T, Boisseaux P, Fernandez-Cruz M-L, Navas JM. Particle and Fibre Toxicology. 2013:10. doi: 10.1186/1743-8977-10-27. [DOI] [PMC free article] [PubMed] [Google Scholar]
- 57.Corr SJ, Raoof M, Cisneros BT, Kuznetsov O, Massey K, Kaluarachchi WD, Cheney MA, Billups EW, Wilson LJ, Curley SA. Nanoscale Research Letters. 2013:8. doi: 10.1186/1556-276X-8-208. [DOI] [PMC free article] [PubMed] [Google Scholar]
- 58.Mao J, Guo R, Yan LT. Biomaterials. 2014;35:6069–6077. doi: 10.1016/j.biomaterials.2014.03.087. [DOI] [PubMed] [Google Scholar]


