

Abstract
Single-cell mass spectrometry (MS) empowers the characterization of metabolomic changes as cells differentiate to different tissues during early embryogenesis. Using whole-cell dissection and capillary electrophoresis electrospray ionization (CE-ESI) MS, we recently uncovered metabolic cell-to-cell differences in the 8- and 16-cell embryo of the South African clawed frog (Xenopus laevis), raising the question whether metabolic cell heterogeneity is also detectable across the dorsal–ventral axis of the 8-cell embryo. Here, we tested this hypothesis directly in the live embryo by quantifying single-cell metabolism between the left dorsal-animal (D1L) and left ventral-animal (V1L) cell pairs in the same embryo using microprobe single-cell CE-ESI-MS in the positive ion mode. After quantifying ~70 molecular features, including 52 identified metabolites, that were reproducibly detected in both cells among n = 5 different embryos, we employed supervised multivariate data analysis based on partial least squares discriminant analysis (PLSDA) to compare metabolism between the cell types. Statistical analysis revealed that asparagine, glycine betaine, and a yet-unidentified molecule were statistically significantly enriched in the D1L cell compared to V1L (p < 0.05 and fold change ≥ 1.5). These results demonstrate that cells derived from the same hemisphere (animal pole) harbor different metabolic activity along the dorsal–ventral axis as early as the 8-cell stage. Apart from providing new evidence of metabolic cell heterogeneity during early embryogenesis, this study demonstrates that microprobe single-cell CE-ESI-MS enables the analysis of multiple single cells in the same live vertebrate embryo.
Keywords: Single-cell analysis, mass spectrometry, metabolomics, cell differentiation, embryo, Xenopus
Introduction
Understanding the molecular mechanisms that drive early cell fate decisions, such as formation of the body axes, has been a central goal in developmental biology. In particular, it is important to understand how asymmetries in biochemicals and biomolecules within different cellular domains of the embryo are translated into different cell types. Studies at the gene and transcript level using various animal models have provided deep insights to the molecular regulation of body patterning, but the specific molecules and the timing of their expression during embryogenesis are yet to be fully understood. For example, in the South African clawed frog (Xenopus laevis), a key model organism for cell and developmental biology studies, early cell divisions demarcate the three primary axes of the embryo (right–left; dorsal–ventral; anterior–posterior).1 The first cell division separates the 1-cell zygote into left and right sides. The second cell division of the 4-cell embryo separates the dorsal and ventral halves, and the third, equatorial division of the 8-cell embryo separates the animal from the vegetal hemisphere, presaging the future anterior-posterior axis. Knowledge of all the molecules, ranging from transcripts and proteins to small molecules (metabolites), with their contribution to these cell fate decisions is key to understanding the processes underlying the formation of the body axes.
Recent technologies in single-cell analysis provide powerful approaches for answering these questions. Single-cell sequencing uncovered a number of transcriptomic asymmetries across the animal–vegetal axis in the 8-, 16-, and 32-cell X. laevis embryo.2, 3 These results suggest that cell heterogeneity may be established in the cleaving embryo by translation of these differentially located mRNAs, but to date we do not know if the transcriptomic differences result in different levels of functionally important proteins and metabolites, the molecules that drive cell fate decisions. Furthermore, a growing body of evidence highlights metabolism as a key factor during the formation of cell fates, organogenesis, and normal development.4–13 The complex dynamics between the transcriptome and proteome14 and highly dynamic metabolome15 necessitate direct and fast analysis of these smaller molecules, preferably in the live embryo. However, characterization of the single-cell metabolome requires specialized bioanalytical technologies that are capable of high sensitivity, molecular specificity, quantification, and particularly, scalability to single cells.
Single-cell mass spectrometry (MS) technologies provide powerful insights into cell metabolism. These analytical tools enable the unbiased and label-free identification of diverse types of metabolites in single cells (reviewed in references16–20). For example, matrix-assisted laser desorption ionization (MALDI)21, secondary ion MS (SIMS)22, and nanostructure initiator MS (NIMS)23 were used to detect small molecules in single plant or animal cells in a vacuum, whereas live single cells were measured under ambient conditions using direct analysis approaches, such as live single-cell video MS24, 25, single-probe MS26, laser ablation electrospray ionization (LAESI) MS27, and variants of microsampling with direct electrospray ionization (ESI)28–30. To aid molecular identifications, a subset of single-cell analysis approaches added a separation step prior to metabolite detection. For example, ion mobility MS facilitated the removal of isobaric interferences for single-cell analysis.31 To improve detection sensitivity and quantification, we5, 6, 32 and others33–35 designed microanalytical capillary electrophoresis (CE) instruments that enabled the separation of metabolites prior to ionization by ESI, thus enhancing ionization efficiency and chemical identification by removing spectral interferences before detection. Microanalytical CE-ESI-MS allowed us to detect hundreds of metabolites in single cells that were dissected from the 8- and 16-cell X. laevis embryos, quantify previously unknown metabolomic differences between cells across the animal–vegetal, dorsal–ventral, and left–right axes of the embryo, and discover metabolites that can alter normal tissue fates.5, 32 Most recently, we developed “microprobe single-cell CE-ESI-MS” to enable, for the first time, the analysis of metabolites in single cells directly in the live embryo.36 Microprobe CE-ESI-MS opened the door to discovery and targeted experiments to help better understand the metabolic underpinnings responsible for early patterning of the embryo.
Here, we built upon microprobe single-cell CE-ESI-MS to compare metabolism between cells that reproducibly form dorsal versus ventral structures during early development. Specifically, we performed discovery metabolomics on the left dorsal (called D1L) and left ventral (called V1L) cells in 8-cell X. laevis embryos. This technology allowed us to perform these measurements on both cell types directly in the same live embryo, thus enhancing statistical power by eliminating known metabolic variability between different embryos.5, 15, 36 Multivariate and statistical analysis of the resulting quantitative data revealed metabolites that were significantly differentially enriched between the dorsal and ventral cells. Besides validating microprobe CE-ESI-MS for multi-cell analysis within the same live embryo, these results provide new data on the formation of metabolic cell heterogeneity during early embryogenesis.
Experimental
Chemicals
All compounds, including LC-MS grade acetonitrile, methanol, and water were purchased from Fisher Scientific (Fair Lawn, NJ) unless otherwise noted. Calcium nitrite, cysteine, Trizma hydrochloride, and Trizma base were from Sigma Aldrich (Saint Louis, MO).
Solutions
Steinberg’s solution (100%, v/v) and dejellying cysteine solution (2%, v/v) were prepared using standard protocols.5 The “metabolite extraction solution” consisted of 40% (v/v) acetonitrile and 40% (v/v) methanol. The CE “background electrolyte” contained 1% (v/v) formic acid. The electrospray “sheath solution” contained 50% (v/v) methanol and 0.1% (v/v) formic acid. All solutions were prepared using LC-MS-grade water.
Animal Care and Embryo Collection
All protocols regarding the care and handling of animals were approved by the George Washington University Institutional Animal Care and Use Committee (IACUC no. A311). Adult male and female frogs (Xenopus laevis) were from Nasco (Fort Atkinson, WI) and maintained in a breeding colony. Embryos were obtained by gonadotropin-induced natural mating of male and female frogs. The jelly coats surrounding the embryos were removed using the dejellying cystine solution following standard protocols.37 Dejellied embryos were raised in a Petri dish containing 100% Steinberg’s solution and monitored using a stereomicroscope until they reached the 4-cell stage. Embryos in which stereotypical pigmentation clearly marked the dorsal–ventral and left–right axes with respect to established cell-fate maps1, 38–41 were selected for analysis in this study.
Microprobe CE-ESI-MS
This study used the same microprobe CE-ESI-MS system that we recently developed and validated elsewhere.36 Micropipettes were prepared by pulling borosilicate capillaries (0.75/1 mm inner/outer diameter) to ~20 µm diameter using a capillary puller (Model P-1000, Sutter Instruments, Novato, CA). Each micropipette was mounted separately on a three-axis micromanipulator (model TransferMan 4r, Warner Instruments, Hamden, CT) to position its tip into identified cells in the embryo. A portion of the cell content was withdrawn by applying negative pressure to the micropipette using a microinjector (model PLI-100A, Warner Instrument, Hamden, CT). The tip of the micropipette was withdrawn from the cell and the aspirate was expelled into a microvial containing 4 µL of chilled metabolite extraction solution (4 °C), which we previously found to efficiently extract small, polar metabolites.32 The vials were vortex-mixed for ~1 min at room temperature, centrifuged at 8,000 × g for 5 min at 4 °C to pellet cell debris before storage at −80 °C until analysis. A 10 nL portion of the cell extract was analyzed using our custom-built CE-ESI-MS system following protocols reported elsewhere.5, 32 Molecules were electrophoretically separated by applying 22.5 kV across a 100 cm bare fused silica capillary (40/105 µm inner/outer diameter, Polymicro Technologies, Phoenix, AZ) filled with the background electrolyte. Compounds were ionized in the positive ion mode using a grounded sheath-flow CE-ESI interface that we recently described in detail5. This interface used 50% methanol containing 0.1% (v/v) formic acid at 1 µL/min as the sheath solution and −1,700 kV as spray voltage (applied to the mass spectrometer’s orifice plate). Generated ions were detected in a quadrupole orthogonal-acceleration time-of-flight mass spectrometer (Impact HD, Bruker Daltonics, Billerica, MA) with a survey scan rate of 2 Hz. The mass spectrometer was tuned and mass-calibrated to <1 ppm accuracy following vendor instructions. Tandem MS experiments used 12–18 eV energy for collision-induced dissociation with nitrogen as the collision gas. CE-ESI-MS performance was validated daily using 300 amol acetylcholine as described earlier.5 The quantitative reproducibility of microprobe single-cell CE-ESI-MS was ~8.2% relative standard deviation (RSD) based on technical replicate analysis of the same extract, which was sufficient to assess quantitative biological variability (~42.5% RSD) between cell types from different embryos.36 All metabolite measurements were conducted over a 2-day period under identical experimental settings. Each metabolite extract was measured in technical duplicates.
Data Analysis
MS–MS/MS data were processed as detailed elsewhere.32 Primary data were calibrated to < 1 ppm accuracy (high performance calibration mode) using sodium formate ions. Molecular features were semimanually searched between m/z 50–500 with 5 mDa increments using a custom-written script35 in Compass Data Analysis (Bruker). The accurate m/z value and migration time of each molecular feature and the corresponding under-the-curve peak area were noted. The resulting metadata were analyzed in MetaboAnalyst version 3.042 using sum-normalization and autoscaling prior to principal component analysis (PCA), partial least squares discriminant analysis (PLSDA), and/or statistical analysis (paired Student’s t-test, p < 0.05 for significance).
Results and Discussion
The overall goal of this study was to assess metabolic cell heterogeneity in the early vertebrate embryo using in situ single-cell MS. Understanding cell heterogeneity is important, because molecular determinants underlying the establishment of developmental axes of the vertebrate embryo are not fully understood, particularly at the level of metabolites.2 By dissecting identified single cells from X. laevis embryos and characterizing their small molecules using CE-ESI-MS, we recently uncovered surprising metabolic differences between cells that are located along the animal–vegetal and dorsal–ventral axes in the 16-cell X. laevis embryo and discovered small molecules that are able to alter normal dorsal–ventral tissue specification.5 Additionally, this single-cell analysis strategy allowed us to quantify metabolic differences between the left and right dorsal cells in the 8-cell embryo.32 Based on these results, we proposed that dorsal–ventral cell heterogeneity is also detectable at this early stage of embryonic development. Knowledge of such metabolic differences as cells differentiate into dorsal vs. ventral structures would raise the potential for functional experiments to determine the developmental significance of specific metabolic pathways.
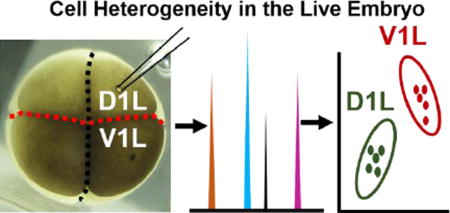
To test our hypothesis, we designed a single-cell analysis study using the 8-cell embryo of X. laevis (Fig. 1). As a model, we selected the left dorsal (called D1L) and left ventral (called V1L) cells, which are readily identifiable based on pigmentation, location in the embryo, and established cell-fate maps for X. laevis.1, 38, 40, 41 We employed microprobe single-cell CE-ESI-MS36 to assess the metabolic composition of these cells in the live embryo. Compared to whole-cell dissection, this technology offered several advantages, including higher sensitivity by minimizing ionization interferences due to salts from the embryo culture media, tracking of fast metabolism via ~50–100-times faster analysis, and in situ analysis of differentiating cells enabled by minimally invasive microprobe sampling.36 Importantly, microprobe single-cell CE-ESI-MS raised the possibility for measuring multiple cells in the same embryo,36 thus eliminating embryo-to-embryo metabolic variability5, 15, which in turn enhances statistical power and results interpretation.
Figure 1.

Microprobe single-cell capillary electrophoresis (CE) mass spectrometry (MS) enabling metabolic comparison of the left dorsal-animal (D1L) and left ventral-animal (V1L) cell in the same 8-cell Xenopus laevis embryo. Scale = 250 µm.
We initially demonstrated that microprobe single-cell CE-ESI-MS enabled, for the first time, the metabolic analysis of multiple cells in the same live X. laevis embryo (see Fig. 1). Using microfabricated capillaries (see Methods), we aspirated ~10 nL, or ~5% (v/v) of the D1L and also the V1L cell from the same embryo. The collected cell content was expelled into 4 µL of chilled extraction solvent, in which small polar compounds were efficiently extracted.5, 32, 36 A 10 nL portion of each extract, corresponding to ~0.01% of the single-cell metabolome, was measured using CE-ESI-MS and our established protocols36. Each cell extract yielded ~200 nonredundant molecular features after excluding isotopic peaks and non-covalent clusters. In this and our previous5, 32, 36 studies, we identified ~70 of these features as small metabolites by comparing the accurate mass, fragmentation fingerprint (high-resolution MS/MS by collision-induced dissociation), and separation time of features detected in cell extracts against those measured using authentic chemical standards or available in metabolomic MS/MS–MS databases (Metlin43 and Human Metabolome Database44). As an example, Figure 2 demonstrates the identification of asparagine based on these orthogonal pieces of information. We used chemical standards and non-linear time warping35 to align the migration time of molecular features that were detected in this work to those that we recently disseminated through a CE-ESI-MS metabolite database for X. laevis.36 The resulting accurate mass vs. aligned migration time data can be used to facilitate the identification of yet unknown molecular features (UNK) in future studies.
Figure 2.

Identification of metabolites based on accurate mass, fragmentation fingerprint, and migration time information. This example shows the identification of a molecular feature that was detected in the D1L cell as asparagine.
These metadata allowed us to directly compare metabolism between the D1L and V1L cells. Figure 3 exemplifies the separation of select metabolites that were identified in randomly chosen D1L and V1L cells from two different embryos. The ion traces were normalized to the total signal abundance of molecular features that were commonly detected between the cells, enabling semiquantitative comparison of cell metabolism. Comparable normalized ion abundances suggest that most detected features were present at similar concentrations in the cells. Such compounds included small acids (e.g., aspartate and glutamate), amino acids (e.g., lysine, arginine, and histidine), and other metabolites involved in energy and synthesis (e.g., carnitine and guanine). In comparison, putrescine and spermidine gave higher ion signal abundance in the D1L cell, whereas creatine and hydroxyproline were more abundant in the V1L cell. These differential chemical profiles indicated slight, but appreciable metabolic activity differences between the dorsal and ventral cells.
Figure 3.

Metabolite detection in single cells by microprobe single-cell CE-ESI-MS. The electropherograms exemplify the separation of select metabolites in a single D1L and V1L cell. The ion traces were normalized to the total ion signal in each experiment. Migration times were aligned to a custom-built metabolite database using chemical standards.36 Key: SAM, S-adenosylmethionine; AcCho, acetylcholine; AcCar, acetylcarnitine; CR, creatine; HPX, hypoxanthine; GB, glycine betaine; HYP, hydroxyproline; GSH, glutathione.
These profiling results warranted a systematic comparison of dorsal vs. ventral cell metabolites by using a larger cohort of embryos. We used microprobe single-cell CE-ESI-MS36 to analyze D1L and V1L cell-pairs in each of n = 5 different 8-cell X. laevis embryos (a total of 10 samples) derived from two pairs of parents. Each cell extract was measured in technical duplicates (same cell measured twice by CE-ESI-MS) to enhance quantitative repeatability and statistical power during data analysis. The resulting 20 high-resolution MS data sets allowed us to relatively quantify metabolites between the cells. We focused data analysis to the ~52 metabolites that we had identified in the X. laevis embryos in a recent study36 and an additional 18 randomly selected molecular features that were consistently detected and quantified in at least 50% of all the cells measured in this study. Under-the-curve peak areas were integrated for these metabolites based on selected ion electropherograms (± 5 mDa tolerance), which serve as a quantitative proxy for endogenous concentrations in CE-ESI-MS34.
Next, we tested metabolic cell differences by developing multivariate data analysis models (Fig. 4). Unsupervised PCA was selected as a first-step discovery tool. The first three most significant principal components (PC) accounted for 23.6%, 20.9%, and 12.2% variance in the data. With ~45% of variance explained, PC1 and PC2 were sufficient for this study. Data points corresponding to the individual cell types formed overlapping data clusters in the PCA scores plot (Fig. 4A). In the PCA loadings plot, molecular features were scattered around the origin (data not shown). These results indicated that the D1L and V1L cells exhibited similar metabolic activity states based on the 70 selected molecular features. To appreciate potential finer differences between the cells, we also performed a targeted analysis. A supervised model based on partial least squares discriminant analysis (PLSDA) sufficiently discriminated the two cell types. As shown in Figure 4B, the D1L and V1L cell types were separated in the first two most significant dimensions (see left panel). This allowed us to use variable importance on projection (VIP) to find molecular features that were most differentially produced between the cell types. The top 20 most significant features are shown in Figure 4B (right panel), and were primarily enriched in D1L.
Figure 4.

Multivariate data analysis of metabolites in dorsal-animal (D1L) vs. ventral-animal (V1L) cells. (A) Unsupervised principal component analysis score plot revealed similar global metabolic composition. (B) A supervised model based on partial least squares discriminant analysis (PLSDA) successfully discriminated D1L from V1L cells (left panel). The scatter plot shows the top 20 most significant metabolic features that discriminated the cell types (right panel). Molecular features pending identification are labeled as UNK01 (m/z 90.0550 at 16.31 min), UNK02 (m/z 106.0859 at 17.28 min), and UNK03 (m/z 101.0083 at 11.30 min). Key to score plots: Numbers represent the order in which the cells were microprobed in this study; Technical duplicate measurements are connected. Ellipses mark 95% confidence intervals.
These results complement known metabolic cell heterogeneity in the X. laevis embryo. Based on whole-cell dissection and CE-ESI-MS5, 32, we previously quantified proline, cis- and trans-urocanate, serine, and phenylalanine enriched in the midline dorsal-animal (D11) cell compared to the midline ventral-animal cell (V11) of the 16-cell embryo. Metabolic profiles revealed a similar trend for these compounds in the 8-cell embryo in this study: these metabolites were detected in higher abundance in the D1L cell compared to the V1L, which is the precursor of the D11 cell.38, 40, 41 Likewise, serine and threonine of the glycine, serine, threonine metabolic pathway were accumulated in the D11 cell. The V1L-enriched putrescine was previously found at higher concentration in the V11 cell, which is a daughter cell of V1L.38, 40, 41 These results also suggest hypotheses for future studies. For example, isoleucine and leucine were previously found enriched in the left but not the right D1 cell32, and here, we found these amino acids to be more abundant in the left D1 cell compared to the left V1 cell, suggesting metabolic gradients across the dorsal-ventral and left-right axes of the 8-cell embryo. Conversely, triethanolamine was found to be more abundant in V1L vs. D1L in this study, and we earlier detected this compound more abundantly in D1L vs. D1R, which suggests that this metabolite is enriched on the left compared to the right side of the embryo. These hypotheses are testable via follow-up targeted metabolic experiments.
Finally, we calculated the statistical significance of the observed metabolic cell differences. We performed pairwise Student’s t-test analysis on the normalized data. Of the 70 selected features, including 52 identified metabolites, that we focused on in this experiment, we found three features to be statistically enriched in D1L compared to V1L cells in all five embryos (p < 0.05). Statistical results are listed in Table 1. The relative abundance of these compounds is compared in Figure 5. These metabolites included glycine betaine, asparagine, and a yet-unidentified molecular feature (UNK01) with m/z 90.0550 (± 1 ppm) at 16.3 min separation (after alignment to data reported in reference36). Metlin43 metabolomics database provides 7 putative candidates for this accurate mass with 10 ppm mass tolerance (last time of search: March 27, 2017), which were the following: alanine, β-alanine, lactamide, N-hydroxymethyl-N-methylformamide, nitropropane, sarcosine, and urethane. By comparing the migration time to the related standards, we excluded sarcosine and alanine for this feature. Besides demonstrating the utility of microprobe CE-ESI-MS to study metabolism in single cells in the live vertebrate embryo, these results reveal appreciable metabolic cell heterogeneity along the dorsal–ventral axis of the 8-cell X. laevis embryo.
Table 1.
Metabolites with differential enrichment between D1L vs. V1L cells. Key: p < 0.05 (Student’s t-test) marks statistical significance; FDR, false discovery rate.
| Metabolite | t. stat | p | −10×log10(p) | FDR |
|---|---|---|---|---|
| Asparagine | 3.3891 | 0.0080 | 20.96 | 0.30025 |
| UNK01 | 3.3549 | 0.0085 | 20.73 | 0.30025 |
| Glycine betaine | 2.3318 | 0.0446 | 13.50 | 0.53214 |
Figure 5.

Metabolic markers for V1L and D1L cells detected by microprobe single-cell CE-ESI-MS. Comparison of signal abundance for metabolites that were differentially enriched with statistical significance (p < 0.05, fold change > 1.5). The metabolite labeled as UNK01 measured m/z 90.0550 at 16.31 min.
Conclusions
This work demonstrated, for the first time, that microprobe single-cell CE-ESI-MS enables in situ and repeated sampling of up to two different cells in the same live X. laevis embryo. This approach empowers statistical data analysis and results interpretation by eliminating known embryo-to-embryo metabolic heterogeneity. Furthermore, discovery metabolomics by single-cell MS revealed previously unknown cell heterogeneity across the dorsal–ventral axis in the animal hemisphere of the 8-cell X. laevis embryo. While we have focused results interpretation to 70 consistently detected molecular features, including 52 identified metabolites, this study obtained relative quantitative abundance information for ~200 metabolites to evaluate metabolomic cell heterogeneity in the embryo in future studies. As continuous community efforts provide accurate mass and fragmentation fingerprint data for an increasing diversity of compounds via metabolomics MS–MS/MS databases (e.g., Metlin43, Human Metabolome Database44, MycompoundID45, or the NIST/EPA/NIH Mass Spectral Library), we expect that the metadata from this work will enable the identification of additional metabolites, including the yet unknown UNK01 with differential enrichment between D1L vs. V1L cells. In turn, these data set the stage for targeted metabolomics to identify yet-unknown molecular features detected in the embryo as well as functional experiments to test the developmental significance of these metabolites. The interdisciplinary combination of bioanalytical chemistry and developmental biology affords new potentials to understand key cellular processes, ranging from cell differentiation to embryonic patterning and organogenesis.
Statement on the novelty of this work.
We uncovered previously unknown metabolic differences between dorsal and ventral cells in the 8-cell vertebrate embryo using microprobe single-cell CE-ESI-MS.
Acknowledgments
This research was supported by the National Institutes of Health Grant GM114854 (to P.N.) and R03CA211635 (to P.N.), the Arnold and Mabel Beckman Foundation Beckman Young Investigator Grant (to P.N.), and the Luther Rice Undergraduate Research Fellowship to (D.O.P.). We thank Camille Lombard-Banek for help during sample collection. The opinions and conclusions expressed in this publication are solely those of the authors and do not necessarily represent the official views of the funding sources.
Footnotes
Author Contributions. P.N. and R.M.O. designed the research; S.A.M. provided the embryos and commented on the manuscript; R.M.O. and D.O.P. analyzed cells; R.M.O., D.O.P., and P.N. analyzed the data; P.N. and R.M.O. interpreted the data and wrote the manuscript.
References
- 1.Klein SL. Dev. Biol. 1987;120:299–304. doi: 10.1016/0012-1606(87)90127-8. [DOI] [PubMed] [Google Scholar]
- 2.De Domenico E, Owens ND, Grant IM, Gomes-Faria R, Gilchrist MJ. Dev. Biol. 2015;408:252–268. doi: 10.1016/j.ydbio.2015.06.010. [DOI] [PMC free article] [PubMed] [Google Scholar]
- 3.Flachsova M, Sindelka R, Kubista M. Sci. Rep. 2013;3:2278. doi: 10.1038/srep02278. [DOI] [PMC free article] [PubMed] [Google Scholar]
- 4.Chason RJ, Csokmay J, Segars JH, DeCherney AH, Armant DR. Trends Endocrinol. Metab. 2011;22:412–420. doi: 10.1016/j.tem.2011.05.005. [DOI] [PMC free article] [PubMed] [Google Scholar]
- 5.Onjiko RM, Moody SA, Nemes P. Proc. Natl. Acad. Sci. U. S. A. 2015;112:6545–6550. doi: 10.1073/pnas.1423682112. [DOI] [PMC free article] [PubMed] [Google Scholar]
- 6.Moussaieff A, Rouleau M, Kitsberg D, Cohen M, Levy G, Barasch D, Nemirovski A, Shen-Orr S, Laevsky I, Amit M, Bomze D, Elena-Herrmann B, Scherf T, Nissim-Rafinia M, Kempa S, Itskovitz-Eldor J, Meshorer E, Aberdam D, Nahmias Y. Cell Metab. 2015;21:392–402. doi: 10.1016/j.cmet.2015.02.002. [DOI] [PubMed] [Google Scholar]
- 7.Ichu TA, Han J, Borchers CH, Lesperance M, Helbing CC. Bmc Developmental Biology. 2014;14:5. doi: 10.1186/1471-213X-14-5. [DOI] [PMC free article] [PubMed] [Google Scholar]
- 8.Masse K, Bhamra S, Eason R, Dale N, Jones EA. Nature. 2007;449:1058–1062. doi: 10.1038/nature06189. [DOI] [PubMed] [Google Scholar]
- 9.Rao MB, Didiano D, Patton JG. Stem Cell Reports. 2017;8:831–842. doi: 10.1016/j.stemcr.2017.02.007. [DOI] [PMC free article] [PubMed] [Google Scholar]
- 10.Shyh-Chang N, Daley GQ. Cell Metab. 2015;21:349–350. doi: 10.1016/j.cmet.2015.02.011. [DOI] [PubMed] [Google Scholar]
- 11.Li LN, Li WL. Pharmacol. Ther. 2015;150:33–46. doi: 10.1016/j.pharmthera.2015.01.004. [DOI] [PubMed] [Google Scholar]
- 12.Agathocleous M, Harris WA. Trends Cell Biol. 2013;23:484–492. doi: 10.1016/j.tcb.2013.05.004. [DOI] [PubMed] [Google Scholar]
- 13.Kaelin WG, McKnight SL. Cell. 2013;153:56–69. doi: 10.1016/j.cell.2013.03.004. [DOI] [PMC free article] [PubMed] [Google Scholar]
- 14.Peshkin L, Wuhr M, Pearl E, Haas W, Freeman RM, Gerhart JC, Klein AM, Horb M, Gygi SP, Kirschner MW. Dev. Cell. 2015;35:383–394. doi: 10.1016/j.devcel.2015.10.010. [DOI] [PMC free article] [PubMed] [Google Scholar]
- 15.Vastag L, Jorgensen P, Peshkin L, Wei R, Rabinowitz JD, Kirschner MW. PLoS One. 2011;6:e16881. doi: 10.1371/journal.pone.0016881. [DOI] [PMC free article] [PubMed] [Google Scholar]
- 16.Rubakhin SS, Romanova EV, Nemes P, Sweedler JV. Nat. Methods. 2011;8:S20–S29. doi: 10.1038/nmeth.1549. [DOI] [PMC free article] [PubMed] [Google Scholar]
- 17.Lanni EJ, Rubakhin SS, Sweedler JV. J Proteomics. 2012;75:5036–5051. doi: 10.1016/j.jprot.2012.03.017. [DOI] [PMC free article] [PubMed] [Google Scholar]
- 18.Zenobi R. Science. 2013;342:1243259. doi: 10.1126/science.1243259. [DOI] [PubMed] [Google Scholar]
- 19.Comi TJ, Do TD, Rubakhin SS, Sweedler JV. J Am. Chem. Soc. 2017;139:3920–3929. doi: 10.1021/jacs.6b12822. [DOI] [PMC free article] [PubMed] [Google Scholar]
- 20.Lombard-Banek C, Portero EP, Onjiko RM, Nemes P. genesis. 2017;55:e23012. doi: 10.1002/dvg.23012. [DOI] [PMC free article] [PubMed] [Google Scholar]
- 21.Boggio KJ, Obasuyi E, Sugino K, Nelson SB, Agar NYR, Agar JN. Expert Rev Proteomics. 2011;8:591–604. doi: 10.1586/epr.11.53. [DOI] [PMC free article] [PubMed] [Google Scholar]
- 22.Passarelli MK, Newman CF, Marshall PS, West A, Gilmore IS, Bunch J, Alexander MR, Dollery CT. Anal. Chem. 2015;87:6696–6702. doi: 10.1021/acs.analchem.5b00842. [DOI] [PubMed] [Google Scholar]
- 23.Greving MP, Patti GJ, Siuzdak G. Anal. Chem. 2011;83:2–7. doi: 10.1021/ac101565f. [DOI] [PMC free article] [PubMed] [Google Scholar]
- 24.Mizuno H, Tsuyama N, Harada T, Masujima T. J Mass Spectrom. 2008;43:1692–1700. doi: 10.1002/jms.1460. [DOI] [PubMed] [Google Scholar]
- 25.Nakashima T, Wada H, Morita S, Erra-Balsells R, Hiraoka K, Nonami H. Anal. Chem. 2016;88:3049–3057. doi: 10.1021/acs.analchem.5b03366. [DOI] [PubMed] [Google Scholar]
- 26.Pan N, Rao W, Kothapalli NR, Liu RM, Burgett AWG, Yang ZB. Anal. Chem. 2014;86:9376–9380. doi: 10.1021/ac5029038. [DOI] [PubMed] [Google Scholar]
- 27.Stolee JA, Shrestha B, Mengistu G, Vertes A. Angew. Chem. Int. Ed. 2012;51:10386–10389. doi: 10.1002/anie.201205436. [DOI] [PubMed] [Google Scholar]
- 28.Zhang LW, Vertes A. Anal. Chem. 2015;87:10397–10405. doi: 10.1021/acs.analchem.5b02502. [DOI] [PubMed] [Google Scholar]
- 29.Saha-Shah A, Green CM, Abraham DH, Baker LA. Analyst. 2016;141:1958–1965. doi: 10.1039/c6an00028b. [DOI] [PubMed] [Google Scholar]
- 30.Hu J, Jiang XX, Wang J, Guan QY, Zhang PK, Xu JJ, Chen HY. Anal. Chem. 2016;88:7245–7251. doi: 10.1021/acs.analchem.6b01490. [DOI] [PubMed] [Google Scholar]
- 31.Zhang LW, Foreman DP, Grant PA, Shrestha B, Moody SA, Villiers F, Kwak JM, Vertes A. Analyst. 2014;139:5079–5085. doi: 10.1039/c4an01018c. [DOI] [PubMed] [Google Scholar]
- 32.Onjiko RM, Morris SE, Moody SA, Nemes P. Analyst. 2016;141:3648–3656. doi: 10.1039/c6an00200e. [DOI] [PMC free article] [PubMed] [Google Scholar]
- 33.Lapainis T, Rubakhin SS, Sweedler JV. Anal. Chem. 2009;81:5858–5864. doi: 10.1021/ac900936g. [DOI] [PMC free article] [PubMed] [Google Scholar]
- 34.Nemes P, Knolhoff AM, Rubakhin SS, Sweedler JV. Anal. Chem. 2011;83:6810–6817. doi: 10.1021/ac2015855. [DOI] [PMC free article] [PubMed] [Google Scholar]
- 35.Nemes P, Rubakhin SS, Aerts JT, Sweedler JV. Nat. Protoc. 2013;8:783–799. doi: 10.1038/nprot.2013.035. [DOI] [PMC free article] [PubMed] [Google Scholar]
- 36.Onjiko R, Portero E, Moody S, Nemes P. Anal. Chem. 2017 doi: 10.1021/acs.analchem.7b00880. accepted (in print) [DOI] [PMC free article] [PubMed] [Google Scholar]
- 37.Moody SA. Methods Mol Biol. 2000;135:331–347. doi: 10.1385/1-59259-685-1:331. [DOI] [PubMed] [Google Scholar]
- 38.Moody SA, Kline MJ. Anat. Embryol. 1990;182:347–362. doi: 10.1007/BF02433495. [DOI] [PubMed] [Google Scholar]
- 39.Dale L, Slack JM. Development. 1987;99:527–551. doi: 10.1242/dev.99.4.527. [DOI] [PubMed] [Google Scholar]
- 40.Moody SA. Dev. Biol. 1987;122:300–319. doi: 10.1016/0012-1606(87)90296-x. [DOI] [PubMed] [Google Scholar]
- 41.Moody SA. Dev. Biol. 1987;119:560–578. doi: 10.1016/0012-1606(87)90059-5. [DOI] [PubMed] [Google Scholar]
- 42.Xia JG, Sinelnikov IV, Han B, Wishart DS. Nucleic Acids Res. 2015;43:W251–W257. doi: 10.1093/nar/gkv380. [DOI] [PMC free article] [PubMed] [Google Scholar]
- 43.Tautenhahn R, Cho K, Uritboonthai W, Zhu ZJ, Patti GJ, Siuzdak G. Nat. Biotechnol. 2012;30:826–828. doi: 10.1038/nbt.2348. [DOI] [PMC free article] [PubMed] [Google Scholar]
- 44.Wishart DS, Jewison T, Guo AC, Wilson M, Knox C, Liu YF, Djoumbou Y, Mandal R, Aziat F, Dong E, Bouatra S, Sinelnikov I, Arndt D, Xia JG, Liu P, Yallou F, Bjorndahl T, Perez-Pineiro R, Eisner R, Allen F, Neveu V, Greiner R, Scalbert A. Nucleic Acids Res. 2013;41:D801–D807. doi: 10.1093/nar/gks1065. [DOI] [PMC free article] [PubMed] [Google Scholar]
- 45.Huan T, Tang CQ, Li RH, Shi Y, Lin GH, Li L. Anal. Chem. 2015;87:10619–10626. doi: 10.1021/acs.analchem.5b03126. [DOI] [PubMed] [Google Scholar]