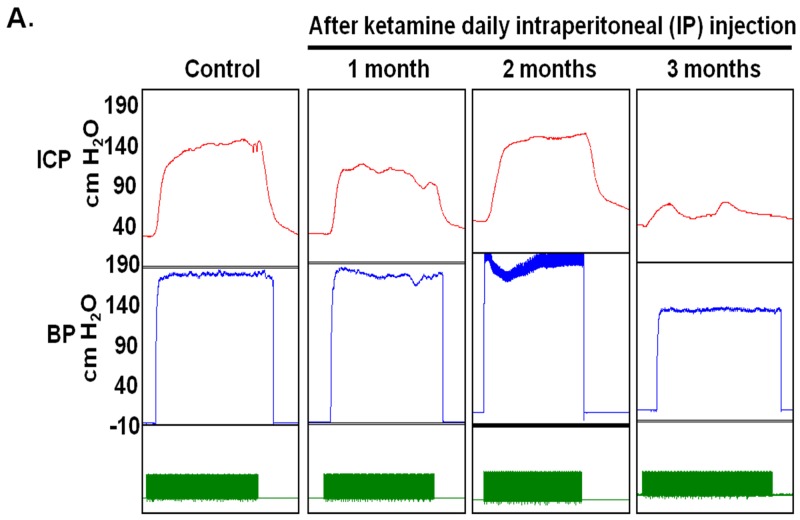
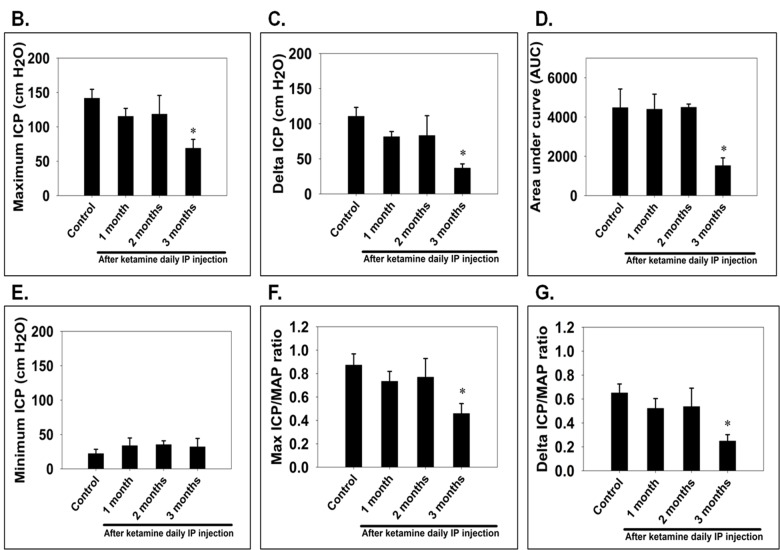
Figure 1. Electrostimulation of cavernous nerves after administration of ketamine for 1, 2 and 3 months.
A. Representative intracavernosal pressure (ICP) responses to 60 seconds for control or experimental groups stimulated at 1, 2 and 3 months after administration of ketamine. Mean maximal ICP B. delta ICP C. total ICP (area under the curve) D. and minimum ICP E. in each experimental group were measured. Ratio of maximal ICP to mean arterial pressure (MAP) F. and ratio of delta ICP to MAP G. were calculated for each group. Ketamine treated 3 months group showed significantly low ICP compared with control. Each bar depicts the mean ± SD for n = 8 animals per group. One-way ANOVA was used for statistical analysis.


