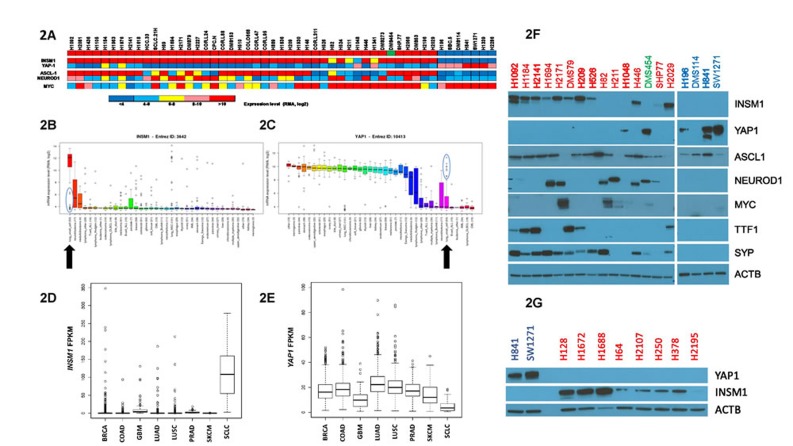
Figure 2. INSM1 and YAP1 expression in SCLC cell lines.
A. Expression of various genes in individual SCLC cell lines. Cell lines are arranged, left to right, following their gene expression clustering assignments, as shown in Figure 1A and Supplementary Figure S1. Gene mRNA expression for individual genes, listed on left, was color-coded based upon the RMA, log2 values, obtained from the CCLE. Comparison of INSM1 B. and YAP1 C. mRNA expression levels among different types of cancer cell lines in the CCLE. The line within individual boxes represents the median expression value of all cells tested and the individual circles represent ‘outlier’ cells whose expression values do not fall within the 25-75% quantile of values measured for that gene (represented by the box). The blue circles highlight the subgroup of outliers present in SCLC cells. Arrows highlight SCLC. D. Boxplot comparing INSM1 expression among tumors using RNAseq data from the TCGA and Rudin et al [14]. Tumor types listed on x-axis with INSM1 mRNA level listed as FPKM on the y-axis. Boxplots similar to panels B and C except use FPKM expression values. In addition to SCLC, other cancers analyzed were breast (BRCA), colorectal adenocarcinoma (COAD), brain glioblastoma (GBM), lung adenocarcinoma (LUAD), lung squamous cell carcinoma (LUSC), prostate (PRAD) and skin (SKCM). E. Same as panel D except for YAP1 mRNA expression. F. Western blots of protein lysates. Targeted protein listed on right. Cells are arranged on blot, left to right, in identical order as shown on clustering diagram in Figure 1A. Cell names are written in colored text to designate their subgroup classification. Group II cells were run on a separate gel but otherwise analyzed on the same day and conditions as Group I cells. β-actin (ACTB) was used as a loading control. G. Same as panel F except for SCLC cell lines not included in the CCLE dataset.

