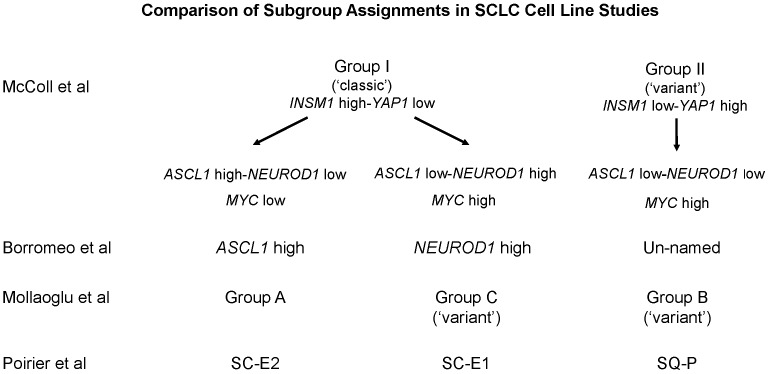
Figure 6. Comparison of SCLC subgroups among multiple studies.
Subgroup assignments and/or gene expression data of cell lines using Figure 1A of this study, Figure 1A of Borromeo et al [12], Figure 3A of Mollaoglu et al [13], and Figure 5A of Poirier et al [11] were compared and vertically grouped by their general similarity to one another. The group names used by each individual study are given to facilitate comparisons.

