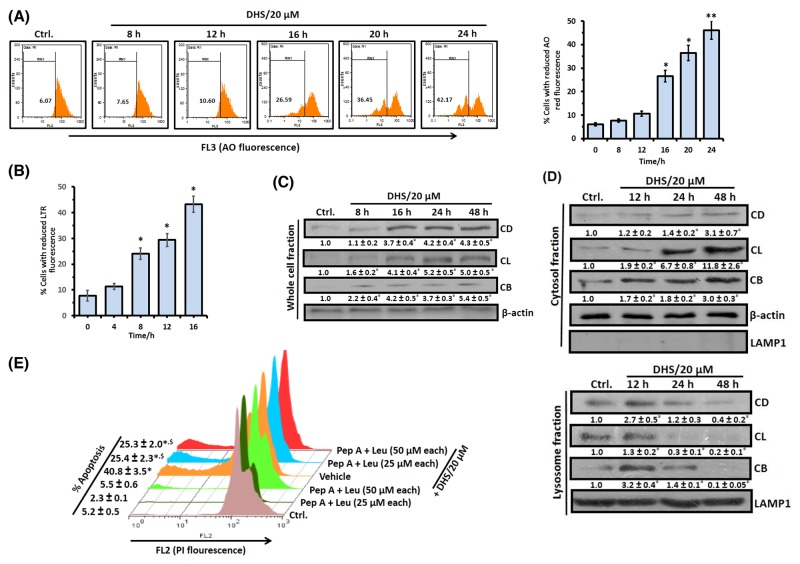
Figure 4. DHS induces LMP in IMR32 cells to release cathepsins that cause apoptosis.
(A) and (B) Flow cytometry analyses of LMP. The cells were incubated with DHS (20 μM) for 0-24 h, stained with AO or LTR and analyzed by flow cytometry. The % of cells showing reduced red fluorescence (FL3 channel) was used to quantify LMP. (C) and (D) Expressionsof cathepsins B, L and D and their translocations into cytosol. The cells were incubated for 0-48 h with DHS (0 and 20 μM) and the whole cell, cytoplasmic and lysosomal extracts were subjected to immunoblotting, using suitable antibodies against the mature forms of CB, CL and CD. The protein bands were detected using a Kodak Gel-doc software and the intensity ratios of the individual bands to that of vehicle control, taken as 1 (arbitrary unit) were quantified after normalizing with respective loading controls. (E) Effect of cathepsins inhibitors on apoptosis. The cells were treated with vehicle (0.1% DMSO) or Pep A-Leu mixture for 1 h followed by incubation with DHS (0 and 20 μM) for 48 h, and the sub-G1 cell populations analyzed. All determinations were made in duplicates for immunoblots and five replicates for flow cytometry analyses in 3-4 different experiments. The values are mean ± S. E. M. *p<0.05, **p<0.01 compared to vehicle control; $p<0.01 compared to only DHS treatment. Representative histograms and images are shown.

