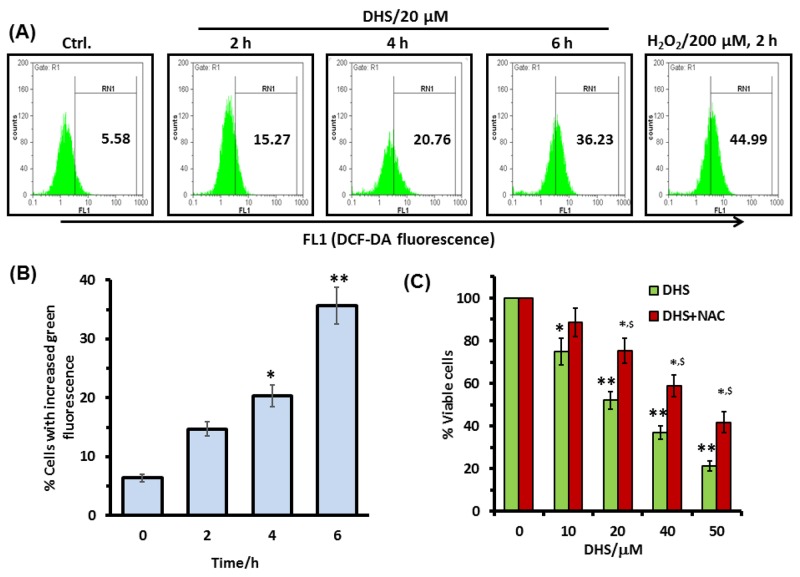
Figure 7. Intracellular ROS is involved in the DHS-induced cytotoxicity in IMR32 cells.
(A) and (B) ROS generation by DHS as revealed by flow cytometry. Cells were treated with DHS (0 and 20 μM) for different time periods and the ROS levels measured by the H2DCF-DA assay. (C) Effect of NAC on cell viability after DHS treatment. The cells were pretreated with NAC (5 mM) or sham medium for 1 h, further incubated for 48 h with DHS and the cell viability assayed by MTT reduction method. All determinations were made in five replicates in 3-4 different experiments. The values are mean ± S. E. M. *p<0.05, **p<0.01 compared to vehicle control; $p<0.05 compared to only DHS treatment. Representative histograms are shown.

