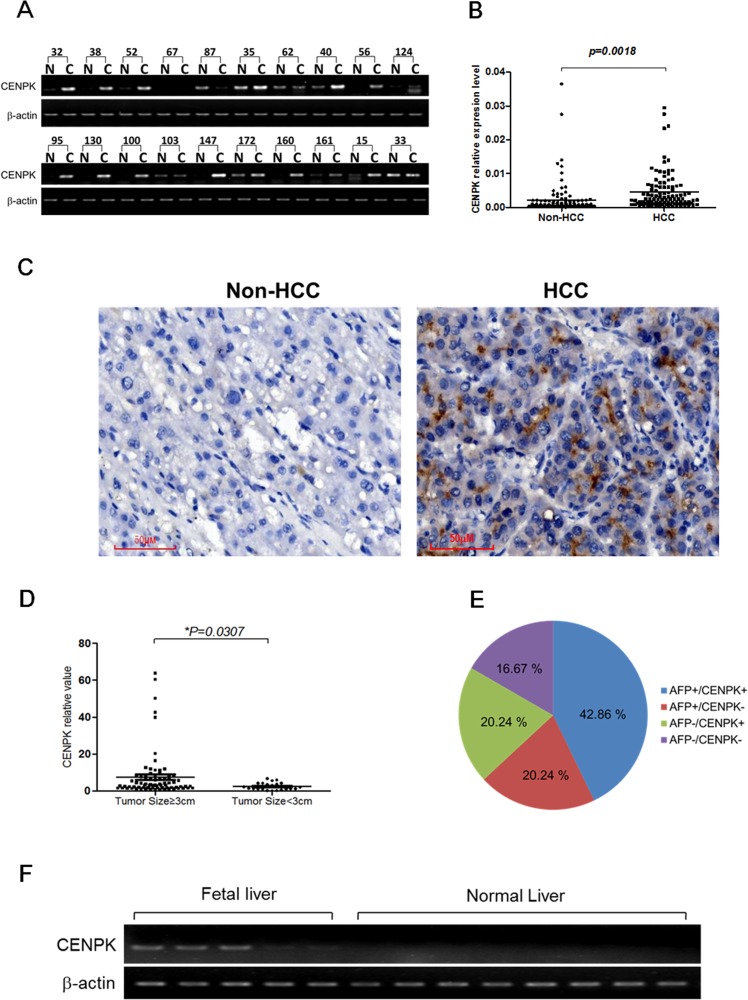
Figure 1. The expression pattern of CENP-K mRNA and protein in HCC specimens.
(A) Representative semi-quantative RT-PCR results of CENP-K in 20 matched HCC (C) and their corresponding adjacent non-cancerous livers (N); (B) CENP-K expression fold of HCC tissue versus the corresponding adjacent non-tumor tissues in 105 pairs of samples; (C) Representative immunohistochemical staining of a pair of HCC specimens and its corresponding non-tumor tissue, as determined using an anti-CENP-K antibody. The nuclei were counterstained with hematoxylin. (D) CENP-K mRNA levels comparision between tumors with the size larger or smaller than 3 cm; (E) The distribution of CENP-K and AFP mRNA levels in 105 HCC specimens; (F) Semi-quantitative RT-PCR analysis of CENP-K in 5 fetal liver tissues and 8 normal liver tissues.

