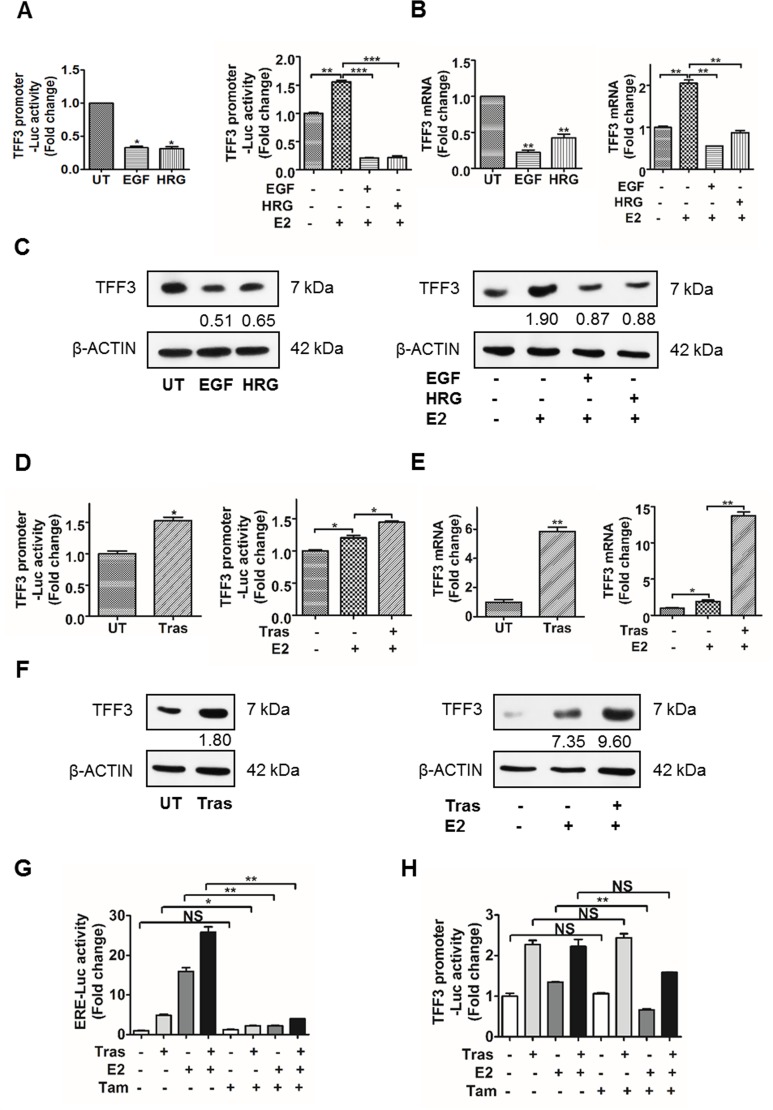
Figure 1. Activation of HER2 decreased TFF3 expression, while inhibition of HER2 increased TFF3 expression in BT474 cells partially in an ERα-independent manner.
(A–C) Left, BT474 cells were treated with 500 ng/ml EGF or HRG for 24 and 48 hours respectively, in phenol-red free media supplemented with 10% charcoal-stripped FBS. (A–C) Right, BT474 cells were treated with 200 ng/ml EGF or HRG for 48 hours in phenol-red free media supplemented with 10% charcoal-stripped FBS in the presence of 100 nM 17β-estradiol. (D–F) BT474 cells were treated with 10 µg/ml trastuzumab for 48 hours in phenol-red free media supplemented with 10% charcoal-stripped FBS ± 100 nM 17β-estradiol. (A and D) TFF3 promoter luciferase activity was measured with Renilla luciferase activity as transfection control. TFF3 (B and E) mRNA and (C and F) protein levels were determined by qPCR and western blot respectively, with β-ACTIN as input control. The densitometric analyses of protein bands were performed using ImageJ. (G and H) BT474 cells were treated with 10 µg/ml trastuzumab ± 100 nM 17β-estradiol ± 1 µM Tamoxifen for 48 hours in phenol-red free media supplemented with 10% charcoal-stripped FBS. (G) ERE and (H) TFF3 promoter luciferase activities were measured with Renilla luciferase activity as transfection control. UT: untreated; E2: 17β-estradiol; Tras: trastuzumab; Tam: tamoxifen; ERE: estrogen response element. *p < 0.05; **p < 0.01; ***p < 0.001; NS, no significance.

