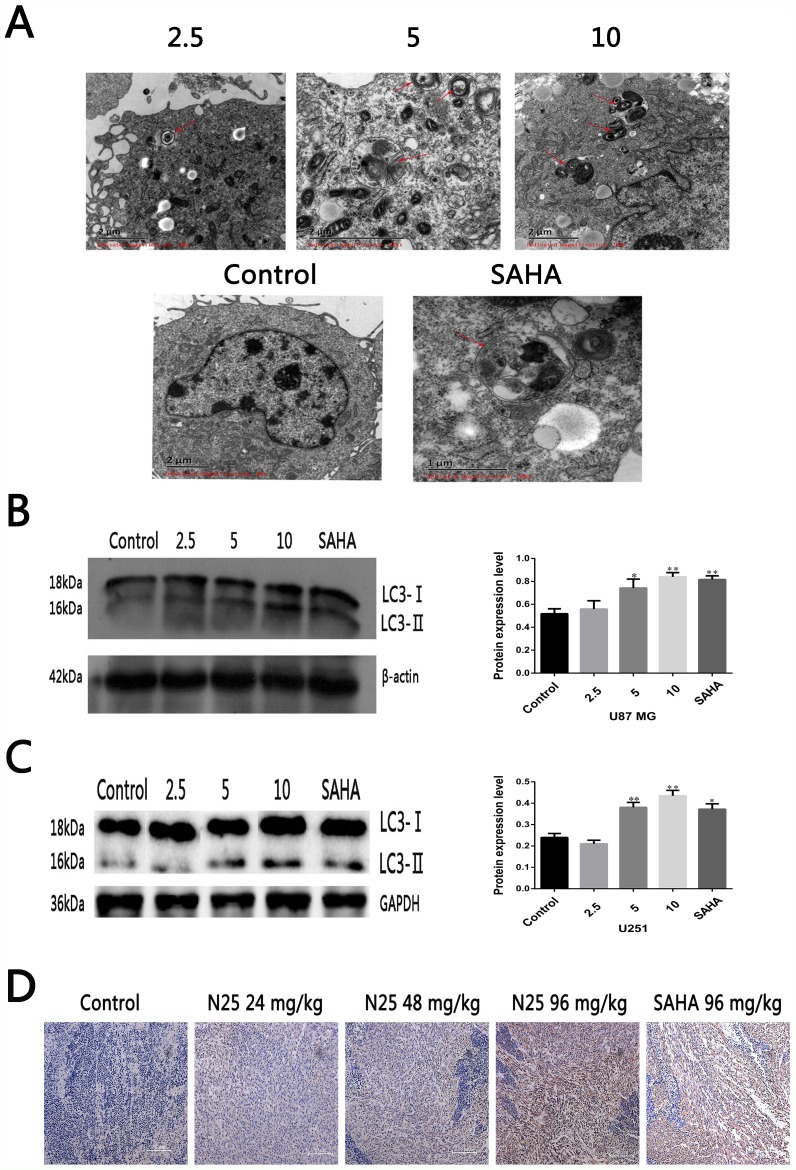
Figure 2. N25 induced autophagy in glioma cells and xenograft tumor model.
(A) N25 induced autophagosome formation in U87-MG cells treated with various concentration (2.5, 5, 10 μM) of N25 or 10 μM SAHA for 48 hours. The red arrows present autophagosome. (B) N25 up-regulated protein expression of LC3-II in U87-MG cells. (C) N25 up-regulated protein expression of LC3-II in U251 cells. (D). N25 promoted LC3 protein expression in U87-MG xenograft tumor model. *P<0.05 and **P<0.01 compared with control group. The data are shown as the mean±SD (n=3), and representative results from three independent experiments with similar results are shown.

