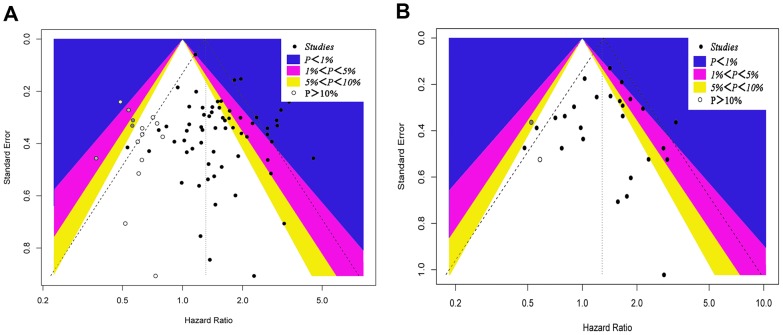
Figure 4. A contour-enhanced funnel plot for meta-analysis.
(A) A contour-enhanced funnel plot for meta-analysis of the association between the HER-2/neu expression and OS in patients with EOC. The left blank area represents the area where 15 studies (white circles) were included when the trim-and-fill method was applied. (B) A contour-enhanced funnel plot for meta-analysis of the association between the HER-2/neu expression and PFS in patients with EOC. The left blank area represents the area where two studies (white circles) were included when the trim-and-fill method was applied.

