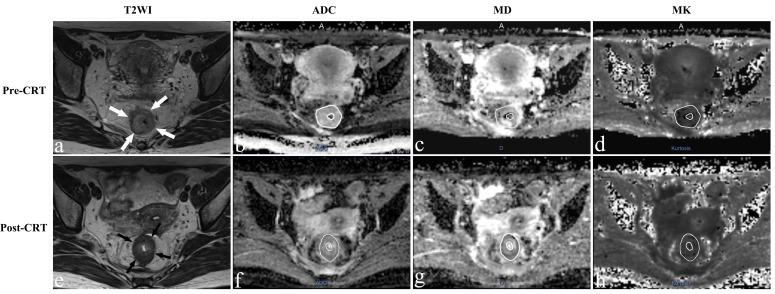
Figure 1. Representative images of a 36-year-old woman with a pCR.
Images in each row are from two measurement time points: 2-5 days before CRT (pre-CRT) and 1-4 days before surgery (post-CRT). a., e. Before and after CRT T2-weighted MR image shows that there is a tumor with ring shape visible in the rectum (arrows). The ADC map, D map, and K map have similar image contrast and manual tracing of ROIs within the tumor area (The whole tumor was not shown here). The ADC, MD and MK values were 0.932×10⁻³ mm2/s, 1.580×10⁻³ mm2/s and 0.657 before treatment. The ADC and MD values increased obviously to 1.240×10⁻³mm2/s and 2.601×10⁻³mm2/s, while the MK value decreased slightly to 0.535 after CRT.

