. 2017 Oct 6;6:e28505. doi: 10.7554/eLife.28505

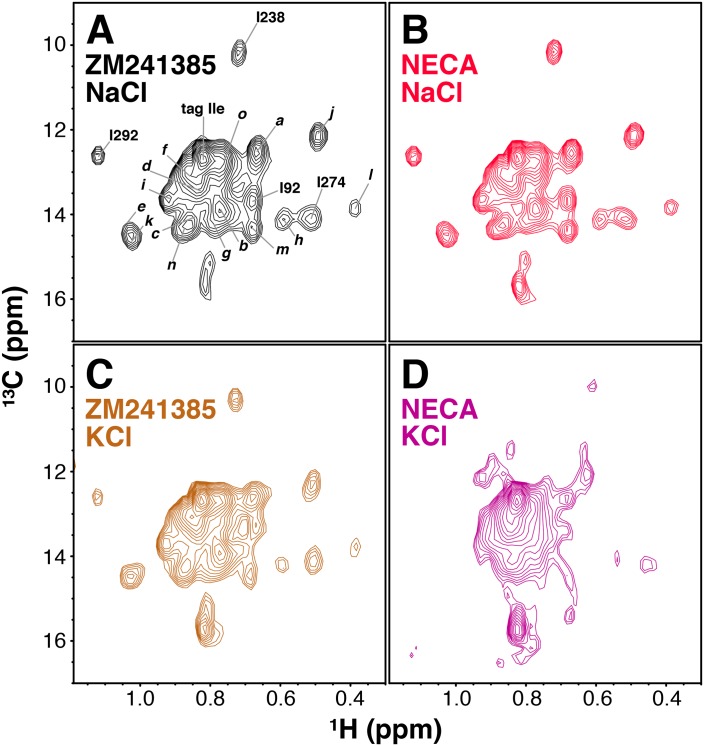
Figure 3. Ligand- and cation-dependent chemical shift changes in A2AR.

(A) 1H/13C HMQC spectrum of Ile δ1-labeled WT A2AR in DDM micelles and 150 mM NaCl with inverse agonist ZM241385 (black). Residue numbers of assigned peaks and peak IDs of unassigned peaks are indicated in black. (B) 1H/13C HMQC spectrum of Ile δ1-labeled WT A2AR in DDM micelles and 150 mM NaCl with agonist NECA (red). (C) 1H/13C HMQC spectrum of Ile δ1-labeled WT A2AR in DDM micelles and 150 mM KCl with inverse agonist ZM241385 (brown). (D) 1H/13C HMQC spectrum of Ile δ1-labeled WT A2AR in DDM micelles and 150 mM KCl with agonist NECA (purple).

Figure 3.

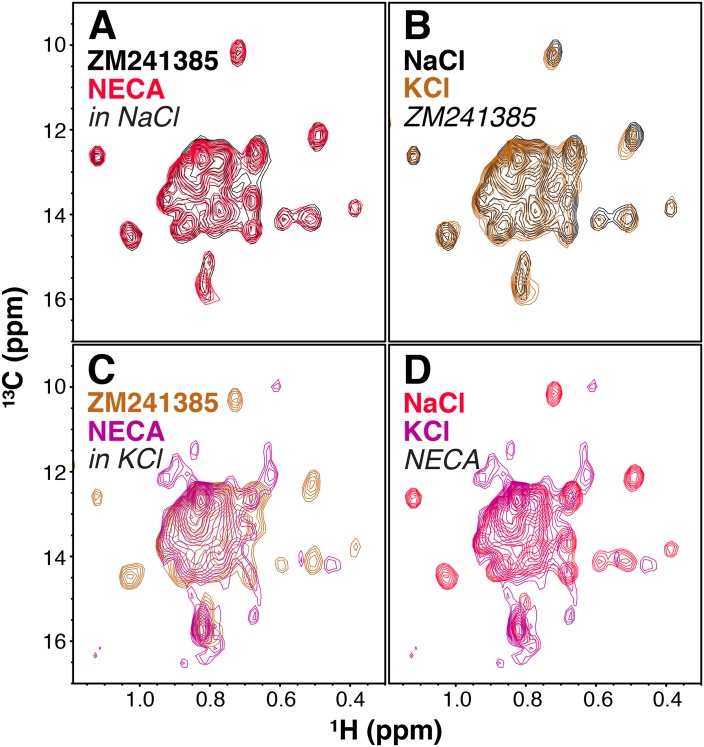
Figure 3—figure supplement 1. Overlays of ligand- and cation-dependent chemical shift changes in A2AR.

Figure 3—figure supplement 1.

Overlays of pairs of spectra in Figure 3. (A) 1H/13C HMQC spectra of Ile δ1-labeled WT A2AR in DDM micelles and 150 mM NaCl with inverse agonist ZM241385 (black) and agonist NECA (red). (B) 1H/13C HMQC spectra of Ile δ1-labeled WT A2AR in DDM micelles and 150 mM NaCl (black) or 150 mM KCl (brown) with inverse agonist ZM241385. (C) 1H/13C HMQC spectra of Ile δ1-labeled WT A2AR in DDM micelles and 150 mM KCl with inverse agonist ZM241385 (burnt orange) and agonist NECA (purple). (D) 1H/13C HMQC spectra of Ile δ1-labeled WT A2AR in DDM micelles and 150 mM NaCl (red) or 150 mM KCl (purple) with agonist NECA.