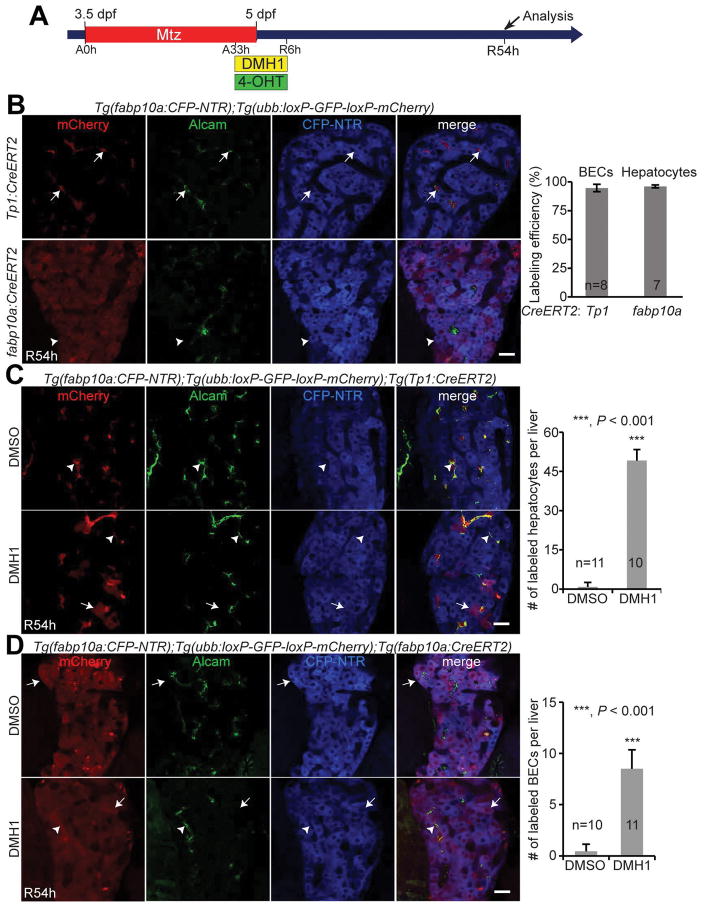
Figure 3. Bmp inhibition maintains HB-LCs as undifferentiated.
(A) Experimental scheme illustrating the stages of Mtz, DMH1, and 4-OHT treatment. (B) Labeling efficiency of the lineage tracing with the Tg(Tp1:CreERT2) and Tg(fabp10a:CreERT2) lines. Arrows point to CFP−/mCherry+/Alcam+ cells (Cre-labeled BECs); arrowheads point to CFP+/mCherry+/Alcam− cells (Cre-labeled hepatocytes). Quantification of the percentage of the labeled BECs and hepatocytes. (C, D) Single-optical section images showing the expression of mCherry, Alcam, and fabp10a:CFP-NTR in regenerating livers at R54h. A Cre reporter line, Tg(ubb:loxP-GFP-loxP-mCherry), was used together with the Tg(Tp1:CreERT2) (C) or the Tg(fabp10a:CreERT2) (D) line. Arrows point to CFP+/mCherry+/Alcam− hepatocytes; arrowheads point to CFP−/mCherry+/Alcam+ BECs. Quantification of the numbers of CFP+/mCherry+/Alcam− hepatocytes and CFP−/mCherry+/Alcam+ BECs per liver. Scale bars: 20 μm; error bars: ±SEM.

