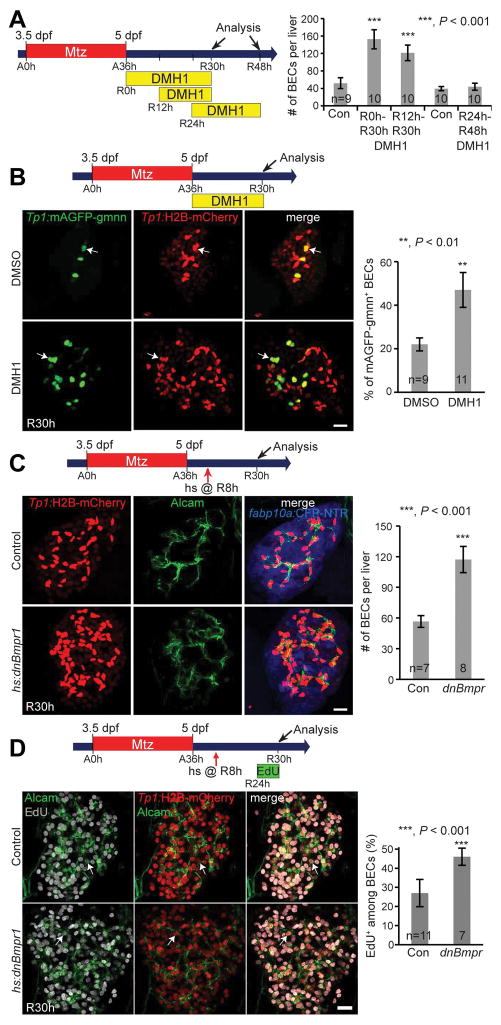
Figure 4. Bmp inhibition after hepatocyte ablation increases BEC number in regenerating livers via proliferation.
(A) Experimental scheme illustrating the stages of Mtz and DMH1 treatment. Quantification of the total numbers of BECs in regenerating livers treated with DMH1 for three different time-windows. (B) Confocal projection images showing Tp1:H2B-mCherry and Tp1:mAGFP-gmnn expression in regenerating livers. Arrows point to mCherry/mAGFP-gmnn double-positive cells. Quantification of the percentage of mAGFP-gmnn+ cells among H2B-mCherry+ BECs. (C) Confocal projection images showing the expression of Alcam, Tp1:H2B-mCherry, and fabp10a:CFP-NTR in regenerating livers at R30h. Quantification of the total numbers of BECs (H2B-mCherry+/Alcam+) per liver. (D) Confocal projection images showing EdU labeling and Alcam and Tp1:H2B-mCherry expression in regenerating livers. Arrows point to EdU+ BECs. Quantification of the percentage of EdU+ cells among BECs. Scale bars: 20 μm; error bars: ±SEM.

