

Abstract
Glutaminolysis, a metabolic process that converts glutamine to glutamate, is particularly important for the central nervous system since glutamate is the major transmitter of excitatory synapses. Glutaminase is the mitochondrial enzyme that catalyzes the first step of glutaminolysis. Two genes encode at least four isoforms of glutaminase in humans. GLS1 gene encodes isoforms kidney-type glutaminase and glutaminase C (GAC) through alternative splicing, whereas GLS2 gene encodes liver-type glutaminase isoforms. KGA and GAC have been associated with several neurological diseases. However, it remains unclear whether changes in their expressions can directly cause brain abnormalities. Using a transgenic approach, we generated mice that overexpressed GAC in the brain. The resulting transgenic mice had severe impairments in spatial and fear learning compared with littermate controls. The learning deficits were consistent with diminished hippocampal long-term potentiation in the hippocampal slices of the GAC transgenic mice. Furthermore, we found increases in astrocyte and microglia markers, inflammatory factors, and a decrease in synapse marker synaptophysin, suggesting neuroinflammation and synaptic changes in the GAC transgenic mouse brains. In conclusion, these findings provide the first evidence that GAC overexpression in the brain has deleterious effects on learning and synaptic integrity in vivo.
Keywords: Excitotoxicity, Glutaminase, Learning and Memory, Synaptic transmission, Neurodegeneration, Inflammation, Transgenic model
Introduction
Glutamate is the major transmitter of excitatory synapses in the central nervous system (CNS) (Komuro and Rakic, 1996). It is essential for physiologic processes including neural development, synaptic plasticity, learning, and memory (LoTurco et al., 1991; McEntee and Crook, 1993). However, at excess levels, glutamate induces neuronal injury in the form of excitotoxicity. Excitotoxicity has been linked to the pathogenic processes of various CNS disorders (Benveniste, 2009; Kanellopoulos et al., 2000; Rao et al., 1998; Xu et al., 2004) and neurodegenerative diseases including HIV-1-associated neurocognitive disorders (HAND) (Killestein et al., 2005; Zhao et al., 2004; Zoia et al., 2005). In CNS, glutamate is typically derived from glutamine by the mitochondrial enzyme glutaminase. The reaction formula is: Glutamine + H2O → Glutamate + NH3. Two genes (GLS1 and GLS2) encode at least four isoforms of glutaminase in humans. Glutaminase isoforms encoded by GLS1 are the predominant glutamine-utilizing and glutamate-producing enzymes in CNS, compared with isoforms encoded by GLS2 (Baglietto-Vargas et al., 2004). GLS1 encodes glutaminase C (GAC) and isoform kidney-type glutaminase (KGA) isoform through alternative splicing. GAC shares the same functional region of KGA, but possesses a unique C-terminal (Porter et al., 2002). The reaction catalyzed by GAC and KGA is energetically favorable, so both enzymes must be tightly regulated to prevent excess glutamate generation and excitotoxicity (Erdmann, 2006).
In the brain, glutaminase expression follows a neuron-specific pattern (Ye et al., 2013). Glutaminase activity and mRNA are mainly found in neuron-rich structures such as the cortex but at low levels in myelin-rich structures (Botman et al., 2014; Najlerahim et al., 1990). However, isoforms of glutaminase can also be detected in cultured astrocytes with enzyme acitvities (Kvamme et al., 2001). Neurons derived from GLS1 knockout mice show a reduction in glutamatergic synaptic transmission. Consistent with the finding of impaired neuronal functions, GLS1 knockout mice die shortly after birth, possibly due to defects in brainstem respiratory centers (Masson et al., 2006). Furthermore, GLS1 heterozygous mice that have a 50% reduction in GLS1 gene expression respond less to ketamine and amphetamine, display an antipsychotic drug-like profile in the latent inhibition test, and have a selective reduction in spontaneous excitatory input and reduced strength of Schaffer collateral input (Gaisler-Salomon et al., 2009). These expression and gene knockout studies implicate important physiological functions of glutaminase in vivo.
Glutaminase has been implicated in the neurotoxic effect of various CNS cell types in vitro, including macrophages, microglia (Huang et al., 2011; Tian et al., 2012; Zhao et al., 2004), and neurons (Hoffman et al., 2016; Ye et al., 2013). Furthermore, glutamianse is associated with various neurodegenerative and neuroinflammatory disesases such as HIV-1 associated dementia, multiple sclerosis, amyotrophic lateral sclerosis, and Alzheimer's disease (Burbaeva et al., 2014; D'Alessandro et al., 2011; Huang et al., 2011; Werner et al., 2001; Zhao et al., 2012), as well as neuropsychiatric diseases such as schizophrenia (Gluck et al., 2002). Most recently, we demonstrated that glutaminase-containing extracellular vesicles from HIV-infected macrophages, air polutants-treated macrophages, and immune-activated microglia were neurotoxic (Liu et al., 2015; Wu et al., 2015). Investigations on glutaminase functions may provide novel insights into the pathogenesis, as well as the treatment of these CNS disorders.
To determine the causal association between glutaminase and brain abnormalities, we generated a GAC overexpression transgenic (Tg) mouse model, which has the GAC overexpression confined in the nestin promoter-derived cells. We characterized the mouse model and found dramatic learning and memory deficits, synaptic dysfunctions, and neuroinflammation in the GAC transgenic mice. This mouse model provides the first proof-of-principle that glutaminase overexpression in the brain is detrimental to the learning and synaptic integrity of mice.
Materials and Methods
Animals
All mice were housed and bred in the Comparative Medicine Animal Facilities at the University of Nebraska Medical Center. All procedures were conducted in accordance with the protocols approved by the Institutional Animal Care and Use Committee at the University of Nebraska Medical Center.
Construction of plasmids and generation of CAG-loxp-GAC and Nes-GAC mice
The mouse Gac gene was cloned from a C57 mouse cDNA library and inserted into the pCAG-Loxp-GFP-STOP-Loxp-IRES-LacZ plasmid at the restriction enzyme site XhoI. The constructed plasmid was sequenced and screened for plasmids with Gac forward inserted. Subsequently, the plasmid was linearized and microinjected into the fertilized egg for implantation into a pseudopregnant female to create CAG-LSL-GAC Tg mice, in which LSL stands for Loxp-GFP-STOP-Loxp. The generation of Tg mice was carried out in the Mouse Genome Engineering Core Facility at UNMC. GFP expressions in the brains of CAG-LSL-GAC mice were examined to identify Tg founder mice that stably expressed the GAC insert. The CAG-LSL-GAC mice were then mated with a nestin promoter-driven cre transgenic mouse (Nestin-Cre mouse, Jackson Laboratory, Bar Harbor, ME) line to produce Nes-GAC mice. The Nes-Cre mouse line is on C57BL6 background. All transgenic mice were genotyped through PCR reactions. DNA from embryonic tissue or adult mouse-tail tissue was extracted with phenol/chloroform, and purified by isopropanol and ethanol for PCR reactions. The Primers used for genotyping are listed in Table 1. All mice used in the current studies were either 8-12 week or 9-month old. Their GAC transgene-negative littermates were used as controls. At the experimental end point, mice were put under deep anesthesia through isoflurane then followed by decapitation. Regional brain dissection was performed as we described before (Peng et al., 2004).
Table 1. Primers used for the genotyping of Nes-GAC mouse.
Two sets of primers were used to determine the genotype of Nes-GAC mouse. GAC c and GAC d were used to determine the presence of Gac gene. Cre F and Cre R were used to determine the presence of Cre.
| GAC c | GCTGTTAATGACCTGGGAACTG |
| GAC d | GTACCTCGAGCATCTCTAGCTCCTCTCCC |
| Cre F | GCGGTCTGGCAGTAAAAACTATC |
| Cre R | GTGAAACAGCATTGCTGTCACTT |
Morris Water Maze (MWM) test
MWM test consists of two parts: the training phase and probe test. Mice were introduced into a circular, water-filled tank, 91 cm in diameter and 110 cm in height. The tank was equally divided into four quadrants. Visual cues were placed around the pool in plain sight of the mouse to flag the submerged platform (10 cm in diameter). Various parameters of mouse movement were recorded, including the time spent in each quadrant of the pool, the time taken to reach the platform (escape latency), and the total distance traveled. For each trial, the mouse was allowed no more than 60 seconds to find the submerged platform before they were guided to the platform, removed from water, towel dried and returned to their cage. Each mouse completed four trials per day during the 5-day training phase. One day after the training, the probe test was conducted. The platform was removed and each mouse was given 60 seconds to swim in the water. The swimming was videotaped and analyzed by Ethovision XT (Noldus, Netherlands).
Contextual Fear Conditioning (CFC) Test
Fear conditioning in mice was performed following standard procedures in the light- and sound-attenuated chambers (Coulbourn Tru Scan Activity Monitoring System for mice). Mouse behavior was evaluated under ambient illumination (room light) and was recorded by a SAMSUNG digital video camera set above the mouse arena chamber. Videos were analyzed by Ethovision XT (Noldus). The time of freezing was assessed by measuring changes in pixel intensities of video frames. The fear conditioning spanned 3 days. On the first day, mice were given 300 seconds to be habituated to the arena chamber and no shock was administered. The mouse chamber was cleaned with 70% ethanol before the introduction of each mouse to the arena chamber. On the second day, the mouse chamber was scented with 0.1% acetic acid and the mice were given two electric shocks at 170 s and 290 s during the 300 s through the automated Tru Scan Stimulus. The chamber was cleaned with a non-alcohol disinfectant. On the third day, the chamber was also scented with 0.1% acetic acid but no shock was given. Mice in the mouse chamber were recorded for 180 s. The mouse chamber was cleaned with a non-alcohol disinfectant. The freezing behavior was analyzed by Ethovision XT (Noldus) and the percent of freezing was calculated for each day.
Protein extraction and Western blot
The animals were euthanized and their brains were removed. The hippocampi, cortices, striata, and kidneys were dissected and homogenized by a homogenizer in the M-PER Protein Extraction Buffer (Pierce, Rockford, IL) containing a protease inhibitor cocktail (Sigma, St. Louis, MO). Protein concentrations were determined using a BCA Protein Assay Kit (Pierce). Proteins (5-10 μg) from tissue lysates were separated by sodium dodecyl sulfate-polyacrylamide gel electrophoresis (SDS-PAGE). After electrophoretic transfer to polyvinyldifluoridene membranes (Millipore and Bio-Rad), proteins were treated with purified primary antibodies for MAP-2 (mouse, cat#MAB3418, Millipore, 1:1000), GAC (rabbit, Dr. N. Curthoys, Colorado State University, 1:500), Synaptophysin (rabbit, cat#ab32127, Abcam, 1:25,000), GFAP (mouse, cat#3670S, Cell Signaling Technologies, Beverly, MA, 1:1000), PARP (rabbit, cat# 9542s, Cell Signaling Technologies, Beverly, MA, 1:1000), Caspase 3 (rabbit, cat#9662s, Cell Signaling Technologies, 1:1000), or β-actin (Sigma-Aldrich) overnight at 4 °C followed by a horseradish peroxidase-linked secondary anti-rabbit or anti-mouse antibody (Cell Signaling Technologies, 1:10,000). Antigen-antibody complexes were visualized by Pierce ECL Western Blotting Substrate (Thermo Fisher Scientific, Waltham, MA). For data quantification, films were scanned with a CanonScan 9950F scanner; the acquired images were then analyzed on a Macintosh computer using the public domain NIH Image J program (at http://rsb.info.nih.gov/nih-image/).
Free-floating immunohistochemistry and image analyses
Animals were euthanized under deep anesthesia and perfused with phosphate-buffered saline (PBS) and then with 4% paraformaldehyde (PFA) in PBS. The brains were removed and immersed in freshly depolymerized 4% PFA in PBS for 48 hours and then cryoprotected by 30% sucrose for 48 hours. The fixed, cryoprotected brains were frozen and sectioned in the coronal plane at 30 μM using a Cryostat (Leica Microsystems Inc., Bannockburn, IL), with sections collected serially in PBS as previously described (Zhu et al., 2012). Brain sections were then incubated overnight at 4 °C with primary antibodies, followed by secondary antibodies (Molecular Probes, Eugene, OR, 1:1000) for 1 hour at 25 °C. Primary antibodies included rabbit glutaminase (Dr. N. Curthoys, Colorado State University, 1:500), rabbit Iba1 (Wako Chemicals USA, Inc., Richmond, VA, cat#1919741, 1:500), and rabbit GFAP (Dako, Carpinteria, CA, 1: 2000). All antibodies were diluted in 5% goat serum in PBS. Cells were counterstained with DAPI (Sigma-Aldrich, 1:2000) to identify the nuclei. Images were taken using a Zeiss Meta 710 confocal microscope (Carl Zeiss MicroImaging, LLC) (20× object, tile scan 4×4 mode). Eight brain section images from three mice were imported into Image-ProPlus, version 7.0 (Media Cybernetics, Silver Spring, MD) for quantification of GLS, GFAP/DAPI, or Iba1/DAPI double positive staining.
Hippocampal electrophysiology
Mouse hippocampal slices were prepared as previously described (Anderson et al., 2003; Anderson et al., 2004). Briefly, mouse hippocampi were dissected free and transverse hippocampal slices (300 μM in thickness) were prepared using a tissue chopper. The hippocampal slices were incubated in the artificial cerebrospinal fluid (ACSF, contained 124mM NaCl, 26mM NaHCO3, 1.25 mM NaH2PO4, 2.5 mM KCl, 2 mM CaCl2, 2 mM MgCl2, and 10 mM glucose equilibrated with 95% O2 and 5% CO2, pH 7.3-7.4). The temperature of the perfusate was maintained at 30 ± 1 °C with an automatic temperature controller (Warner Instrument, Hamden, CT). The slices were incubated in the ACSF for 1-2 hours, and then transferred to a recording chamber mounted on the stage of a dissection microscope. Field excitatory postsynaptic potentials (fEPSPs) were evoked by a constant current, low-frequency orthodromic stimulation (0.05 Hz) of Schaffer collateral/Schaffer collateral commissural axons using an insulated (excluding the tip) bipolar tungsten electrode. The intensity of stimulation was selected to generate nearly 50% of a maximum response. The evoked fEPSPs were recorded with an Axopatch-1D amplifier (Axon Instruments, CA) in the CA1 dendrites area (stratum radiatum). The recording microelectrodes were made from borosiliacate glass capillaries with inner filaments enabling quick backfilling. The diameter of the tip of the microelectrode was 5.0 μm with a resistance of 1-5 MΩ when filled by ACSF. Each recorded trial was an average of 3 consecutive sweeps. Electrical signals were filtered at 1kHz and digitized at a frequency of 2.5 kHz using a Digidata 1320 interface (Molecular Devices). Data were stored on a desktop PC and analyzed off-line using pCLAMP 10 software (Molecular Devices). The initial slope of the field fEPSP was analyzed and expressed as a percentage to the basal level. Long-term potentiation (LTP) was induced by high-frequency stimulation (HFS, 100 Hz, 500 ms) delivered twice in a 20s interval at the same intensity as that employed in test pulses (low frequency, 0.05Hz). A 20 min control recording was carried out in each slice prior to HFS.
Analysis of glutamate concentrations
The glutamate levels in brain lysates of mice were determined by Amplex Red Glutamic acid/Glutamate oxidase Assay Kit (Invitrogen) based on the manufacturer's instruction. Brain tissue lysates were diluted to the same protein concentration before entering the assay.
Real-time RT-PCR
Real-time RT-PCR was carried out using the one-step quantitative TaqMan assay in a StepOne™ Real-Time PCR system (Thermo Fisher Scientific). Primers used for real-time RT-PCR include pre-made mouse TNF-α, IL-1β, and GFAP from Thermo Fisher Scientific and custom primers and probe for GAC (Huang et al., 2011). Relative gene expression levels were determined and standardized with a GAPDH endogenous control using comparative ΔΔCT method. For GAC transgene determination, the RNA samples were first reverse transcribed into DNA using Verso cDNA synthesis Kit (Thermo Fisher Scientific). The RT-PCR analyses of GAC transgene expression were performed using SYBR™ Select Master Mix (Thermo Fisher Scientific) with 0.5 μl of cDNA, corresponding to 1 μg of total RNA in a 15 μl final volume.
Statistical analysis
Data were analyzed as means ± SEM unless otherwise specified. The data were evaluated statistically by the analysis of variance (ANOVA) followed by Tukey-test for pairwise comparisons by using GraphPad Prism software. The Two-tailed Student's t test was used to compare two groups. Significance was considered when P < 0.05. All in vitro experiments were performed with at least three donors to account for any donor-specific differences. The exact sample size for in vivo experiments was provided in figure legends. For Figure 3G, correlation was determined by nonparametric Spearman correlation analysis through GraphPad Prism software.
Figure 3. Nes-GAC mice have learning and memory impairments.
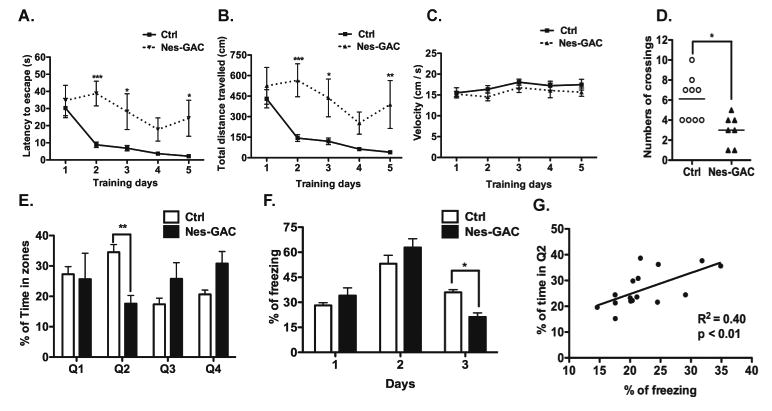
A-E). The Morris-Water-Maze test was utilized to examine the spatial learning and memory of Nes-GAC mice at the age of 8 to 12 weeks. During the training phase, Nes-GAC mice exhibited longer escape latency (A), travelled longer distance to reach the platform (B), but exhibited similar swimming velocities (C). During the probe test, Nes-GAC mice had fewer crossings of the target place (D) and spent less time in the target quadrant (E). F). The Cued-Fear-Conditioning test was utilized to examine explicit memory of Nes-GAC mice. G) Correlation of the MWM with CFC data was determined by Spearman correlation. Data are shown as the means ± SEM (N = 9 for control, N = 7 for Nes-GAC mice). * denotes P < 0.05, ** denotes P < 0.01, *** denotes P < 0.001, compared with littermate control mice.
Results
GAC overexpression in the Nes-GAC Tg mice
To determine the extent to which glutaminase overexpression impacts on neuronal functions, we used a transgenic approach to generated GAC Tg mice. The rationale for upregulating GAC isoform in the brains is based on our prior observation that GAC is specifically upregulated in HIV encephalitis brain tissues (Huang et al., 2011; Zhao et al., 2012). Direct quantitative comparison between KGA and GAC in the brain remains difficult because the antibodies or primers may have different detection kinetics and efficacies. In an attempt to visualize overall expression of KGA and GAC, we used RNA isolated from the cortex, cerebellum, and hippocampus of a pregnant rat, and also RNA isolated from the corresponding E17 rat brains and their derived neuronal and astrocyte cultures. GFAP, MAP2, KGA, and GAC gene expression levels in these samples were determined through real time RTPCR (Fig. S1). Overall, both KGA and GAC follow a neuronal (MAP2) expression pattern. However, their levels in astrocytes were also comparable to neurons and brain tissues, suggesting that both KGA and GAC are expressed in both neurons and astrocytes.
To overexpress GAC in the brain, we designed the transgene construct under a chicken β-actin (CAG) promoter. The GAC transgene is preceded with a stop codon flanked by loxP sites (Fig. 1A), enabling GAC to be specifically expressed in any cells that contain Cre recombinase activity. All of the CAG-LSL-GAC Tg founder line mice were fertile and on a FVB background. We crossed the founder line mice with Nestin-Cre mice (Vernay et al., 2005). The resulting lines of mice were viable and fertile with normal appearance. Mice that were positive for both GAC and Cre in PCR genotyping were termed Nes-GAC mice, whereas littermates that were negative for GAC and Cre served as wide-type (WT) controls (Fig. 1B, C). To confirm GAC protein overexpression, GAC levels in the whole brains and kidneys of both Nes-GAC mice and their control littermates were determined through Western blot. Levels of GAC were higher in Nes-GAC brains compared with littermate control brains (Fig. 1D, E). In contrast, GAC levels remained constant among Nes-GAC and control kidneys (Data not shown), suggesting that GAC overexpression is specific to the brain tissues. To test whether the overexpressed GAC increases its enzyme activity, we determined the tissue levels of glutamate, which is the product of GAC enzyme reaction. Tissue glutamate levels in the whole brains were elevated in Nes-GAC brains compared with littermate controls, which is consistent with the increase of GAC protein levels in the whole brains (Fig. 1F). In contrast, glutamate levels remained unchanged in kidney tissues, indicating that specific GAC overexpression in Nes-GAC brains indeed increased the enzymatic production of glutamate. Together, these results demonstrate that the overexpression of GAC is specific to the CNS in Nes-GAC mice.
Figure 1. GAC overexpression is specific to the brains of Nes-GAC mice.
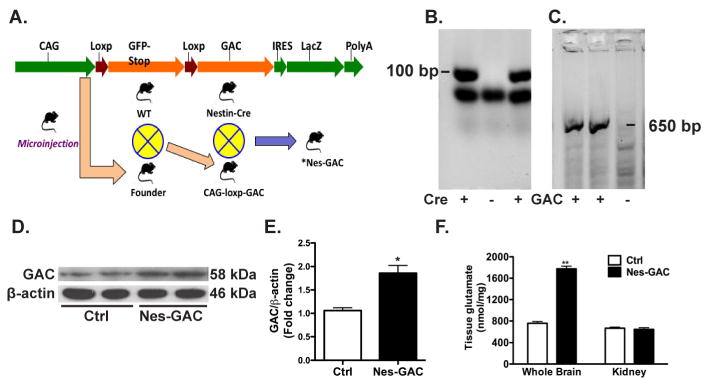
A). A detailed scheme of Nes-GAC mouse generation was shown. B, C). Cre (B) and Gac (C) were confirmed in mouse genotyping by PCR reactions. Size marks indicate the sizes of positive PCR products. D). Protein lysates were prepared from whole brains of 8-week old mice and the expression levels of GAC were determined by Western blot. E). Quantification data were normalized to β-actin and presented as fold changes compared to control mice. F). Brain tissue glutamate levels were determined using the Amplex Red Glutamic acid/Glutamate oxidase Assay Kit. Data are shown as the means ± SEM (N = 4 for Nes-GAC and N = 4 for control mice). * denotes P < 0.05, ** denotes P < 0.01 compared with littermate control mice.
GAC is overexpressed across different brain regions of Nes-GAC mice
To identify the specific brain regions of GAC overexpression, we first performed immunohistochemistry (IHC) using an antibody for glutaminase (Ye et al., 2013). In mouse and human brains, glutaminase expression follows a distinct pattern, with highest transcriptions found at the hippocampus and cortex (Botman et al., 2014; Hawrylycz et al., 2012; Lein et al., 2007; Najlerahim et al., 1990). The glutaminase protein levels in Nes-GAC mouse brains followed the same expression pattern and appeared brighter in fluorescence compared with littermate controls (Fig. 2A). Quantification of the fluorescence intensities revealed that Nes-GAC mouse brains had higher expression levels of glutaminase in hippocampi (Fig. 2B) and cortices (Fig. 2C). The GLS antibody used in the IHC detected both KGA and GAC. The GAC antibodies were not suitable for IHC but good for immunoblotting. Therefore, we prepared protein lysates from hippocampi, cortices, midbrains, and cerebella of Nes-GAC and littermate control mice and determined the expression levels of GAC through Western blot. Compared with WT control littermates, Nes-GAC mice had higher expression levels of GAC in hippocampal and cortical regions. In contrast, GAC levels were more variable in midbrain and cerebellar regions (Fig. 2D, E). Consistent with the increase of GAC protein levels in the hippocampus and cortex, tissue glutamate levels from hippocampus and cortex were also high (Fig.2F), indicating overexpressed GAC increases production of glutamate in the hippocampus and cortex of Nes-GAC mice. Together, these results confirm that GAC is overexpressed in at least two different brain regions of Nes-GAC mice.
Figure 2. GAC overexpression is confirmed in different areas of Nes-GAC mouse brain.
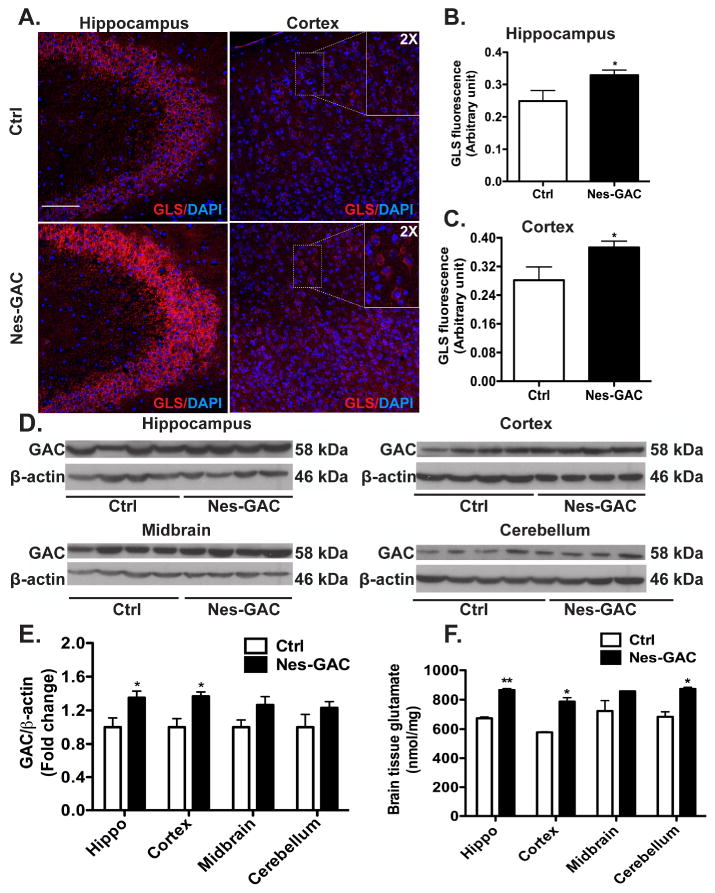
A-C). The expression levels of glutaminase in hippocampi and cortices were visualized by immunofluorescence. Representative pictures from the hippocampus and cortex are shown (A) along with high-magnification (2×) images of the corresponding small box area. Scale bar: 100 μm. The glutaminase fluorescence intensities in hippocampus (B) and cortex (C) were quantified. D). Protein lysates from different regions of the mouse brain were prepared, and the expression levels of GAC were determined by Western blot using the specific GAC antibody. β-actin levels were used as loading controls. E). Levels of GAC in (D) were normalized as a ratio to β-actin and shown as fold changes relative to littermate controls. F). Glutamate levels of the same protein lysates were tested using the Amplex Red Glutamic acid/Glutamate oxidase Assay Kit. Data are shown as the means ± SEM (N = 4 for either Nes-GAC or control mice). * denotes P < 0.05, ** denotes P < 0.01, *** denotes P < 0.001 compared with littermate control mice.
Nes-GAC mice have learning and memory impairments
Because the hippocampus is the brain region of the highest glutaminase expression in Nes-GAC mice, we first focused on the hippocampus to study the functional impact of the GAC overexpression. The Morris-Water-Maze (MWM) test was used to study the learning and memory of Nes-GAC mice and their control littermates at the age of 8-12 weeks. During the training phase of MWM test, Nes-GAC mice displayed longer escape latency (time spent to reach the escape platform) (Fig. 3A) and travelled a longer distance to escape to the platform (Fig. 3B), indicating that Nes-GAC mice had impaired capabilities in learning to escape from water. Nes-GAC mice had similar swimming velocities compared with those of control littermates (Fig. 3C), which excludes the possibility that the impairment of learning in Nes-GAC mice is due to deficits in motor functions. Consistent with the data on the training phase, Nes-GAC mice had significantly fewer times of crossing through the platform area (Fig. 3D), and spent significantly less time in the target quadrant (Q2, where the escape platform was during the training phase) compared with littermate controls during the probe test (Fig. 3E). These results indicate that Nes-GAC mice have deficits in spatial learning and memory. Next, The Cued-Contextual Fear Conditioning (CFC) test was applied to Nes-GAC mice and littermate controls to study their memory of cued contextual fear. Nes-GAC mice had a significant lower percentage of freezing compared with that of WT control littermates on the last day of CFC test (Fig. 3F), indicating that Nes-GAC mice have an impairment in learning fear. Notably, mouse performance in the MWM test was positively correlated with mouse performance in CFC test (Fig. 3G). Together, these results demonstrate that Nes-GAC mice have deficits in learning and memory related to hippocampal and cortical functions.
To further determine learning and memory deficits in Nes-GAC mice, we recorded LTP in the CA1 region of hippocampal slices, since LTP is a well-characterized cellular mechanism for learning and memory (Cooke and Bliss, 2006). HFS induced a robust LTP in hippocampal slices prepared from littermate control mice (Fig. 4A, B). In contrast, HFS failed to produce LTP in hippocampal slices prepared from Nes-GAC mice (Fig. 4A, B). These results are well in parallel with those observed in animal behavior studies demonstrating GAC overexpression leads to a marked impairment of learning and memory in experimental animals, suggesting that the learning impairment is accompanied by synaptic dysfunctions.
Figure 4. Nes-GAC mice have marked reduction in LTP.
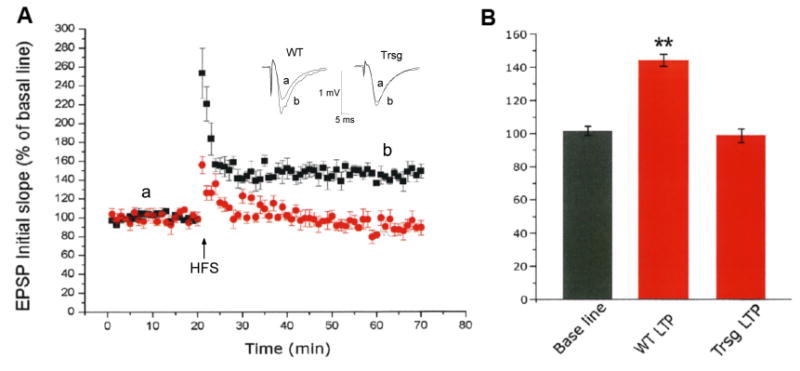
A-B). Hippocampi of Nes-GAC mice and littermate controls were recorded for LTP magnitude. Panel A illustrates the time course and average magnitude of LTP in the Schaffer-collateral to CA1 synapses recorded from control (black square) and Nes-GAC (red circle) mice. The graph plots the initial slope of the evoked EPSPs recorded from the CA1 dendrite field (stratum radium) in response to constant current stimuli. High frequency stimulation (HFS, 100 Hz, 500ms × 2) was delivered at 20min time point. Each point in this graph is an average of 10 slices. The inset in panel A illustrates representative individual field EPSP traces to correspond with recordings prior to, and following LTP induction. The EPSPs are superimposed, taken at different time points marked a and b from two different slices, with one from control animal (WT) and the other from transgenic animal (Trsg). Panel B is a summary bar graph showing a significant reduction of LTP recorded in Nes-GAC animals. ** denotes P < 0.01, compared with Nes-GAC mice.
GAC overexpression in the brain induces apoptosis and synaptic changes in mice
To identify whether there are any changes of the synapses that are associated with impaired synaptic transmission, we examined pre-synapse marker synaptophysin and neuronal marker MAP-2 in the mouse brains. The protein levels of synaptophysin but not the MAP-2 were dramatically decreased in the hippocampal (Fig. 5A, B) and cortical (Fig. 5C, D) lysates of Nes-GAC mouse brains compared to those of control littermates. The specific loss of synaptophysin indicates a synaptic change in the Nes-GAC mouse brains that may contribute to the impaired synaptic transmission. To determine the molecular mechanism of the loss of synaptic density, we investigated the possible involvement of apoptosis. Activation of caspases through protease cleavage plays a central role in the execution of apoptosis. We found that active forms of cleaved-Caspase 3 were dramatically increased in the hippocampal (Fig. 5A, B) and cortical (Fig. 5C, D) lysates of Nes-GAC mice compared to those of control littermates. Together, these data suggest that overexpression of GAC in the brain induces synaptic changes and apoptosis in the mouse CNS.
Figure 5. GAC overexpression leads to apoptosis and synaptic changes in mice.
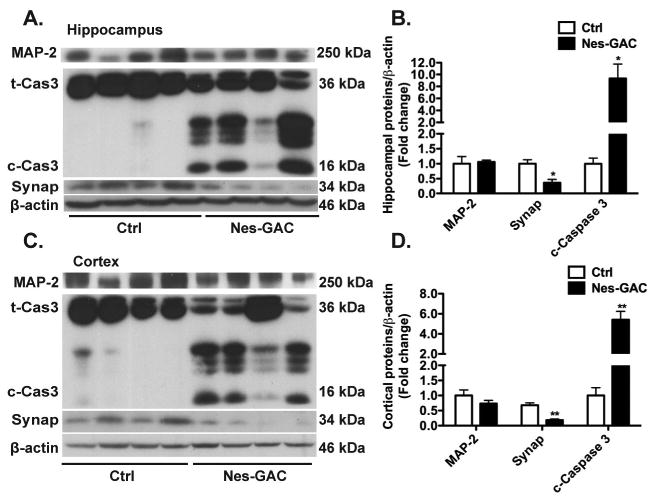
A). Expression levels of neuronal marker microtubule-associated protein 2 (MAP-2), cleaved Caspase 3 (c-Cas3), and synaptic marker Synaptophysin (Synap) in hippocampus were determined by Western blot. β-actin levels were used as loading controls. B) Levels of MAP-2, c-Cas3, and Synap in (A) were normalized as a ratio to β-actin and shown as fold change relative to littermate controls. C). Expression levels of MAP-2, c-Cas3, Synap, and β-actin in cortex were determined by Western blot. D) Levels of MAP-2, c-Cas3, and Synap in (C) were normalized as a ratio to β-actin and shown as fold change relative to littermate controls. Data are shown as means ± SEM (N = 4 for either Nes-GAC or control mice). * denotes P < 0.05, ** denotes P < 0.01, compared with littermate control mice.
GAC overexpression induces glial activation in mouse brains
Cellular apoptosis in the CNS is often associated with considerable neuroinflammation. To identify whether there is any neuroinflammation in Nes-GAC mice, we investigated the expression levels of the glial fibrillary acidic protein (GFAP), which is an astrocyte marker often used to indicate glial reaction. GFAP protein levels trended upward in the hippocampal and cortical lysates of Nes-GAC mice compared with those of control littermates (Fig. 6A, B). Furthermore, immunofluorescent examination of GFAP and Iba1 in the Nes-GAC mouse brain revealed a marked increase of astrocyte hypertrophy and proliferation, as well as microglia activation compared with littermate controls (Fig. 6C-E). Together, these results suggest glial activation in the Nes-GAC mouse brains that is consistent with a neuroinflammation phenotype.
Figure 6. GAC overexpression leads to glial activation in mice.
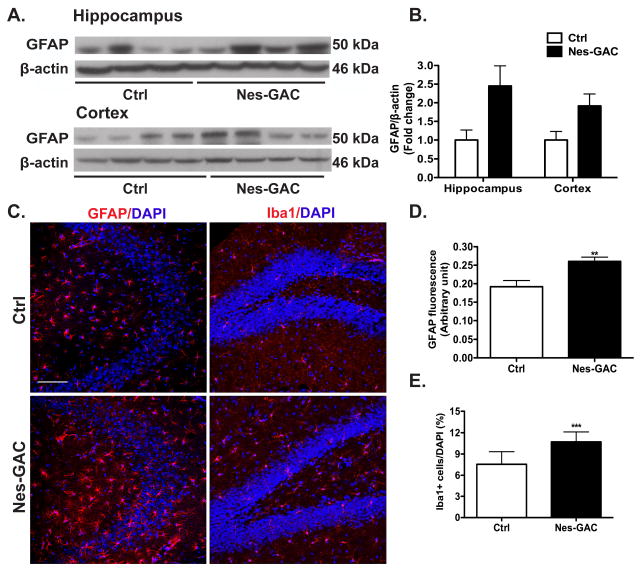
A). Protein lysates were prepared from the hippocampus and cortex of Nes-GAC and littermate control mice. Expression levels of astrocyte marker GFAP were analyzed by Western blot. β-actin levels were used as loading controls. B) Levels of GFAP in the Western blot were normalized as a ratio to β-actin and shown as fold change relative to littermate controls. C). The expressions of GFAP and Iba1 in the mouse hippocampus were visualized by GFAP and Iba1 immunofluorescence. Representative pictures are shown. Scale bar: 100 μm. D-E). Fluorescence intensities of GFAP and number of Iba1-possitve cells were quantified and shown as the means ± SEM (three brain slices from each of the four Nes-GAC mouse brains and littermate controls). ** denotes P < 0.01, *** denotes P < 0.001, compared with control mice, N = 4.
Learning and memory impairments and neuroinflammation in older NesGAC mice
Next, we performed MWM and gene expression analysis of older (9-month old) Nes-GAC mice to determine if leaning deficits persisted in these mice. During the training phase, Nes-GAC mice displayed longer escape latency (Fig. 7A), indicating that Nes-GAC mice had impaired capabilities in learning to escape from water. Consistent with the data on the training phase, Nes-GAC mice spent significantly less time in the target quadrant compared with littermate controls during the probe test (Fig. 7B). When this set of mice were euthanized, gene expression analysis revealed significant expression of the GAC transgene (Fig. 7C), along with a higher total GAC expression compared with littermate controls (Fig. 7D). Consistent with the increase of GAC protein levels, glutamate levels from hippocampus and cortex were also higher (Fig.7E). To confirm whether neuroinflammation persisted in these older Nes-GAC mice, we determined TNF-α (Fig. 7F), IL-1β (Fig. 7G), and GFAP (Fig. 7H) and found all of these gene significantly increased with the exception of IL-1β levels in the cortex.
Figure 7. Nes-GAC mice have learning impairments and neuroinflammation at 9-month old.
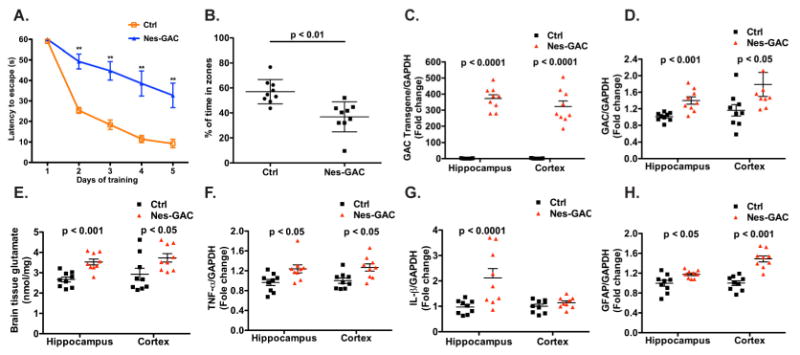
A-B). The MWM test was again utilized to examine the spatial learning and memory of Nes-GAC mice at the age of 9 months. Escape latency during the training phase (A) and percentages of time spent in the target quadrant during the probe test (B) were determined similarly with 8- to 12-week-old mice as previously described. C-H). At the experimental endpoint, all mice were euthanized and hippocampi and cerebral cortices were dissected and total RNA was extracted. Gene expressions of GAC transgene (C), total GAC (D), TNF-α (F), IL-1β (G), and GFAP (H) were determined through real time RT-PCR. Data were normalized to GAPDH and presented as fold change compared to littermate controls. E). Brain tissue glutamate levels were determined through hippocampus and cortex brain lysates using the Amplex Red Glutamic acid/Glutamate oxidase Assay Kit.
Discussion
As a rate-limiting enzyme of glutaminolysis, glutaminase asserts control over metabolic states of cells, including cells in the CNS. It is previously unknown whether a metabolic change such as glutaminase upregulation will have collateral damage to the residential cells in the brain given the excitotoxic potential of excess glutamate. In the current studies, we generated a GAC Tg mouse model. Characterization of the mouse model revealed that GAC overexpression leads to learning and memory impairments, decreased hippocampal LTP and synaptic densities, increased apoptosis, as well as increased neuroinflammation in the brains. The genetic model may provide a novel tool to assess the consequences of excess production of glutamate on brain function.
The identification of the pathogenic role of GAC in synaptic and neuronal injury in vivo may have an important clinical implication. Glutaminase dysregulation has been implicated in various neurodegenerative and neuroinflammatory diseases such as HIV-1 associated dementia, multiple sclerosis, amyotrophic lateral sclerosis, and Alzheimer's disease (Burbaeva et al., 2014; D'Alessandro et al., 2011; Huang et al., 2011; Werner et al., 2001; Zhao et al., 2012), as well as neuropsychiatric diseases such as schizophrenia (Gluck et al., 2002). Our model is useful in that it provides a novel tool to assess the consequences of excess production of glutamate on brain function and the model may be used to test novel therapeutic strategies to alleviate excitotoxicity. However, potential mechanism as to how elevated GAC levels can promote these observed phenotypes in Nes-GAC mice remains unsolved. Therefore, care should be taken in interpreting the relevance of this model to any human disease or neuropathology.
Our design of Tg construct enables the GAC overexpression to be confined in the nestin promoter-derived cells. In the brain, neurons, astrocytes, and oligodendrocytes are all derived from nestin-positive cells. Therefore, it is possible that one or more cell type-specific overexpression of GAC contributes to the impairments of learning and memory, the synaptic dysfunctions, and neuroinflammation. Our IHC and gene expression analysis suggests that both KGA and GAC expressions follow a neuronal pattern in the CNS. It is likely that overexpression of GAC in neurons causes the CNS phenotype. However, it is also possible that overexpression of GAC in astrocytes, which also express comparable levels of GAC, causes the changes. The relationship of each individual CNS cell type, GAC overexpression, and the cognitive, synaptic, and immune changes merits further investigations. A cell type-specific glutaminase overexpression may allow for temporal and spatial control of the GAC transgene expression and help unravel this relationship.
The hippocampal-cortical synaptic network is essential for proper cognitive functions such as learning and memory (Alvarez et al., 2001; Clark et al., 2002; Frey and Morris, 1997, 1998; Kingwell, 2011; Lesburgueres et al., 2011; Ross and Eichenbaum, 2006; Sweatt, 2011; Yeckel and Berger, 1998). Because of its crucial role in memory, hippocampal and hippocampal-cortical signaling has been extensively studied (Delint-Ramirez et al., 2008; Kobayashi et al., 2005; Magnusson et al., 2007; Nakashiba et al., 2008; O'Mara et al., 2000; Rolls, 2000; Song et al., 2007; Yeckel and Berger, 1998; Zelcer et al., 2006; Zhang et al., 2008; Zhao et al., 2005). Glutamate is well known to affect synaptic plasticity (Brim et al., 2013; Delint-Ramirez et al., 2008; Magnusson et al., 2007; Manahan-Vaughan and Braunewell, 2005; Naie and Manahan-Vaughan, 2004; Yeckel and Berger, 1998). Specifically, memory loss due to aging or disease has been associated with disruption of NMDA receptor-mediated neurotransmission (Brim et al., 2013; Delint-Ramirez et al., 2008; Magnusson et al., 2007). Because the reaction of deamination of glutamine to glutamate is energetically favorable, the expression and function of glutaminase need to be tightly regulated. Indeed, our previous studies revealed many STAT1 binding sites on the glutaminase promoter that exert predominantly inhibitory effects on the promoter (Zhao et al., 2012; Zhao et al., 2013). These data are consistent with existing literature of a negative post-transcriptional regulation of glutaminase activities (Gao et al., 2009; Laterza and Curthoys, 2000).
Glutamate transporters are important for glutamate uptake and homeostasis (Tzingounis and Wadiche, 2007). Therefore, they serve as a critical buffer against excitotoxicity in the brain. Our current Nes-GAC mice had GAC overexpression spanning from embryonic to post-natal development. It is unclear whether there are any compensatory mechanisms such as glutamate transporters that are at work in these mice. Previous studies employed deregulation or loss of function of glutamate transporters EAAT1 and EAAT2 located on astrocytes, which led to neural inflammation and cell death similar to our Tg mice (Blasco et al., 2014; Masliah et al., 1996).
Taken together, this study suggests that glutaminase overexpression is sufficient to induce both structure and functional changes in the brain. Investigations on glutaminase gene regulation and functional changes during CNS disease pathogenesis my help identify novel therapeutic targets.
Supplementary Material
Highlights.
We generated a novel transgenic mouse model to overexpress glutaminase in the brain. The glutaminase transgenic mice have profound learning deficits and synaptic dysfunctions. Glutaminase overexpression in the brain leads to neuroinflammation.
Acknowledgments
We kindly thank Dr. Hui Peng, Dr. Tomomi Kiyota, Dr. Larisa Poluektova, Dr. Howard Gendelman, Dr. Santhi Gorantla and Ms. Li Wu for the technical support of this work. We thank Lenal Bottoms and Dr. Matthew Mitchell for reviewing the manuscript. We thank Janice A. Taylor and James R. Talaska of the Advanced Microscopy Core Facility for providing assistance with confocal microscopy. Support for the UNMC Advanced Microscopy Core Facility was provided by the Nebraska Research Initiative, the Fred and Pamela Buffett Cancer Center Support Grant (P30CA036727), an Institutional Development Award (IDeA) from the NIGMS of the NIH (P30GM106397), and NIH S10RR027301 for the LSM 710 Zeiss Confocal Microscope. This work was supported by grants from National Key Basic Research Program of China (973Program Grant No. 2014CB965000, project 1 No. 2014CB965001 and project 3No. 2014CB965003) and Innovative Research Groups of the National Natural Science Foundation of China (#81221001 to JZ), and Joint Research Fund for Overseas Chinese, Hong Kong and Macao Young Scientists of the National Natural Science Foundation of China (#81329002 to JZ); National Institutes of Health: 2R56NS041858-15A1 (JZ), 1R01NS097195-01 (JZ), 5R01NS063878-05 (HX), and R03 NS094071-01 (YH).
Abbreviation
- CFC
Contextual Fear Conditioning
- CNS
central nervous system
- GLS
glutaminase
- GAC
glutaminase C
- HAND
HIV-1-associated neurocognitive disorders
- IHC
immunohistochemistry
- KGA
kidney-type glutaminase
- LTP
long-term potentiation
- MWM
Morris Water Maze
- RT-PCR
Reverse transcription polymerase chain reaction
- Tg
Transgenic
- WT
wide-type
Footnotes
Authors' contributions: YW, YL, YH and JZ: conception and design, data analysis and interpretation, writing and final approval of the manuscript; BW, BL, RZ, ZT, JP, JL, and HX: participation in the design, data collection, provision of study material, data analysis and interpretation of the studies. All authors read and approved the final manuscript.
Author disclosure statement: No competing financial interests exist with the submitted manuscript.
Publisher's Disclaimer: This is a PDF file of an unedited manuscript that has been accepted for publication. As a service to our customers we are providing this early version of the manuscript. The manuscript will undergo copyediting, typesetting, and review of the resulting proof before it is published in its final citable form. Please note that during the production process errors may be discovered which could affect the content, and all legal disclaimers that apply to the journal pertain.
References
- Alvarez P, Lipton PA, Melrose R, Eichenbaum H. Differential effects of damage within the hippocampal region on memory for a natural, nonspatial Odor-Odor Association. Learn Mem. 2001;8:79–86. doi: 10.1101/lm.38201. [DOI] [PMC free article] [PubMed] [Google Scholar]
- Anderson ER, Boyle J, Zink WE, Persidsky Y, Gendelman HE, Xiong H. Hippocampal synaptic dysfunction in a murine model of human immunodeficiency virus type 1 encephalitis. Neuroscience. 2003;118:359–369. doi: 10.1016/s0306-4522(02)00925-9. [DOI] [PubMed] [Google Scholar]
- Anderson ER, Gendelman HE, Xiong H. Memantine protects hippocampal neuronal function in murine human immunodeficiency virus type 1 encephalitis. The Journal of neuroscience: the official journal of the Society for Neuroscience. 2004;24:7194–7198. doi: 10.1523/JNEUROSCI.1933-04.2004. [DOI] [PMC free article] [PubMed] [Google Scholar]
- Baglietto-Vargas D, Lopez-Tellez JF, Moreno-Gonzalez I, Gutierrez A, Aledo JC. Segregation of two glutaminase isoforms in islets of Langerhans. Biochem J. 2004;381:483–487. doi: 10.1042/BJ20040523. [DOI] [PMC free article] [PubMed] [Google Scholar]
- Benveniste H. Glutamate, microdialysis, and cerebral ischemia: lost in translation? Anesthesiology. 2009;110:422–425. doi: 10.1097/ALN.0b013e318194b620. [DOI] [PubMed] [Google Scholar]
- Blasco H, Mavel S, Corcia P, Gordon PH. The glutamate hypothesis in ALS: pathophysiology and drug development. Curr Med Chem. 2014;21:3551–3575. doi: 10.2174/0929867321666140916120118. [DOI] [PubMed] [Google Scholar]
- Botman D, Tigchelaar W, Van Noorden CJ. Determination of phosphate-activated glutaminase activity and its kinetics in mouse tissues using metabolic mapping (quantitative enzyme histochemistry) J Histochem Cytochem. 2014;62:813–826. doi: 10.1369/0022155414551177. [DOI] [PMC free article] [PubMed] [Google Scholar]
- Brim BL, Haskell R, Awedikian R, Ellinwood NM, Jin L, Kumar A, Foster TC, Magnusson KR. Memory in aged mice is rescued by enhanced expression of the GluN2B subunit of the NMDA receptor. Behavioural brain research. 2013;238:211–226. doi: 10.1016/j.bbr.2012.10.026. [DOI] [PMC free article] [PubMed] [Google Scholar]
- Burbaeva G, Boksha IS, Tereshkina EB, Savushkina OK, Prokhorova TA, Vorobyeva EA. Glutamate and GABA-metabolizing enzymes in post-mortem cerebellum in Alzheimer's disease: phosphate-activated glutaminase and glutamic acid decarboxylase. Cerebellum. 2014;13:607–615. doi: 10.1007/s12311-014-0573-4. [DOI] [PubMed] [Google Scholar]
- Clark RE, Broadbent NJ, Zola SM, Squire LR. Anterograde amnesia and temporally graded retrograde amnesia for a nonspatial memory task after lesions of hippocampus and subiculum. The Journal of neuroscience: the official journal of the Society for Neuroscience. 2002;22:4663–4669. doi: 10.1523/JNEUROSCI.22-11-04663.2002. [DOI] [PMC free article] [PubMed] [Google Scholar]
- Cooke SF, Bliss TV. Plasticity in the human central nervous system. Brain: a journal of neurology. 2006;129:1659–1673. doi: 10.1093/brain/awl082. [DOI] [PubMed] [Google Scholar]
- D'Alessandro G, Calcagno E, Tartari S, Rizzardini M, Invernizzi RW, Cantoni L. Glutamate and glutathione interplay in a motor neuronal model of amyotrophic lateral sclerosis reveals altered energy metabolism. Neurobiology of disease. 2011;43:346–355. doi: 10.1016/j.nbd.2011.04.003. [DOI] [PubMed] [Google Scholar]
- Delint-Ramirez I, Salcedo-Tello P, Bermudez-Rattoni F. Spatial memory formation induces recruitment of NMDA receptor and PSD-95 to synaptic lipid rafts. Journal of neurochemistry. 2008;106:1658–1668. doi: 10.1111/j.1471-4159.2008.05523.x. [DOI] [PubMed] [Google Scholar]
- Erdmann N, Whitney N, Zheng J. Potentiation of excitotoxicity in HIV-1-associated dementia and the significance of glutaminase. Clin Neurosci Res. 2006;6:315–328. doi: 10.1016/j.cnr.2006.09.009. [DOI] [PMC free article] [PubMed] [Google Scholar]
- Frey U, Morris RG. Synaptic tagging and long-term potentiation. Nature. 1997;385:533–536. doi: 10.1038/385533a0. [DOI] [PubMed] [Google Scholar]
- Frey U, Morris RG. Synaptic tagging: implications for late maintenance of hippocampal long-term potentiation. Trends in neurosciences. 1998;21:181–188. doi: 10.1016/s0166-2236(97)01189-2. [DOI] [PubMed] [Google Scholar]
- Gaisler-Salomon I, Miller GM, Chuhma N, Lee S, Zhang H, Ghoddoussi F, Lewandowski N, Fairhurst S, Wang Y, Conjard-Duplany A, Masson J, Balsam P, Hen R, Arancio O, Galloway MP, Moore HM, Small SA, Rayport S. Glutaminase-deficient mice display hippocampal hypoactivity, insensitivity to pro-psychotic drugs and potentiated latent inhibition: relevance to schizophrenia. Neuropsychopharmacology. 2009;34:2305–2322. doi: 10.1038/npp.2009.58. [DOI] [PMC free article] [PubMed] [Google Scholar]
- Gao P, Tchernyshyov I, Chang TC, Lee YS, Kita K, Ochi T, Zeller KI, De Marzo AM, Van Eyk JE, Mendell JT, Dang CV. c-Myc suppression of miR-23a/b enhances mitochondrial glutaminase expression and glutamine metabolism. Nature. 2009;458:762–765. doi: 10.1038/nature07823. [DOI] [PMC free article] [PubMed] [Google Scholar]
- Gegelashvili G, Schousboe A. Cellular distribution and kinetic properties of high-affinity glutamate transporters. Brain Res Bull. 1998;45:233–238. doi: 10.1016/s0361-9230(97)00417-6. [DOI] [PubMed] [Google Scholar]
- Gluck MR, Thomas RG, Davis KL, Haroutunian V. Implications for altered glutamate and GABA metabolism in the dorsolateral prefrontal cortex of aged schizophrenic patients. Am J Psychiatry. 2002;159:1165–1173. doi: 10.1176/appi.ajp.159.7.1165. [DOI] [PubMed] [Google Scholar]
- Hawrylycz MJ, Lein ES, Guillozet-Bongaarts AL, Shen EH, Ng L, Miller JA, van de Lagemaat LN, Smith KA, Ebbert A, Riley ZL, Abajian C, Beckmann CF, Bernard A, Bertagnolli D, Boe AF, Cartagena PM, Chakravarty MM, Chapin M, Chong J, Dalley RA, Daly BD, Dang C, Datta S, Dee N, Dolbeare TA, Faber V, Feng D, Fowler DR, Goldy J, Gregor BW, Haradon Z, Haynor DR, Hohmann JG, Horvath S, Howard RE, Jeromin A, Jochim JM, Kinnunen M, Lau C, Lazarz ET, Lee C, Lemon TA, Li L, Li Y, Morris JA, Overly CC, Parker PD, Parry SE, Reding M, Royall JJ, Schulkin J, Sequeira PA, Slaughterbeck CR, Smith SC, Sodt AJ, Sunkin SM, Swanson BE, Vawter MP, Williams D, Wohnoutka P, Zielke HR, Geschwind DH, Hof PR, Smith SM, Koch C, Grant SG, Jones AR. An anatomically comprehensive atlas of the adult human brain transcriptome. Nature. 2012;489:391–399. doi: 10.1038/nature11405. [DOI] [PMC free article] [PubMed] [Google Scholar]
- Hoffman EM, Zhang Z, Schechter R, Miller KE. Glutaminase Increases in Rat Dorsal Root Ganglion Neurons after Unilateral Adjuvant-Induced Hind Paw Inflammation. Biomolecules. 2016;6:10. doi: 10.3390/biom6010010. [DOI] [PMC free article] [PubMed] [Google Scholar]
- Huang Y, Zhao L, Jia B, Wu L, Li Y, Curthoys N, Zheng JC. Glutaminase dysregulation in HIV-1-infected human microglia mediates neurotoxicity: relevant to HIV-1-associated neurocognitive disorders. The Journal of neuroscience: the official journal of the Society for Neuroscience. 2011;31:15195–15204. doi: 10.1523/JNEUROSCI.2051-11.2011. [DOI] [PMC free article] [PubMed] [Google Scholar]
- Kanellopoulos GK, Xu XM, Hsu CY, Lu X, Sundt TM, Kouchoukos NT. White matter injury in spinal cord ischemia: protection by AMPA/kainate glutamate receptor antagonism. Stroke; a journal of cerebral circulation. 2000;31:1945–1952. doi: 10.1161/01.str.31.8.1945. [DOI] [PubMed] [Google Scholar]
- Killestein J, Kalkers NF, Polman CH. Glutamate inhibition in MS: the neuroprotective properties of riluzole. J Neurol Sci. 2005;233:113–115. doi: 10.1016/j.jns.2005.03.011. [DOI] [PubMed] [Google Scholar]
- Kingwell K. Memory: Tagging in the cortex. Nature reviews. Neuroscience. 2011;12:188. doi: 10.1038/nrn3019. [DOI] [PubMed] [Google Scholar]
- Kobayashi M, Masaki T, Hori K, Masuo Y, Miyamoto M, Tsubokawa H, Noguchi H, Nomura M, Takamatsu K. Hippocalcin-deficient mice display a defect in cAMP response element-binding protein activation associated with impaired spatial and associative memory. Neuroscience. 2005;133:471–484. doi: 10.1016/j.neuroscience.2005.02.034. [DOI] [PubMed] [Google Scholar]
- Komuro H, Rakic P. Intracellular Ca2+ fluctuations modulate the rate of neuronal migration. Neuron. 1996;17:275–285. doi: 10.1016/s0896-6273(00)80159-2. [DOI] [PubMed] [Google Scholar]
- Kvamme E, Torgner IA, Roberg B. Kinetics and localization of brain phosphate activated glutaminase. J Neurosci Res. 2001;66:951–958. doi: 10.1002/jnr.10041. [DOI] [PubMed] [Google Scholar]
- Laterza OF, Curthoys NP. Specificity and functional analysis of the pH-responsive element within renal glutaminase mRNA. Am J Physiol Renal Physiol. 2000;278:F970–977. doi: 10.1152/ajprenal.2000.278.6.F970. [DOI] [PubMed] [Google Scholar]
- Lein ES, Hawrylycz MJ, Ao N, Ayres M, Bensinger A, Bernard A, Boe AF, Boguski MS, Brockway KS, Byrnes EJ, Chen L, Chen L, Chen TM, Chin MC, Chong J, Crook BE, Czaplinska A, Dang CN, Datta S, Dee NR, Desaki AL, Desta T, Diep E, Dolbeare TA, Donelan MJ, Dong HW, Dougherty JG, Duncan BJ, Ebbert AJ, Eichele G, Estin LK, Faber C, Facer BA, Fields R, Fischer SR, Fliss TP, Frensley C, Gates SN, Glattfelder KJ, Halverson KR, Hart MR, Hohmann JG, Howell MP, Jeung DP, Johnson RA, Karr PT, Kawal R, Kidney JM, Knapik RH, Kuan CL, Lake JH, Laramee AR, Larsen KD, Lau C, Lemon TA, Liang AJ, Liu Y, Luong LT, Michaels J, Morgan JJ, Morgan RJ, Mortrud MT, Mosqueda NF, Ng LL, Ng R, Orta GJ, Overly CC, Pak TH, Parry SE, Pathak SD, Pearson OC, Puchalski RB, Riley ZL, Rockett HR, Rowland SA, Royall JJ, Ruiz MJ, Sarno NR, Schaffnit K, Shapovalova NV, Sivisay T, Slaughterbeck CR, Smith SC, Smith KA, Smith BI, Sodt AJ, Stewart NN, Stumpf KR, Sunkin SM, Sutram M, Tam A, Teemer CD, Thaller C, Thompson CL, Varnam LR, Visel A, Whitlock RM, Wohnoutka PE, Wolkey CK, Wong VY, Wood M, Yaylaoglu MB, Young RC, Youngstrom BL, Yuan XF, Zhang B, Zwingman TA, Jones AR. Genome-wide atlas of gene expression in the adult mouse brain. Nature. 2007;445:168–176. doi: 10.1038/nature05453. [DOI] [PubMed] [Google Scholar]
- Lesburgueres E, Gobbo OL, Alaux-Cantin S, Hambucken A, Trifilieff P, Bontempi B. Early tagging of cortical networks is required for the formation of enduring associative memory. Science. 2011;331:924–928. doi: 10.1126/science.1196164. [DOI] [PubMed] [Google Scholar]
- Liang J, Takeuchi H, Doi Y, Kawanokuchi J, Sonobe Y, Jin S, Yawata I, Li H, Yasuoka S, Mizuno T, Suzumura A. Excitatory amino acid transporter expression by astrocytes is neuroprotective against microglial excitotoxicity. Brain research. 2008;1210:11–19. doi: 10.1016/j.brainres.2008.03.012. [DOI] [PubMed] [Google Scholar]
- Liu F, Huang Y, Zhang F, Chen Q, Wu B, Rui W, Zheng JC, Ding W. Macrophages treated with particulate matter PM2.5 induce selective neurotoxicity through glutaminase-mediated glutamate generation. Journal of neurochemistry. 2015;134:315–326. doi: 10.1111/jnc.13135. [DOI] [PMC free article] [PubMed] [Google Scholar]
- LoTurco JJ, Blanton MG, Kriegstein AR. Initial expression and endogenous activation of NMDA channels in early neocortical development. The Journal of neuroscience: the official journal of the Society for Neuroscience. 1991;11:792–799. doi: 10.1523/JNEUROSCI.11-03-00792.1991. [DOI] [PMC free article] [PubMed] [Google Scholar]
- Magnusson KR, Scruggs B, Zhao X, Hammersmark R. Age-related declines in a two-day reference memory task are associated with changes in NMDA receptor subunits in mice. BMC Neurosci. 2007;8:43. doi: 10.1186/1471-2202-8-43. [DOI] [PMC free article] [PubMed] [Google Scholar]
- Manahan-Vaughan D, Braunewell KH. The metabotropic glutamate receptor, mGluR5, is a key determinant of good and bad spatial learning performance and hippocampal synaptic plasticity. Cereb Cortex. 2005;15:1703–1713. doi: 10.1093/cercor/bhi047. [DOI] [PubMed] [Google Scholar]
- Masliah E, Alford M, DeTeresa R, Mallory M, Hansen L. Deficient glutamate transport is associated with neurodegeneration in Alzheimer's disease. Annals of neurology. 1996;40:759–766. doi: 10.1002/ana.410400512. [DOI] [PubMed] [Google Scholar]
- McEntee WJ, Crook TH. Glutamate: its role in learning, memory, and the aging brain. Psychopharmacology (Berl) 1993;111:391–401. doi: 10.1007/BF02253527. [DOI] [PubMed] [Google Scholar]
- Naie K, Manahan-Vaughan D. Regulation by metabotropic glutamate receptor 5 of LTP in the dentate gyrus of freely moving rats: relevance for learning and memory formation. Cereb Cortex. 2004;14:189–198. doi: 10.1093/cercor/bhg118. [DOI] [PubMed] [Google Scholar]
- Najlerahim A, Harrison PJ, Barton AJ, Heffernan J, Pearson RC. Distribution of messenger RNAs encoding the enzymes glutaminase, aspartate aminotransferase and glutamic acid decarboxylase in rat brain. Brain Res Mol Brain Res. 1990;7:317–333. doi: 10.1016/0169-328x(90)90082-o. [DOI] [PubMed] [Google Scholar]
- Nakashiba T, Young JZ, McHugh TJ, Buhl DL, Tonegawa S. Transgenic inhibition of synaptic transmission reveals role of CA3 output in hippocampal learning. Science. 2008;319:1260–1264. doi: 10.1126/science.1151120. [DOI] [PubMed] [Google Scholar]
- O'Mara SM, Commins S, Anderson M. Synaptic plasticity in the hippocampal area CA1-subiculum projection: implications for theories of memory. Hippocampus. 2000;10:447–456. doi: 10.1002/1098-1063(2000)10:4<447::AID-HIPO11>3.0.CO;2-2. [DOI] [PubMed] [Google Scholar]
- Peng H, Huang Y, Rose J, Erichsen D, Herek S, Fujii N, Tamamura H, Zheng J. Stromal cell-derived factor 1 mediated CXCR4 signaling in rat and human cortical neural progenitor cells. Journal of Neuroscience Research. 2004;76:35–50. doi: 10.1002/jnr.20045. [DOI] [PubMed] [Google Scholar]
- Porter LD, Ibrahim H, Taylor L, Curthoys NP. Complexity and species variation of the kidney-type glutaminase gene. Physiol Genomics. 2002;9:157–166. doi: 10.1152/physiolgenomics.00017.2002. [DOI] [PubMed] [Google Scholar]
- Rao VL, Baskaya MK, Dogan A, Rothstein JD, Dempsey RJ. Traumatic brain injury down-regulates glial glutamate transporter (GLT-1 and GLAST) proteins in rat brain. Journal of neurochemistry. 1998;70:2020–2027. doi: 10.1046/j.1471-4159.1998.70052020.x. [DOI] [PubMed] [Google Scholar]
- Rolls ET. Hippocampo-cortical and cortico-cortical backprojections. Hippocampus. 2000;10:380–388. doi: 10.1002/1098-1063(2000)10:4<380::AID-HIPO4>3.0.CO;2-0. [DOI] [PubMed] [Google Scholar]
- Rose CF, Verkhratsky A, Parpura V. Astrocyte glutamine synthetase: pivotal in health and disease. Biochem Soc Trans. 2013;41:1518–1524. doi: 10.1042/BST20130237. [DOI] [PubMed] [Google Scholar]
- Ross RS, Eichenbaum H. Dynamics of hippocampal and cortical activation during consolidation of a nonspatial memory. The Journal of neuroscience: the official journal of the Society for Neuroscience. 2006;26:4852–4859. doi: 10.1523/JNEUROSCI.0659-06.2006. [DOI] [PMC free article] [PubMed] [Google Scholar]
- Song D, Chan RH, Marmarelis VZ, Hampson RE, Deadwyler SA, Berger TW. Nonlinear dynamic modeling of spike train transformations for hippocampal-cortical prostheses. IEEE Trans Biomed Eng. 2007;54:1053–1066. doi: 10.1109/TBME.2007.891948. [DOI] [PubMed] [Google Scholar]
- Sulkowski G, Dabrowska-Bouta B, Salinska E, Struzynska L. Modulation of glutamate transport and receptor binding by glutamate receptor antagonists in EAE rat brain. PloS one. 2014;9:e113954. doi: 10.1371/journal.pone.0113954. [DOI] [PMC free article] [PubMed] [Google Scholar]
- Sweatt JD. Neuroscience. Creating stable memories. Science. 2011;331:869–870. doi: 10.1126/science.1202283. [DOI] [PubMed] [Google Scholar]
- Tian C, Sun L, Jia B, Ma K, Curthoys N, Ding J, Zheng J. Mitochondrial glutaminase release contributes to glutamate-mediated neurotoxicity during human immunodeficiency virus-1 infection. Journal of Neuroimmune Pharmacology. 2012;7:619–628. doi: 10.1007/s11481-012-9364-1. [DOI] [PMC free article] [PubMed] [Google Scholar]
- Tzingounis AV, Wadiche JI. Glutamate transporters: confining runaway excitation by shaping synaptic transmission. Nature reviews. Neuroscience. 2007;8:935–947. doi: 10.1038/nrn2274. [DOI] [PubMed] [Google Scholar]
- Vernay B, Koch M, Vaccarino F, Briscoe J, Simeone A, Kageyama R, Ang SL. Otx2 regulates subtype specification and neurogenesis in the midbrain. The Journal of neuroscience: the official journal of the Society for Neuroscience. 2005;25:4856–4867. doi: 10.1523/JNEUROSCI.5158-04.2005. [DOI] [PMC free article] [PubMed] [Google Scholar]
- Werner P, Pitt D, Raine CS. Multiple sclerosis: altered glutamate homeostasis in lesions correlates with oligodendrocyte and axonal damage. Annals of neurology. 2001;50:169–180. doi: 10.1002/ana.1077. [DOI] [PubMed] [Google Scholar]
- Wu B, Huang Y, Braun AL, Tong Z, Zhao R, Li Y, Liu F, Zheng JC. Glutaminase-containing microvesicles from HIV-1-infected macrophages and immune-activated microglia induce neurotoxicity. Mol Neurodegener. 2015;10:61. doi: 10.1186/s13024-015-0058-z. [DOI] [PMC free article] [PubMed] [Google Scholar]
- Xu GY, Hughes MG, Ye Z, Hulsebosch CE, McAdoo DJ. Concentrations of glutamate released following spinal cord injury kill oligodendrocytes in the spinal cord. Experimental neurology. 2004;187:329–336. doi: 10.1016/j.expneurol.2004.01.029. [DOI] [PubMed] [Google Scholar]
- Ye L, Huang Y, Zhao L, Li Y, Sun L, Zhou Y, Qian G, Zheng JC. IL-1beta and TNF-alpha induce neurotoxicity through glutamate production: a potential role for neuronal glutaminase. Journal of neurochemistry. 2013;125:897–908. doi: 10.1111/jnc.12263. [DOI] [PMC free article] [PubMed] [Google Scholar]
- Yeckel MF, Berger TW. Spatial distribution of potentiated synapses in hippocampus: dependence on cellular mechanisms and network properties. The Journal of neuroscience: the official journal of the Society for Neuroscience. 1998;18:438–450. doi: 10.1523/JNEUROSCI.18-01-00438.1998. [DOI] [PMC free article] [PubMed] [Google Scholar]
- Zelcer I, Cohen H, Richter-Levin G, Lebiosn T, Grossberger T, Barkai E. A cellular correlate of learning-induced metaplasticity in the hippocampus. Cereb Cortex. 2006;16:460–468. doi: 10.1093/cercor/bhi125. [DOI] [PubMed] [Google Scholar]
- Zhang Z, Gong N, Wang W, Xu L, Xu TL. Bell-shaped D-serine actions on hippocampal long-term depression and spatial memory retrieval. Cereb Cortex. 2008;18:2391–2401. doi: 10.1093/cercor/bhn008. [DOI] [PubMed] [Google Scholar]
- Zhao J, Lopez AL, Erichsen D, Herek S, Cotter RL, Curthoys NP, Zheng J. Mitochondrial glutaminase enhances extracellular glutamate production in HIV-1-infected macrophages: linkage to HIV-1 associated dementia. Journal of neurochemistry. 2004;88:169–180. doi: 10.1046/j.1471-4159.2003.02146.x. [DOI] [PubMed] [Google Scholar]
- Zhao L, Huang Y, Tian C, Taylor L, Curthoys N, Wang Y, Vernon H, Zheng J. Interferon- regulates glutaminase 1 promoter through STAT1 phosphorylation: Relevance to HIV-1 associated neurocognitive disorders. PloS one. 2012;7:e32995. doi: 10.1371/journal.pone.0032995. [DOI] [PMC free article] [PubMed] [Google Scholar]
- Zhao L, Huang Y, Zheng J. STAT1 regulates human glutaminase 1 promoter activity through multiple binding sites in HIV-1 infected macrophages. PloS one. 2013;8:e76581. doi: 10.1371/journal.pone.0076581. [DOI] [PMC free article] [PubMed] [Google Scholar]
- Zhao MG, Toyoda H, Ko SW, Ding HK, Wu LJ, Zhuo M. Deficits in trace fear memory and long-term potentiation in a mouse model for fragile X syndrome. The Journal of neuroscience: the official journal of the Society for Neuroscience. 2005;25:7385–7392. doi: 10.1523/JNEUROSCI.1520-05.2005. [DOI] [PMC free article] [PubMed] [Google Scholar]
- Zhu B, Xu D, Deng X, Chen Q, Huang Y, Peng H, Li Y, Jia B, Thoreson WB, Ding W, Ding J, Zhao L, Wang Y, Wavrin KL, Duan S, Zheng J. CXCL12 enhances human neural progenitor cell survival through a CXCR7- and CXCR4-mediated endocytotic signaling pathway. Stem Cells. 2012;30:2571–2583. doi: 10.1002/stem.1239. [DOI] [PMC free article] [PubMed] [Google Scholar]
- Zoia CP, Tagliabue E, Isella V, Begni B, Fumagalli L, Brighina L, Appollonio I, Racchi M, Ferrarese C. Fibroblast glutamate transport in aging and in AD: correlations with disease severity. Neurobiology of aging. 2005;26:825–832. doi: 10.1016/j.neurobiolaging.2004.07.007. [DOI] [PubMed] [Google Scholar]
Associated Data
This section collects any data citations, data availability statements, or supplementary materials included in this article.