

Abstract
Recent advances in understanding protein folding have benefitted from coarse-grained representations of protein structures. Empirical energy functions derived from these techniques occasionally succeed in distinguishing native structures from their corresponding ensembles of nonnative folds or decoys which display varying degrees of structural dissimilarity to the native proteins. Here we utilized atomic coordinates of single protein chains, comprising a large diverse training set, to develop and evaluate twelve all-atom four-body statistical potentials obtained by exploring alternative values for a pair of inherent parameters. Delaunay tessellation was performed on the atomic coordinates of each protein to objectively identify all quadruplets of interacting atoms, and atomic potentials were generated via statistical analysis of the data and implementation of the inverted Boltzmann principle. Our potentials were evaluated using benchmarking datasets from Decoys-‘R'-Us, and comparisons were made with twelve other physics- and knowledge-based potentials. Ranking 3rd, our best potential tied CHARMM19 and surpassed AMBER force field potentials. We illustrate how a generalized version of our potential can be used to empirically calculate binding energies for target-ligand complexes, using HIV-1 protease-inhibitor complexes for a practical application. The combined results suggest an accurate and efficient atomic four-body statistical potential for protein structure prediction and assessment.
1. Introduction
Over recent years, exponential growth of the Protein Data Bank (PDB) [1] has facilitated the selection of larger, nonredundant subsets of experimentally solved protein structures at higher resolutions, which in turn have provided the data used in developing more effective knowledge-based statistical potentials for improved structure prediction. In contrast to physics-based energy functions, statistical potentials generally perform better and are more computationally efficient at identifying the native structure as a global minimum [2, 3]. Distance-dependent statistical potentials often focus on pairwise atomic contacts within macromolecular structures [4, 5]; however, such energy functions fail to take into consideration important higher-order contributions based on multibody interactions [6, 7]. Indeed, use of an “atomic environment potential” for which neighborhood sizes vary by atom previously demonstrated improved performance at discriminating between native and near-native protein structures [3]. In the present work we employed the well-established computational geometry tiling technique of Delaunay tessellation [8], for objectively identifying all quadruplets of nearest neighbor atoms in order to develop, evaluate, and apply all-atom four-body statistical potentials for protein structure prediction.
Four-body statistical potentials were derived based on PDB atomic coordinate file data corresponding to single chains selected from over 1400 diverse protein structures. Delaunay tessellation was applied to the three-dimensional (3D) atomic coordinates of each protein chain, whereby atoms were treated as vertices to generate a convex hull encompassing thousands of space-filling, nonoverlapping, irregular tetrahedra (Figure 1). For assurance that each tetrahedron identifies at its four vertices a quadruplet of atoms that are pairwise all within a prescribed distance from one another, a subsequent edge-length cutoff parameter may be introduced; removal of a tetrahedral edge between a pair of atoms longer than this cutoff eliminates from the tessellation all tetrahedra sharing that edge. Depending on the size K of the atomic alphabet used for labeling points, the four atoms appearing at vertices of any particular tetrahedron in these tessellations represent one of 35 (K = 4 letters), 330 (K = 8), or 8855 (K = 20) possible distinct atomic quadruplet types. For each cutoff (if any) and alphabet size, statistical data obtained from the protein chains and their tessellations included the following: (1) observed relative frequencies of interaction for each type of atomic quadruplet, based on their rates of occurrence as tetrahedral vertices; and (2) rates expected by chance for each atomic quadruplet type, based on relative frequencies of individual atom types in the protein chains and use of a multinomial reference distribution. Through application of the inverted Boltzmann principle [9, 10], the negative logarithm of the ratio of observed to expected rates of occurrence was used to calculate an empirical energy of interaction for each atomic quadruplet, which collectively form an atomic four-body statistical potential.
Figure 1.
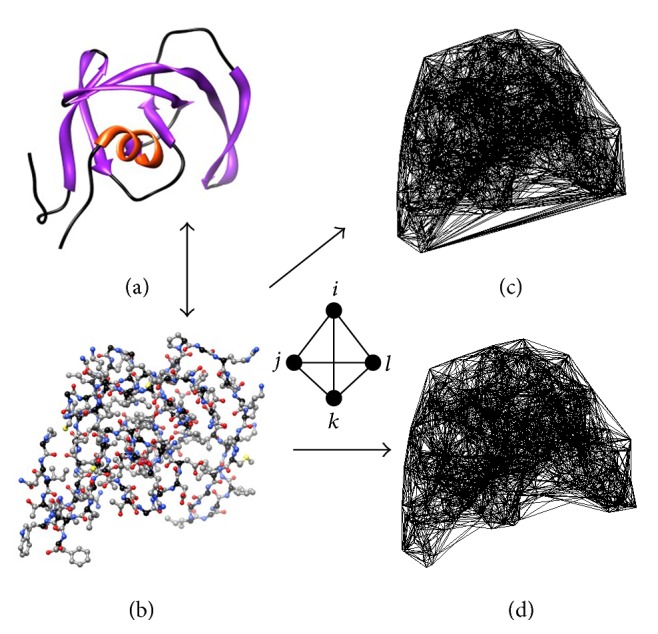
HIV-1 protease (a) ribbon and (b) atomic ball-and-stick diagrams. The atomic coordinates are used as tetrahedral vertices to generate (c) the Delaunay tessellation of the protein chain, a convex hull consisting of thousands of space-filling and nonoverlapping tetrahedra, each of whose vertices objectively identifies a quadruplet of nearest neighbor atoms. The modified tessellation in (d) is obtained by removing all edges longer than 12 Å between pairs of atoms, thereby eliminating all tetrahedra that share those edges and excluding their corresponding atomic quadruplets from consideration as nearest neighbors.
The approach implemented here at the atomic level was motivated by its prior successful application at the residue level [11–16]. All atomic 3D coordinates in proteins are considered in this work to generate the all-atom four-body statistical potentials, while previously developed residue-based four-body potentials used only a single point per amino acid (e.g., Cα or residue center of mass). Clearly, there is a degree of information loss with the coarser-grained residue representation of proteins relative to the finer all-atom representation. Both approaches implement the Delaunay tessellation algorithm, which uses the respective point-sets to serve as vertices for generating a tetrahedral tiling of the protein structure that objectively identifies quadruplets of nearest neighbors (i.e., either residues or atoms). Given its significantly more sparse point-set, a residue-based (i.e., one point per residue) tessellation typically yields a few hundred tetrahedra, whereas tessellation applied to all the atoms in the same protein structure has on the order of a few thousand tetrahedra.
Upon selecting an atomic alphabet and edge-length cutoff as parameters, the energy of any folded protein chain would subsequently be calculated with the atomic four-body potential as follows: label and tessellate the 3D atomic coordinates of the structure according to the same parameters, refer to the previously derived atomic four-body potential under those parameters to assign a score to each tetrahedron in the tessellation equal to the interaction energy of the atomic quadruplet found at its four vertices, and add up the scores of all the tetrahedra in the tessellation. The all-atom four-body statistical potentials that we developed were each evaluated by scoring multiple decoy directories in the Decoys-‘R'-Us benchmarking database [17]. We compared these four-body potentials to one another, based on standard performance metrics, as well as to the knowledge-based potentials of Fogolari et al. [18] and Summa et al. [3]; the latter study detailed performance results for 10 diverse physics- and knowledge-based potentials to conduct their own comparisons, hence providing us an opportunity to assess our four-body potentials relative to a dozen other methods in total. Lastly, we report on a practical application, related to predicting target-inhibitor binding energy, by implementing a modification of our best performing four-body potential.
2. Methods
2.1. Protein Training Set
A nonredundant set of 1417 high-resolution (≤2.2 Å) crystallographic structures, with atomic coordinate files deposited in the PDB, were culled using the PISCES server [28] with the constraint that the single protein chains selected from the structures shared low (<30%) sequence identity (http://binf2.gmu.edu/automute/tessellatable1417.txt). The ensemble of structure files is diverse, consisting of single- and multichain proteins, the vast majority of which are additionally complexed to small molecular or peptide ligands. Coordinates of hydrogen atoms and water molecules were removed from all files prior to proceeding with the analyses.
2.2. Designation of Atoms
For each of the 1417 protein chains, three alphabets were explored for defining atom types and labeling points corresponding to their 3D atomic coordinates. In the first instance, a simple four-letter alphabet (C, N, O, and S) accounts for all atoms and ensures sufficient frequency data are collected for all possible atomic quadruplets observed at the four vertices of tetrahedra in Delaunay tessellations (Table 1). Clearly, the same atom type may appear at more than one of the four vertices of any tetrahedron in a protein tessellation, and given that those vertices are unordered, all permutations of the four atomic letters at the vertices of a tetrahedron refer to the same quadruplet, so that an alphabetical ordering (e.g., COON) of the atoms can be used as a singular representation. In this case, a combinatorial argument [29] shows that the number N of distinct subsets of size r = 4 letters that can be formed from an atomic alphabet of size K is given by
| (1) |
Hence, K = 4 letters admit N = 35 distinct atomic quadruplets. Next, an atomic alphabet consisting of K = 8 letters (amino acid backbone: NB, Cα, CB, and OB; side-chain: NS, CS, OS, and S) differentiates between backbone alpha- and carbonyl-carbon atoms, distinguishes residue backbone atoms from those in side-chains, and can form N = 330 distinct atomic quadruplets. Lastly, we explored a maximum diversity of quadruplet atomic interactions with K = 20 letters as described in Summa et al. [3], which groups atoms based on common traits, including bonding pattern, partial charge, and hydrophobicity, and generates N = 8855 distinct atomic quadruplets.
Table 1.
Summary data for the protein structure training set (1417 single chains).
| Atomic alphabet | Count | Proportion |
|---|---|---|
| C | 1572222 | 0.634149 |
| N | 425874 | 0.171774 |
| O | 469869 | 0.189520 |
| S | 11299 | 0.004557 |
|
| ||
| ∗Total atom count | 2479264 | |
|
| ||
| ∗Total tetrahedron counts | ||
| No edge-length cutoff | 16152638 | |
| 12 Å edge-length cutoff | 15497203 | |
| 8 Å edge-length cutoff | 14567713 | |
| 4.8 Å edge-length cutoff | 9569503 | |
∗Same counts regardless of atomic alphabet size.
2.3. Derivation of the Atomic Four-Body Statistical Potentials
Delaunay tessellations for the 1417 single protein chains were generated by submitting their respective atomic coordinates as input to the Qhull program [30], visualizations of the tessellated structures were obtained by utilizing the output data from Qhull to create plots within Matlab, and molecular graphics were produced with Chimera [31] (Figure 1). An in-house suite of Perl programs was used for all data formatting and analyses related to the tessellated structures (Table 1). In particular, for each atomic alphabet of size K the relative frequencies of occurrence fijkl for all N types of atomic quadruplets (i, j, k, l) were calculated as the proportion of tetrahedra among all the tessellations for which the four atoms appear on the vertices. Four separate sets of relative frequencies were calculated for each of the three atomic alphabets explored, based on the original protein tessellations (no edge-length cutoff applied), as well as tessellations modified by introducing cutoffs of length 12 Å, 8 Å, and 4.8 Å. The use of an 8 Å cutoff is consistent with that used by other researchers to generate atomic pair potentials [32], while the other two cutoffs were also selected to identify the appropriate choice for an atomic four-body potential.
For each of the three atomic alphabets, we additionally computed relative frequencies of occurrence an, n = 1,…, K for the K atom types in all 1417 single protein chains. These frequencies, in turn, were needed for calculating the rate pijkl expected by chance for all N types of atomic quadruplets (i, j, k, l) obtained using a multinomial reference distribution, given by
| (2) |
In the formula above, tn represents the number of occurrences of atom type n in the quadruplet. For each pair of parameters selected (i.e., alphabet size and cutoff), we applied the inverted Boltzmann principle to calculate a score sijkl = –log(fijkl/pijkl) for quantifying the interaction energy for all N types of atomic quadruplets (i, j, k, l), as described by Sippl [9, 10], thus defining a particular atomic four-body statistical potential function (Table 2 and Figure 2). A total of 12 four-body potentials were generated and evaluated in this study (3 atomic alphabets × 4 edge-length cutoffs, which includes the case where no cutoff is applied to the original tessellations).
Table 2.
Atomic four-body statistical potentials employing a 4-letter alphabet.
| Quad | No cutoff | 12 Å cutoff | 8 Å cutoff | 4.8 Å cutoff | ||||
|---|---|---|---|---|---|---|---|---|
| Count | s ijkl | Count | s ijkl | Count | s ijkl | Count | s ijkl | |
| CCCC | 1711740 | 0.183570 | 1692278 | 0.170562 | 1643281 | 0.156444 | 922742 | 0.224573 |
| CCCN | 1823746 | 0.190871 | 1790819 | 0.180796 | 1726843 | 0.169730 | 1229054 | 0.134910 |
| CCCO | 2807489 | 0.046213 | 2750767 | 0.037094 | 2616669 | 0.031930 | 1533444 | 0.081509 |
| CCCS | 119435 | −0.201538 | 117868 | −0.213776 | 114416 | −0.227745 | 53175 | −0.077468 |
| CCNN | 832442 | 0.140340 | 803373 | 0.137776 | 764343 | 0.132553 | 612799 | 0.046021 |
| CCNO | 3838549 | −0.179748 | 3746112 | −0.187158 | 3593186 | −0.195913 | 2695736 | −0.253612 |
| CCNS | 53655 | 0.055872 | 52228 | 0.049592 | 50119 | 0.040628 | 28817 | 0.098480 |
| CCOO | 1643096 | −0.069578 | 1559797 | −0.064976 | 1408171 | −0.047423 | 796121 | 0.017752 |
| CCOS | 86638 | −0.109530 | 84188 | −0.115055 | 79331 | −0.116117 | 36077 | 0.043594 |
| CCSS | 6408 | −0.898511 | 6343 | −0.912057 | 6183 | −0.927840 | 3685 | −0.885580 |
| CNNN | 64504 | 0.507783 | 51089 | 0.591028 | 39927 | 0.671251 | 18568 | 0.821250 |
| CNNO | 961282 | −0.145664 | 903031 | −0.136526 | 842880 | −0.133431 | 647785 | −0.201598 |
| CNNS | 7628 | 0.335839 | 6916 | 0.360394 | 6293 | 0.374540 | 3499 | 0.446952 |
| CNOO | 1380693 | −0.260215 | 1283449 | −0.246502 | 1168615 | −0.232641 | 757532 | −0.226873 |
| CNOS | 44097 | −0.082434 | 41962 | −0.078877 | 39453 | −0.078957 | 22706 | −0.021519 |
| CNSS | 2153 | −0.691035 | 2131 | −0.704562 | 2085 | −0.721950 | 1312 | −0.703279 |
| COOO | 336824 | −0.081946 | 278989 | −0.018132 | 207773 | 0.083015 | 65646 | 0.400894 |
| COOS | 17883 | 0.051201 | 16090 | 0.079093 | 13492 | 0.128713 | 4711 | 0.403174 |
| COSS | 2068 | −0.630846 | 2009 | −0.636259 | 1897 | −0.638215 | 1001 | −0.543084 |
| CSSS | 214 | −1.741768 | 214 | −1.759742 | 207 | −1.772176 | 125 | −1.735618 |
| NNNN | 4632 | 0.482308 | 2068 | 0.814499 | 1118 | 1.054783 | 133 | 1.796871 |
| NNNO | 36223 | 0.233848 | 22370 | 0.425144 | 15881 | 0.547103 | 5948 | 0.791107 |
| NNNS | 407 | 0.564301 | 263 | 0.735926 | 203 | 0.821548 | 58 | 1.183114 |
| NNOO | 190771 | −0.268893 | 158110 | −0.205359 | 137906 | −0.172816 | 97822 | −0.206171 |
| NNOS | 3088 | 0.204035 | 2530 | 0.272582 | 2171 | 0.312201 | 1061 | 0.440643 |
| NNSS | 236 | −0.599166 | 230 | −0.605982 | 224 | −0.621354 | 79 | −0.351235 |
| NOOO | 129494 | −0.234026 | 92243 | −0.104725 | 67495 | 0.004100 | 26079 | 0.234579 |
| NOOS | 5426 | 0.001929 | 4626 | 0.053197 | 4007 | 0.088737 | 1832 | 0.246129 |
| NOSS | 436 | −0.522015 | 418 | −0.521701 | 405 | −0.534836 | 220 | −0.452305 |
| NSSS | 138 | −2.118466 | 138 | −2.136453 | 137 | −2.160159 | 48 | −1.887182 |
| OOOO | 39551 | −0.278298 | 23332 | −0.067103 | 12170 | 0.188717 | 1542 | 0.903421 |
| OOOS | 1462 | 0.137035 | 1007 | 0.280952 | 636 | 0.453674 | 78 | 1.182534 |
| OOSS | 158 | −0.339520 | 143 | −0.314191 | 125 | −0.282625 | 32 | 0.126633 |
| OSSS | 22 | −1.278314 | 22 | −1.296297 | 21 | −1.302962 | 5 | −0.862215 |
| SSSS | 50 | −3.855858 | 50 | −3.873832 | 50 | −3.900710 | 31 | −3.875603 |
Figure 2.

Graphical representations for two four-body potentials, based on an eight-letter alphabet with a 12 Å edge-length cutoff, and a twenty-letter alphabet with a 4.8 Å edge-length cutoff. Here Cα = alpha-carbon, CB = backbone carbonyl-carbon, and S = side-chain sulfur (from either cysteine or methionine) represent the same atom types in both alphabets, with quadruplets SSSS and CαCBCBCB appearing at the same extremes of both potentials. Despite millions of tetrahedra generated by the 1417 protein tessellations irrespective of the cutoff length (see Table 1), note that 3 of 330 atomic quadruplet types (CαCαCαS, CBCBCBCB, and CαCBCBNS) did not appear at all as tetrahedral vertices based on an 8-letter atomic alphabet with a 12 Å cutoff (NS = side-chain nitrogen atom), while 1935 of 8855 quadruplets types were not observed under a 20-letter alphabet with a 4.8 Å cutoff.
In any atomic tessellation of a protein structure, two adjacent tetrahedra may share a common vertex (1 atom), a common edge (2 atoms), or a common triangular face (3 atoms). Although the two adjacent tetrahedra represent two sets of atomic quadruplets that may share up to 3 atoms in common, those quadruplets are distinct by virtue of the atom(s) that the two tetrahedra do not share. The collective interaction of a quadruplet of atoms as a fundamental unit in this four-body scenario is analogous to the interaction of two atoms in the development of a pair potential, whereby a given atom may be considered to interact with each of several neighboring atoms by virtue of satisfying a prescribed distance cutoff between itself and each of the neighbors, and therefore the atom is shared by all of those pairs; likewise, two atomic quadruplets from adjacent tetrahedra in a tessellation may share up to 3 atoms and yet remain fundamentally distinct quadruplets. Moreover, since Delaunay tessellation does not distinguish types of bonds and generates a tetrahedral tiling by objectively identifying quadruplets of nearest neighbor atoms based solely on their six collective pairwise distances from each other, all covalent bonds as well as noncovalent interactions between particular pairs of atoms are included together in these tetrahedral atomic quadruplets without the need to explicitly identify and segregate them. Recent studies suggest that covalent interactions are informative when combined with nonbonded interactions [33, 34].
2.4. Decoy Database
A significant collection of models provided in the Decoys-‘R'-Us database (http://compbio.buffalo.edu/dd/) form a well-established and challenging standard for benchmarking the performance of energy functions. Several categories are located under the heading “The multiple decoy sets,” each containing a number of decoy model directories. Each such directory is named after the PDB accession code of the native crystallographic protein structure and contains coordinate files for that native structure as well as for numerous decoy model structures (i.e., alternative conformations for a given native structure); additionally, the directory includes a file that provides the Cα root mean square deviations (rmsds) for all the alternative models relative to the native structure. For this work, we focused on the following decoy set categories: 4_state_reduced, fisa, fisa_casp3, hg_structal, ig_structal, ig_structal_hires, lattice_ssfit, and lmds.
3. Results
3.1. Energy Calculations and Benchmark Evaluation Measures
Energy calculations were made for 145 native protein structures as well as for all of their respective decoy models downloaded from the 8 decoy set categories in the Decoys-‘R'-Us database. To this end, all native and decoy structures were tessellated, and their energies were repeatedly computed using all twelve four-body potentials under their respective parameters of atomic alphabet size and tessellation edge-length cutoff. Given the energy scores for a native structure and its collection of decoys, all calculated using the same four-body potential, the following measures of performance were evaluated.
(1) Native Rank. Among the native protein and all decoys, the structures are ranked in ascending order according to increasing energy (i.e., lowest energy structure has rank 1).
(2) Z-Score. This measurement is defined as
| (3) |
where En is energy of the native structure, 〈E〉 is mean energy over all decoy models, and σ is standard deviation of the distribution of decoy energies [3]. A large positive z-score indicates a wide gap between the energy of the native protein and the mean decoy energy.
(3) Correlation Coefficient (r). It is the linear correlation between calculated energy and rmsd. For decoys with low rmsds relative to the native structure, good correlation is preferable; however, this is unlikely if decoys are significantly misfolded with high rmsds.
(4) Fractional Enrichment (FE). It is the proportion of decoy structures corresponding to the lowest 10% of rmsds that are also found among those corresponding to the lowest 10% of calculated energy scores.
The raw performance data obtained with the four-body potential derived using a 4-letter atomic alphabet and a 12 Å tessellation edge-length cutoff as parameters (Table 2) are presented in Table 3. As such, we employed the same 4-letter alphabet to label the atomic vertices in the tessellations of the 145 native structures and all of their respective decoys, and edges longer than 12 Å were removed from all tessellations prior to calculating total energies as described in the last paragraph of the Introduction. Data analogous to that of Table 3 were obtained using each of the 11 other four-body potentials generated for this study under alternative parameter-pair values for atomic alphabet size and tessellation edge-length cutoff (raw data not shown).
Table 3.
Performance evaluation on 145 benchmarks in 8 decoy sets from Decoys-‘R'-Us, based on energies obtained with the four-body potential derived using a 4-letter alphabet and 12 Å cutoff as parameters.
| Decoy set | PDB ID | ∗Native rank | z-score | ∗ r | ∗FE |
|---|---|---|---|---|---|
| 4state_reduced | 1ctf | 156/631 | 0.7 | 0.27 | 11.1 |
| 1r69 | 6/676 | 2.5 | 0.18 | 14.9 | |
| 1sn3 | 23/660 | 1.8 | 0.42 | 48.5 | |
| 2cro | 5/674 | 2.4 | 0.40 | 20.9 | |
| 3icb | 137/654 | 0.8 | 0.34 | 21.5 | |
| 4pti | 1/687 | 3.5 | 0.48 | 45.6 | |
| 4rxn | 83/677 | 1.1 | 0.31 | 19.4 | |
|
| |||||
| fisa | 1fc2 | 497/501 | −2.2 | −0.22 | 4.0 |
| 1hddC | 442/501 | −1.2 | −0.02 | 8.0 | |
| 2cro | 32/501 | 1.5 | 0.07 | 10.0 | |
| 4icb | 465/500 | −1.4 | −0.02 | 6.0 | |
|
| |||||
| fisa_casp3 | 1bg8A | 10/1201 | 2.4 | 0.06 | 14.2 |
| 1bl0 | 883/972 | −1.4 | −0.19 | 5.2 | |
| 1eh2 | 1624/2414 | −0.5 | 0.09 | 16.2 | |
| 1jwe | 539/1408 | 0.3 | 0.04 | 9.3 | |
| smd3 | 1/1201 | 2.8 | 0.07 | 10.0 | |
|
| |||||
| hg_structal | 1ash | 2/30 | 2.2 | 0.47 | 33.3 |
| 1babB | 1/30 | 3.7 | 0.17 | 66.7 | |
| 1colA | 1/30 | 3.9 | 0.46 | 33.3 | |
| 1cpcA | 4/30 | 1.4 | 0.19 | 0.0 | |
| 1ecd | 11/30 | 0.3 | 0.00 | 0.0 | |
| 1emy | 1/30 | 3.3 | 0.38 | 66.7 | |
| 1flp | 1/30 | 2.3 | 0.21 | 66.7 | |
| 1gdm | 3/30 | 1.5 | 0.12 | 33.3 | |
| 1hbg | 1/30 | 2.8 | 0.03 | 33.3 | |
| 1hbhA | 1/30 | 3.4 | 0.18 | 33.3 | |
| 1hbhB | 3/30 | 1.7 | −0.27 | 33.3 | |
| 1hdaA | 1/30 | 5.2 | 0.27 | 33.3 | |
| 1hdaB | 1/30 | 4.2 | 0.42 | 33.3 | |
| 1hlb | 1/30 | 2.0 | 0.25 | 33.3 | |
| 1hlm | 5/30 | 0.9 | 0.12 | 0.0 | |
| 1hsy | 12/30 | 0.3 | 0.49 | 33.3 | |
| 1ithA | 1/30 | 3.4 | 0.17 | 66.7 | |
| 1lht | 13/30 | 0.1 | 0.12 | 0.0 | |
| 1mba | 1/30 | 5.7 | 0.31 | 33.3 | |
| 1mbs | 30/30 | −2.8 | 0.16 | 33.3 | |
| 1mygA | 3/30 | 1.3 | 0.25 | 66.7 | |
| 1myjA | 14/30 | 0.1 | 0.29 | 0.0 | |
| 1myt | 20/30 | −0.8 | 0.06 | 33.3 | |
| 2dhbA | 30/30 | −2.0 | −0.23 | 33.3 | |
| 2dhbB | 24/30 | −0.9 | 0.45 | 33.3 | |
| 2lhb | 1/30 | 4.7 | 0.49 | 66.7 | |
| 2pghA | 6/30 | 1.1 | 0.24 | 33.3 | |
| 2pghB | 1/30 | 2.7 | 0.29 | 33.3 | |
| 4sdhA | 1/30 | 2.7 | −0.01 | 33.3 | |
|
| |||||
| lattice_ssfit | 1beo | 1/1999 | 4.9 | 0.04 | 7.0 |
| 1ctf | 88/2001 | 1.7 | −0.04 | 11.0 | |
| 1dktA | 13/1999 | 2.5 | 0.00 | 8.5 | |
| 1fca | 3/2001 | 3.1 | 0.03 | 16.0 | |
| 1nkl | 92/1998 | 1.7 | 0.01 | 17.1 | |
| 1pgb | 506/2000 | 0.7 | −0.04 | 13.0 | |
| 1trlA | 68/2000 | 1.8 | 0.03 | 10.5 | |
| 4icb | 223/2000 | 1.2 | −0.03 | 13.0 | |
|
| |||||
| ig_structal_hires | 1dvf | 1/20 | 2.1 | 0.13 | 50.0 |
| 1fgv | 1/20 | 3.9 | 0.20 | 50.0 | |
| 1flr | 16/20 | −0.3 | −0.08 | 0.0 | |
| 1fvc | 1/20 | 3.5 | 0.56 | 50.0 | |
| 1gaf | 1/20 | 3.8 | −0.01 | 50.0 | |
| 1hil | 1/20 | 2.6 | 0.55 | 50.0 | |
| 1ind | 7/20 | 0.2 | 0.36 | 0.0 | |
| 1kem | 1/20 | 2.4 | 0.46 | 50.0 | |
| 1mfa | 1/20 | 2.0 | 0.10 | 50.0 | |
| 1mlb | 9/20 | 0.2 | −0.51 | 0.0 | |
| 1nbv | 11/20 | −0.2 | 0.20 | 0.0 | |
| 1opg | 20/20 | −3.8 | −0.45 | 0.0 | |
| 1vfa | 1/20 | 2.2 | 0.39 | 50.0 | |
| 1vge | 2/20 | 1.9 | 0.42 | 50.0 | |
| 2cgr | 1/20 | 2.6 | 0.39 | 50.0 | |
| 2fb4 | 7/20 | 0.3 | −0.09 | 0.0 | |
| 2fbj | 19/20 | −1.1 | −0.12 | 0.0 | |
| 6fab | 3/20 | 1.5 | 0.25 | 0.0 | |
| 7fab | 10/20 | 0.2 | 0.27 | 0.0 | |
| 8fab | 1/20 | 2.6 | 0.14 | 50.0 | |
|
| |||||
| ig_structal | 1acy | 56/61 | −1.5 | −0.01 | 0.0 |
| 1baf | 3/61 | 2.1 | 0.12 | 16.7 | |
| 1bbd | 61/61 | −3.1 | −0.15 | 0.0 | |
| 1bbj | 23/61 | 0.1 | −0.02 | 0.0 | |
| 1dbb | 24/61 | 0.1 | −0.31 | 0.0 | |
| 1dfb | 8/61 | 1.1 | 0.20 | 0.0 | |
| 1dvf | 1/61 | 2.7 | 0.11 | 16.7 | |
| 1eap | 1/61 | 2.6 | 0.16 | 16.7 | |
| 1fai | 2/61 | 1.9 | 0.29 | 33.3 | |
| 1fbi | 12/61 | 0.8 | −0.06 | 33.3 | |
| 1fgv | 1/61 | 2.9 | 0.03 | 16.7 | |
| 1fig | 2/61 | 2.0 | 0.11 | 16.7 | |
| 1flr | 40/61 | −0.2 | −0.08 | 16.7 | |
| 1for | 1/61 | 3.5 | 0.16 | 33.3 | |
| 1fpt | 1/61 | 3.7 | 0.12 | 16.7 | |
| 1frg | 4/61 | 1.5 | 0.39 | 16.7 | |
| 1fvc | 1/61 | 2.8 | 0.16 | 33.3 | |
| 1fvd | 9/61 | 1.1 | 0.09 | 33.3 | |
| 1gaf | 1/61 | 3.5 | 0.04 | 16.7 | |
| 1ggi | 9/61 | 1.1 | −0.03 | 0.0 | |
| 1gig | 10/61 | 1.0 | 0.16 | 0.0 | |
| 1hil | 2/61 | 2.5 | 0.41 | 16.7 | |
| 1hkl | 1/61 | 4.3 | 0.01 | 16.7 | |
| 1iai | 1/61 | 3.0 | 0.15 | 33.3 | |
| 1ibg | 30/61 | 0.0 | −0.08 | 16.7 | |
| 1igc | 55/61 | −1.3 | 0.02 | 0.0 | |
| 1igf | 6/61 | 1.3 | 0.10 | 16.7 | |
| 1igi | 2/61 | 1.9 | 0.13 | 16.7 | |
| 1igm | 43/61 | −0.5 | 0.09 | 0.0 | |
| 1ikf | 1/61 | 2.7 | 0.35 | 50.0 | |
| 1ind | 20/61 | 0.5 | 0.31 | 0.0 | |
| 1jel | 1/61 | 3.5 | 0.02 | 16.7 | |
| 1jhl | 1/61 | 3.1 | 0.16 | 33.3 | |
| 1kem | 1/61 | 2.8 | 0.26 | 33.3 | |
| 1mam | 1/61 | 2.0 | 0.31 | 33.3 | |
| 1mcp | 60/61 | −1.8 | 0.23 | 0.0 | |
| 1mfa | 4/61 | 1.6 | −0.01 | 16.7 | |
| 1mlb | 23/61 | 0.4 | −0.19 | 0.0 | |
| 1mrd | 2/61 | 2.6 | 0.28 | 33.3 | |
| 1nbv | 36/61 | −0.2 | 0.03 | 0.0 | |
| 1ncb | 12/61 | 0.9 | −0.02 | 16.7 | |
| 1ngq | 13/61 | 0.8 | 0.00 | 0.0 | |
| 1nmb | 1/61 | 2.9 | 0.38 | 16.7 | |
| 1nsn | 8/61 | 1.0 | −0.11 | 0.0 | |
| 1opg | 61/61 | −2.7 | −0.01 | 0.0 | |
| 1plg | 2/61 | 1.8 | −0.02 | 16.7 | |
| 1rmf | 3/61 | 1.8 | 0.01 | 16.7 | |
| 1tet | 2/61 | 2.6 | −0.15 | 16.7 | |
| 1ucb | 1/61 | 4.3 | 0.33 | 16.7 | |
| 1vfa | 1/61 | 2.5 | 0.20 | 16.7 | |
| 1vge | 3/61 | 2.1 | 0.03 | 16.7 | |
| 1yuh | 22/61 | 0.6 | −0.02 | 16.7 | |
| 2cgr | 1/60 | 2.5 | 0.17 | 16.7 | |
| 2fb4 | 19/61 | 0.4 | −0.12 | 0.0 | |
| 2fbj | 53/61 | −0.9 | 0.12 | 16.7 | |
| 2gfb | 1/61 | 2.9 | 0.28 | 16.7 | |
| 3hfl | 12/61 | 1.0 | 0.20 | 16.7 | |
| 3hfm | 61/61 | −4.3 | −0.16 | 0.0 | |
| 6fab | 7/61 | 1.4 | 0.02 | 0.0 | |
| 7fab | 23/61 | 0.3 | 0.01 | 0.0 | |
| 8fab | 1/61 | 3.1 | 0.04 | 16.7 | |
|
| |||||
| lmds | 1b0nB | 1/498 | 3.9 | 0.05 | 10.2 |
| 1bba | 496/501 | −2.1 | 0.03 | 18.0 | |
| 1ctf | 32/498 | 1.6 | 0.03 | 14.3 | |
| 1dtk | 206/216 | −1.7 | 0.04 | 14.3 | |
| 1fc2 | 247/501 | 0.0 | 0.05 | 16.0 | |
| 1igd | 342/501 | −0.4 | 0.14 | 10.0 | |
| 1shfA | 223/438 | 0.1 | −0.01 | 4.7 | |
| 2cro | 2/501 | 2.3 | 0.22 | 14.0 | |
| 2ovo | 110/348 | 0.4 | 0.05 | 11.8 | |
| 4pti | 26/344 | 1.5 | 0.02 | 14.7 | |
| smd3 | 1/501 | 3.5 | 0.01 | 10.0 | |
∗Native rank = (rank of native structure with given PDB ID)/(total number of decoys); a rank of 1 is optimal and means the calculated energy of the native structure is lower than that of all its decoys; r = correlation coefficient; FE = fractional enrichment.
The plots of energy versus rmsd in Figure 3, based on 4 native proteins and their collections of decoys evaluated with a varied selection of four-body potentials that we generated, are illustrative of the strengths and weaknesses of the performance measures defined above. In particular, since 4state_reduced is known to contain native-like alternative conformations for each protein in the set, reasonably good correlation (r ≫ 0) and fractional enrichment (FE > 10%) are expected from a reliable energy function [18, 35], and this is illustrated by the plot for 4pti. Next, ig_structal_hires and hg-structal contain decoys built by homology modeling for immunoglobulin (ig) and globin (hg) proteins, all of which are native-like structures with very low rmsds relative to native [18]. The plots for 1fvc and 1hdaB reflect the expected strong correlation and fractional enrichment; additionally, despite the fact that the native protein and very low rmsd decoys all have a good chance of achieving the lowest energy conformation, both native proteins rank 1 for these examples. Finally, the set lattice_ssfit consists of decoys selected with an all-atom energy function and refined using coarse lattice models, and rmsd > 4 Å for all decoys in this set relative to their native proteins [18, 36]. The plot for 1beo shows that, as expected in such cases of significantly misfolded decoys, there is no correlation between energy and rmsd relative to the native structure; furthermore, the fractional enrichment is low and the z-score is relatively large, as commonly encountered by such decoys and suggested by the plot.
Figure 3.

Sampling of calculated energy versus rmsd plots for four decoy sets. A different atomic four-body statistical potential energy function (i.e., distinct pairs of atomic alphabet size and tessellation edge-length cutoff parameters) was selected to compute the energy values for each plot. The plots reveal wide variability in the number of alternative conformations for a given native structure based on decoy category, and they highlight the relative strengths and weaknesses of native rank, correlation coefficient (r), z-score, and fractional enrichment (FE) as performance measures under a range of conditions, hence reinforcing their collective importance for evaluating energy functions.
3.2. Four-Body Potentials: Relative Performance
To effectively rank all twelve four-body potentials generated for this study, first we identified, for each of the 145 native proteins and their respective decoys, the best native rank and largest z-score, correlation coefficient, and fractional enrichment values obtained, without regard to which potential yielded those optimal values of the performance measures. Next, for each potential separately, we counted the number of times (out of 145) that the potential either matched or singularly provided each optimal value recorded for a performance measure concerning a native protein and its set of decoys (Table 4, numbers above parentheses). For each performance measure, we then ranked these counts across all the potentials (Table 4, numbers in parentheses); subsequently for each potential separately, we averaged its rankings across the four performance measures (Table 4, next to bottom row). Finally, those averaged ranks were used to generate an overall ranking of the twelve four-body potentials (Table 4, bottom row). The ranking approach based on relative performance employed here and in the subsequent section was inspired by the technique described in Summa et al. [3] for comparing the performance of their potential to other related methods.
Table 4.
Relative performance among twelve atomic four-body statistical potentials.
| Alphabet size | 4 | 4 | 4 | 4 | 8 | 8 | 8 | 8 | 20 | 20 | 20 | 20 |
| Cutoff (Å) | 4.8 | 8 | 12 | None | 4.8 | 8 | 12 | None | 4.8 | 8 | 12 | None |
|
| ||||||||||||
| ∗Native rank | 42 | 48 | 55 | 61 | 23 | 29 | 27 | 25 | 33 | 41 | 34 | 33 |
| (4) | (3) | (2) | (1) | (12) | (9) | (10) | (11) | (7) | (5) | (6) | (7) | |
|
| ||||||||||||
| ∗ z-score | 25 | 9 | 18 | 37 | 1 | 4 | 1 | 1 | 15 | 21 | 2 | 11 |
| (2) | (7) | (4) | (1) | (10) | (8) | (10) | (10) | (5) | (3) | (9) | (6) | |
|
| ||||||||||||
| ∗ r | 10 | 9 | 6 | 24 | 4 | 6 | 7 | 9 | 5 | 28 | 21 | 16 |
| (5) | (6) | (9) | (2) | (12) | (9) | (8) | (6) | (11) | (1) | (3) | (4) | |
|
| ||||||||||||
| ∗FE | 38 | 46 | 49 | 47 | 23 | 34 | 32 | 38 | 37 | 56 | 43 | 42 |
| (7) | (4) | (2) | (3) | (12) | (10) | (11) | (7) | (9) | (1) | (5) | (6) | |
|
| ||||||||||||
| Average of ranks | 4.5 | 5 | 4.25 | 1.75 | 11.5 | 9 | 9.75 | 8.5 | 8 | 2.5 | 5.75 | 5.75 |
| Overall ranking | 4 | 5 | 3 | 1 | 12 | 10 | 11 | 9 | 8 | 2 | 6 | 6 |
∗Numbers above parentheses in each row reflect how many decoy sets (out of 145) for which the given potential matches the best performance value achieved among all 12 potentials tested; numbers in parentheses are the rankings of the counts in that row; r = correlation coefficient; FE = fractional enrichment.
In general, four-body potentials derived using a 4-letter atomic alphabet ranked highest, followed by those based on K = 20 letters, while potentials generated using 8 atom types ranked poorly over all four choices of tessellation edge-length cutoff parameter values. Among the 4-letter alphabet potentials, the one based on full structure tessellations (i.e., no edge-length cutoff) outperformed that using a 12 Å cutoff; however, the latter case is preferable since, without a fixed cutoff, false-positive atomic quadruplet interactions are admitted into the analyses based on those tessellations. A satisfying solution to this dilemma is revealed in the subsequent section as these four-body potentials are compared to those developed by other research groups.
3.3. Relative Performance: Comparisons with Related Methods
Next, an approach similar to that described in the previous section is used to individually compare each of our 12 four-body potentials to those of a dozen related methods. Using the Decoys-‘R'-Us database, Summa et al. [3] compared their “atomic environment potential” to ten other well-known physics- and knowledge-based potentials, providing us with valuable raw data to make comparisons with our four-body potentials. In addition, Fogolari et al. [18] developed an energy function employing two centers of interactions per amino acid. They also used the Decoys-‘R'-Us database to evaluate its performance, and these data are also included in our evaluations. Out of the 145 decoy sets that we used for benchmarking our four-body potentials relative to one another, 129 sets overlap with those used by both of those studies and form the basis of comparisons reported here. Lastly, the ten related methods investigated by Summa et al. [3] for comparing relative performance and used by us for a similar purpose include the following: three taken from the AMBER force field (a simple van der Waals potential, a pairwise electrostatic potential term, and the sum of these two terms, the latter representing the entire nonbonded contact energy of a typical molecular mechanics force field without either an explicit or implicit solvent model) [19]; two taken from CHARMM19 (both a van der Waals and a coulombic term) [20]; the ΔE and ΔEsolv potentials of Delarue and Koehl [21], and the ΔGenv potential of Koehl and Delarue [22]; and distance-dependent atomic potentials RAPDF [23] and DFIRE [24].
For each of the 129 decoy sets common to the studies, we obtained the raw performance data (i.e., native rank, z-score, correlation, coefficient, and fractional enrichment as presented in Table 3 for one of the four-body potentials) generated by each of the twelve methods described above. Next, we selected one of our four-body potentials and included its raw performance data, for a total of 13 methods to be compared. With every decoy set, we identified the best native rank achieved and the largest values obtained for z-score, correlation coefficient, and fractional enrichment, without regard to which of the 13 methods was responsible for each optimal measurement. For each of these 13 methods separately, we counted the number of times (out of 129) that the method either matched or singularly provided each optimal value recorded for a performance measure concerning a native protein and its set of decoys (Table 5, numbers to the left of those in parentheses). For each performance measure, we then ranked these counts across all 13 methods (Table 5, numbers in parentheses); subsequently for each method separately, we averaged its rankings across the four performance measures (Table 5, next to last column). Finally, those averaged ranks were used to generate an overall ranking of the 13 methods (Table 5, last column).
Table 5.
Relative performance among the four-body potential derived using a 4-letter alphabet and 12 Å cutoff as parameters and twelve other state-of-the-art methods.
| ∗Native rank | ∗ z-score | ∗ r | ∗FE | Average of ranks | Overall ranking | |
|---|---|---|---|---|---|---|
| 4 letters/12 Å cutoff | 47 (5) | 17 (3) | 8 (5) | 27 (5) | 4.5 | 3 |
| Summa et al. [3] | 97 (1) | 44 (1) | 7 (6) | 19 (8) | 4 | 2 |
| United-atom vdW (AMBER) [19] |
25 (12) | 0 (12) | 4 (8) | 10 (12) | 11 | 12 |
| Coulombic (AMBER) [19] | 33 (8) | 8 (6) | 2 (11) | 18 (9) | 8.5 | 10 |
| United-atom vdW + coulombic (AMBER) [19] | 26 (11) | 4 (9) | 4 (8) | 11 (11) | 9.75 | 11 |
| United-atom vdW (CHARM19) [20] | 31 (10) | 9 (4) | 4 (8) | 36 (3) | 6.25 | 7 |
| Coulombic (CHARM19) [20] | 76 (2) | 22 (2) | 5 (7) | 22 (7) | 4.5 | 3 |
| ΔE (Delarue and Koehl) [21] | 70 (3) | 7 (7) | 0 (13) | 17 (10) | 8.25 | 9 |
| ΔGenv (Koehl and Delarue) [22] | 33 (8) | 0 (12) | 32 (2) | 26 (6) | 7 | 8 |
| ΔEsolv (Delarue and Koehl) [21] | 20 (13) | 1 (11) | 1 (12) | 9 (13) | 12.25 | 13 |
| RAPDF [23] | 53 (4) | 3 (10) | 28 (3) | 36 (3) | 5 | 5 |
| DFIRE [24] | 38 (7) | 9 (4) | 33 (1) | 51 (1) | 3.25 | 1 |
| Fogolari et al. [18] | 40 (6) | 5 (8) | 15 (4) | 39 (2) | 5 | 5 |
∗Numbers not in parentheses in each column reflect how many decoy sets (out of 129) for which the given method matches the best performance value achieved among all 13 methods tested; numbers in parentheses are the rankings of the counts in that column; r = correlation coefficient; FE = fractional enrichment.
The overall rankings in Table 5 reveal that our four-body potential, derived using a 4-letter alphabet and 12 Å cutoff as parameters, outperformed 9 other methods, tied in overall ranking (3rd) with the coulombic term from CHARMM19, and was outperformed by DFIRE and the “atomic environment potential” of Summa et al. The methodology described in the previous paragraph was repeated separately for each of the twelve four-body potentials that we investigated, and the overall rankings in each case are reported in the columns of Table 6. Four-body potentials employing a 4-letter alphabet again appear to be the most competitive, and in particular those derived using unmodified tessellations (i.e., no edge-length cutoff) and a 12 Å cutoff achieved the highest overall rankings (3rd) among all of the four-body potentials, each in comparison to the 12 related state-of-the-art methods. As mentioned in the prior section, the introduction of false-positive atomic quadruplet interactions into the analyses is a concern when edge-length cutoffs are not considered after tessellation. Given that both of these potentials are equally competitive when compared with the other related methods, we conclude that a 4-letter alphabet and 12 Å tessellation edge-length cutoff provide the best pair of parameters with which to derive a four-body potential for calculating protein structure energies and effectively distinguishing native folds from nonnative decoy structures.
Table 6.
Overall rankings by separately comparing each four-body potential with twelve other methods.
| Alphabet size | 4 | 4 | ∗4 | 4 | 8 | 8 | 8 | 8 | 20 | 20 | 20 | 20 |
|---|---|---|---|---|---|---|---|---|---|---|---|---|
| Cutoff (Å) | 4.8 | 8 | ∗12 | None | 4.8 | 8 | 12 | None | 4.8 | 8 | 12 | None |
| Four-body potential | 10 | 4 | 3 | 3 | 12 | 11 | 12 | 11 | 11 | 9 | 10 | 11 |
| Summa et al. [3] | 2 | 2 | 2 | 2 | 2 | 2 | 2 | 2 | 2 | 2 | 2 | 2 |
| United-atom vdW (AMBER) [19] | 12 | 12 | 12 | 12 | 11 | 12 | 11 | 12 | 12 | 12 | 12 | 12 |
| Coulombic (AMBER) [19] | 9 | 10 | 10 | 9 | 9 | 9 | 9 | 9 | 9 | 9 | 9 | 9 |
| United-atom vdW + coulombic (AMBER) [19] | 11 | 11 | 11 | 11 | 10 | 10 | 10 | 10 | 10 | 11 | 11 | 10 |
| United-atom vdW (CHARM19) [20] | 6 | 7 | 7 | 7 | 6 | 6 | 6 | 6 | 6 | 6 | 6 | 6 |
| Coulombic (CHARM19) [20] | 3 | 3 | 3 | 3 | 3 | 3 | 3 | 2 | 3 | 2 | 3 | 2 |
| ΔE (Delarue and Koehl) [21] | 8 | 9 | 9 | 10 | 8 | 8 | 8 | 8 | 8 | 8 | 8 | 8 |
| ΔGenv (Koehl and Delarue) [22] | 7 | 8 | 8 | 8 | 7 | 7 | 7 | 7 | 7 | 7 | 7 | 7 |
| ΔEsolv (Delarue and Koehl) [21] | 13 | 13 | 13 | 13 | 12 | 13 | 13 | 13 | 13 | 13 | 13 | 13 |
| RAPDF [23] | 5 | 5 | 5 | 5 | 5 | 5 | 5 | 5 | 5 | 5 | 5 | 5 |
| DFIRE [24] | 1 | 1 | 1 | 1 | 1 | 1 | 1 | 1 | 1 | 1 | 1 | 1 |
| Fogolari et al. [18] | 4 | 5 | 5 | 5 | 4 | 4 | 4 | 4 | 4 | 4 | 4 | 4 |
4. Discussion
Energy calculations for single protein chains have been the sole focus up to this point, so it has been appropriate to consider atomic alphabets based only on the four heavy atom types found in proteins: carbon, nitrogen, oxygen, and sulfur. As mentioned earlier in Methods, a training set of 1417 diverse structures of single chain proteins were used for deriving the four-body potentials; however, the atomic coordinate for these protein chains was each obtained from a distinct PDB coordinate file, and the vast majority of these files are for structures of proteins complexed to small molecular or peptide ligands. Therefore, in order to tessellate the entirety of each of these PDB files, an expansion of the atomic alphabet is necessary to accommodate all atom types. The fact that such tessellations have an important function will become apparent as an application is introduced for predicting target-ligand binding affinities.
4.1. Generalized Four-Body Potential: An Alphabet Incorporating All Atom Types
Given the impressive performance on protein structures by the four-body potential derived using a 4-letter atomic alphabet and 12 Å tessellation edge-length cutoff, we simply expanded the alphabet to 6 letters in order to include atoms found exclusively in molecular ligands: M = all metals and X = all nonmetals other than (N, C, O, S). The atomic frequency data and total number of tetrahedra generated by tessellating the totality of the atomic coordinate data in the 1417 PDB structure files (hydrogen atoms and water molecules excluded, as discussed in Methods), after filtering out edges longer than 12 Å, are provided in Table 7. Since we are now working with a K = 6 letter alphabet, the atoms at the four vertices of each tetrahedron of a tessellation represent one of N = 126 atomic quadruplets. A retracing of the steps described in Methods yields the all-atom four-body statistical potential presented in Table 8. Note that 11 of the 126 atomic quadruplet types are not represented by any of the 36,406,467 tetrahedra obtained from the tessellations.
Table 7.
Summary data for the 1417 PDB coordinate files.
| Atom types | Count | Proportion |
|---|---|---|
| C (carbon) | 3612988 | 0.633193 |
| N (nitrogen) | 969253 | 0.169866 |
| O (oxygen) | 1088410 | 0.190749 |
| S (sulfur) | 28502 | 0.004995 |
| M (all metals) | 2529 | 0.000443 |
| X (all other nonmetals) | 4299 | 0.000754 |
|
| ||
| Total atom count | 5705981 | |
|
| ||
| Total tetrahedron count | 36406467 | |
Table 8.
All-atom four-body statistical potential derived using a 6-letter alphabet and a 12 Å cutoff.
| Quad | Count | f ijkl | p ijkl | s ijkl |
|---|---|---|---|---|
| CCCC | 4107297 | 0.112818 | 0.160748 | −0.15377 |
| CCCM | 1924 | 5.28E − 05 | 0.00045 | −0.93026 |
| CCCN | 4142684 | 0.11379 | 0.172495 | −0.18067 |
| CCCO | 6462239 | 0.177503 | 0.193701 | −0.03793 |
| CCCS | 297980 | 0.008185 | 0.005072 | 0.207795 |
| CCCX | 2996 | 8.23E − 05 | 0.000765 | −0.96834 |
| CCMM | 157 | 4.31E − 06 | 4.73E − 07 | 0.96026 |
| CCMN | 3758 | 0.000103 | 0.000362 | −0.5452 |
| CCMO | 6511 | 0.000179 | 0.000407 | −0.35687 |
| CCMS | 2320 | 6.37E − 05 | 1.07E − 05 | 0.776892 |
| CCMX | 15 | 4.12E − 07 | 1.61E − 06 | −0.591 |
| CCNN | 1871781 | 0.051413 | 0.069412 | −0.13036 |
| CCNO | 8544461 | 0.234696 | 0.155892 | 0.177683 |
| CCNS | 128008 | 0.003516 | 0.004082 | −0.06485 |
| CCNX | 2159 | 5.93E − 05 | 0.000616 | −1.01632 |
| CCOO | 3686844 | 0.101269 | 0.087528 | 0.063328 |
| CCOS | 205846 | 0.005654 | 0.004584 | 0.091103 |
| CCOX | 4995 | 0.000137 | 0.000691 | −0.7024 |
| CCSS | 15467 | 0.000425 | 6.00E − 05 | 0.849914 |
| CCSX | 148 | 4.07E − 06 | 1.81E − 05 | −0.64875 |
| CCXX | 161 | 4.42E − 06 | 1.37E − 06 | 0.510349 |
| CMMM | 29 | 7.97E − 07 | 2.21E − 10 | 3.557768 |
| CMMN | 164 | 4.50E − 06 | 2.54E − 07 | 1.249604 |
| CMMO | 293 | 8.05E − 06 | 2.85E − 07 | 1.451272 |
| CMMS | 665 | 1.83E − 05 | 7.46E − 09 | 3.389144 |
| CMMX | 1 | 2.75E − 08 | 1.12E − 09 | 1.38783 |
| CMNN | 2643 | 7.26E − 05 | 9.72E − 05 | −0.12663 |
| CMNO | 7243 | 0.000199 | 0.000218 | −0.0402 |
| CMNS | 2610 | 7.17E − 05 | 5.72E − 06 | 1.098444 |
| CMNX | 30 | 8.24E − 07 | 8.62E − 07 | −0.01957 |
| CMOO | 9551 | 0.000262 | 0.000123 | 0.33061 |
| CMOS | 1041 | 2.86E − 05 | 6.42E − 06 | 0.648899 |
| CMOX | 77 | 2.12E − 06 | 9.68E − 07 | 0.339447 |
| CMSS | 2052 | 5.64E − 05 | 8.40E − 08 | 2.826573 |
| CMSX | 13 | 3.57E − 07 | 2.53E − 08 | 1.148817 |
| CMXX | 6 | 1.65E − 07 | 1.91E − 09 | 1.935563 |
| CNNN | 122810 | 0.003373 | 0.012414 | −0.56586 |
| CNNO | 2117811 | 0.058171 | 0.041821 | 0.143315 |
| CNNS | 16884 | 0.000464 | 0.001095 | −0.37318 |
| CNNX | 631 | 1.73E − 05 | 0.000165 | −0.97912 |
| CNOO | 2981894 | 0.081906 | 0.046962 | 0.241565 |
| CNOS | 99630 | 0.002737 | 0.00246 | 0.04635 |
| CNOX | 2400 | 6.59E − 05 | 0.000371 | −0.75032 |
| CNSS | 4318 | 0.000119 | 3.22E − 05 | 0.56619 |
| CNSX | 38 | 1.04E − 06 | 9.71E − 06 | −0.96883 |
| CNXX | 68 | 1.87E − 06 | 7.33E − 07 | 0.406432 |
| COOO | 683049 | 0.018762 | 0.017579 | 0.028291 |
| COOS | 38976 | 0.001071 | 0.001381 | −0.11057 |
| COOX | 24064 | 0.000661 | 0.000208 | 0.50151 |
| COSS | 4524 | 0.000124 | 3.62E − 05 | 0.536074 |
| COSX | 64 | 1.76E − 06 | 1.09E − 05 | −0.79279 |
| COXX | 84 | 2.31E − 06 | 8.23E − 07 | 0.447847 |
| CSSS | 320 | 8.79E − 06 | 3.16E − 07 | 1.44474 |
| CSSX | 5 | 1.37E − 07 | 1.43E − 07 | −0.01705 |
| CSXX | 4 | 1.10E − 07 | 2.15E − 08 | 0.707545 |
| CXXX | 12 | 3.30E − 07 | 1.08E − 09 | 2.483295 |
| MMMM | 83 | 2.28E − 06 | 3.86E − 14 | 7.771426 |
| MMMN | 42 | 1.15E − 06 | 5.92E − 11 | 4.290048 |
| MMMO | 31 | 8.51E − 07 | 6.64E − 11 | 4.107805 |
| MMMS | 379 | 1.04E − 05 | 1.74E − 12 | 6.777 |
| MMMX | 0 | 0 | 2.62E − 13 | — |
| MMNN | 85 | 2.33E − 06 | 3.40E − 08 | 1.836638 |
| MMNO | 113 | 3.10E − 06 | 7.64E − 08 | 1.608913 |
| MMNS | 364 | 1.00E − 05 | 2.00E − 09 | 3.698853 |
| MMNX | 0 | 0 | 3.02E − 10 | — |
| MMOO | 320 | 8.79E − 06 | 4.29E − 08 | 2.311659 |
| MMOS | 104 | 2.86E − 06 | 2.25E − 09 | 3.104429 |
| MMOX | 3 | 8.24E − 08 | 3.39E − 10 | 2.386025 |
| MMSS | 254 | 6.98E − 06 | 2.94E − 11 | 5.375177 |
| MMSX | 2 | 5.49E − 08 | 8.87E − 12 | 3.791851 |
| MMXX | 0 | 0 | 6.69E − 13 | — |
| MNNN | 1048 | 2.88E − 05 | 8.69E − 06 | 0.520184 |
| MNNO | 1323 | 3.63E − 05 | 2.93E − 05 | 0.093906 |
| MNNS | 562 | 1.54E − 05 | 7.67E − 07 | 1.303999 |
| MNNX | 6 | 1.65E − 07 | 1.16E − 07 | 0.153922 |
| MNOO | 4193 | 0.000115 | 3.29E − 05 | 0.544515 |
| MNOS | 352 | 9.67E − 06 | 1.72E − 06 | 0.74942 |
| MNOX | 31 | 8.51E − 07 | 2.60E − 07 | 0.515747 |
| MNSS | 793 | 2.18E − 05 | 2.25E − 08 | 2.985098 |
| MNSX | 5 | 1.37E − 07 | 6.80E − 09 | 1.305273 |
| MNXX | 9 | 2.47E − 07 | 5.13E − 10 | 2.683083 |
| MOOO | 5790 | 0.000159 | 1.23E − 05 | 1.111435 |
| MOOS | 167 | 4.59E − 06 | 9.67E − 07 | 0.676269 |
| MOOX | 171 | 4.70E − 06 | 1.46E − 07 | 1.508056 |
| MOSS | 211 | 5.80E − 06 | 2.53E − 08 | 2.359752 |
| MOSX | 4 | 1.10E − 07 | 7.64E − 09 | 1.158007 |
| MOXX | 55 | 1.51E − 06 | 5.76E − 10 | 3.418848 |
| MSSS | 62 | 1.70E − 06 | 2.21E − 10 | 3.8869 |
| MSSX | 2 | 5.49E − 08 | 1.00E − 10 | 2.739925 |
| MSXX | 0 | 0 | 1.51E − 11 | — |
| MXXX | 16 | 4.39E − 07 | 7.58E − 13 | 5.763152 |
| NNNN | 5639 | 0.000155 | 0.000833 | −0.7304 |
| NNNO | 60175 | 0.001653 | 0.00374 | −0.35461 |
| NNNS | 538 | 1.48E − 05 | 9.79E − 05 | −0.82132 |
| NNNX | 39 | 1.07E − 06 | 1.48E − 05 | −1.13953 |
| NNOO | 384854 | 0.010571 | 0.006299 | 0.224828 |
| NNOS | 6209 | 0.000171 | 0.00033 | −0.28656 |
| NNOX | 354 | 9.72E − 06 | 4.98E − 05 | −0.70907 |
| NNSS | 319 | 8.76E − 06 | 4.32E − 06 | 0.307157 |
| NNSX | 6 | 1.65E − 07 | 1.30E − 06 | −0.898 |
| NNXX | 7 | 1.92E − 07 | 9.83E − 08 | 0.29148 |
| NOOO | 227156 | 0.006239 | 0.004716 | 0.121592 |
| NOOS | 11871 | 0.000326 | 0.00037 | −0.05545 |
| NOOX | 3214 | 8.83E − 05 | 5.59E − 05 | 0.198618 |
| NOSS | 951 | 2.61E − 05 | 9.70E − 06 | 0.430162 |
| NOSX | 13 | 3.57E − 07 | 2.93E − 06 | −0.9136 |
| NOXX | 66 | 1.81E − 06 | 2.21E − 07 | 0.914541 |
| NSSS | 35 | 9.61E − 07 | 8.47E − 08 | 1.055088 |
| NSSX | 0 | 0 | 3.83E − 08 | — |
| NSXX | 0 | 0 | 5.78E − 09 | — |
| NXXX | 3 | 8.24E − 08 | 2.91E − 10 | 2.452665 |
| OOOO | 61473 | 0.001689 | 0.001324 | 0.105657 |
| OOOS | 5019 | 0.000138 | 0.000139 | −0.00255 |
| OOOX | 9614 | 0.000264 | 2.09E − 05 | 1.101242 |
| OOSS | 331 | 9.09E − 06 | 5.45E − 06 | 0.222484 |
| OOSX | 45 | 1.24E − 06 | 1.64E − 06 | −0.12365 |
| OOXX | 144 | 3.96E − 06 | 1.24E − 07 | 1.504034 |
| OSSS | 38 | 1.04E − 06 | 9.51E − 08 | 1.040448 |
| OSSX | 3 | 8.24E − 08 | 4.30E − 08 | 0.282172 |
| OSXX | 0 | 0 | 6.49E − 09 | — |
| OXXX | 5 | 1.37E − 07 | 3.26E − 10 | 2.624158 |
| SSSS | 11 | 3.02E − 07 | 6.23E − 10 | 2.686034 |
| SSSX | 0 | 0 | 3.76E − 10 | — |
| SSXX | 0 | 0 | 8.50E − 11 | — |
| SXXX | 0 | 0 | 8.55E − 12 | — |
| XXXX | 0 | 0 | 3.22E − 13 | — |
4.2. Application: Target-Ligand Binding Affinity Prediction
The four-body potential derived in the previous section can be used to calculate the energy of any macromolecular structure. First, the 3D atomic coordinates of the structure are each labeled using the 6-letter alphabet and those points are tessellated subject to a 12 Å cutoff, then each tetrahedron in the tessellation is scored according to the atomic quadruplet identified at its four vertices by referring to the four-body potential previously derived in Table 8, and finally, the scores of all the tetrahedra are added up to determine the energy of the structure. Using the notation tp (i.e., total potential) to refer to the energy of a structure calculated in this way, we empirically calculate target-ligand binding affinity in the following manner (Figure 4):
-
(1)
Tessellate the entire macromolecular complex and calculate tpcomplex.
-
(2)
Tessellate only atomic coordinates for the target protein and calculate tptarget.
-
(3)The calculated target-ligand binding affinity is given by the difference
(4)
The above formula is a simplified model that is valid in the case of small ligands for which tetrahedra formed at the protein interface dominate any purely internal quadruplet atomic interactions within the ligand; hence, the relative energy contribution of the ligand is negligible [37].
Figure 4.

Visualization of a procedure based on a simplified model to calculate target-ligand binding affinity (Δtp) with the four-body potential.
4.3. Example: Predicting HIV-1 Protease-Inhibitor Binding Energy
To validate the approach for empirically calculating binding affinity, PDB accession codes and experimental binding energies were obtained from Jenwitheesuk and Samudrala [25] for twenty-five HIV-1 protease-inhibitor complexes (Table 9); they converted experimental inhibition constants (Ki) to experimental binding energies (ΔG0, Gibbs free energy of binding, in units of kcal/mol) by applying the equation ΔG0 = −RTln(Ki), where R is the gas constant (1.987 cal K−1 mol−1) and T is the absolute temperature (room temperature, 300 K). By following the steps outlined in the previous section, we determined Δtp for each of these complexes and used it as the calculated binding energy. As shown in Figure 5, the experimental and calculated binding energies for these complexes were highly correlated (r2 = 0.72). From a subsequent search of the Binding MOAD database [26, 27], we identified 115 additional HIV-1 protease-inhibitor complexes with experimental structures in PDB, for which experimental inhibition constants are available (Table 9). As before, Δtp values were obtained and used for representing the calculated binding energy, and Ki values were converted to experimental binding energies. The correlation remained robust (r2 = 0.64) when these data were combined with those of the initial plot (Figure 5).
Table 9.
PDB accession codes for 140 HIV-1 protease-inhibitor complexes.
| Twenty-five complexes culled from Jenwitheesuk and Samudrala [25] | ||||||||||||
| 1gno | 1hbv | 1hef | 1heg | 1hih | 1hiv | 1hps | 1hpv | 1hte | 1htf | 1htg | 1hvi | 1hvj |
| 1hvk | 1hvl | 1hvr | 1hvs | 1pro | 1sbg | 2upj | 4hvp | 4phv | 5hvp | 8hvp | 9hvp | |
|
| ||||||||||||
| An additional 115 complexes obtained from the Binding MOAD database [26, 27] | ||||||||||||
| 1a30 | 1a8g | 1a8k | 1a94 | 1a9m | 1ajv | 1b6j | 1b6k | 1b6m | 1b6p | 1c70 | 1d4h | 1d4i |
| 1d4k | 1d4l | 1daz | 1dmp | 1dw6 | 1ebk | 1ebw | 1eby | 1ebz | 1ec1 | 1ec2 | 1ec3 | 1fej |
| 1ff0 | 1fff | 1ffi | 1fg8 | 1fgc | 1fqx | 1g2k | 1g35 | 1gnm | 1gnn | 1hpo | 1hsg | 1hwr |
| 1hxb | 1iiq | 1izh | 1k1t | 1k1u | 1k2b | 1k2c | 1k6p | 1k6v | 1lzq | 1m0b | 1met | 1mrx |
| 1msn | 1mtr | 1nh0 | 1odw | 1ody | 1ohr | 1qbr | 1qbs | 1qbt | 1qbu | 1sdu | 1t7k | 1tcx |
| 1vij | 1vik | 1z1h | 1zj7 | 1zlf | 1zp8 | 1zpa | 2aod | 2aog | 2aqu | 2avm | 2avo | 2bpv |
| 2bqv | 2cem | 2cen | 2f3k | 2f80 | 2fgu | 2idw | 2ien | 2ieo | 2nxd | 2nxl | 2nxm | 2o4s |
| 2p3b | 2psu | 2psv | 2pym | 2pyn | 2q54 | 2q55 | 2q5k | 2q63 | 2qd6 | 2qd8 | 2qi1 | 2qi4 |
| 2qi7 | 2r38 | 2wkz | 2wl0 | 3bgb | 3cyw | 3cyx | 3d1x | 3d1y | 3d1z | 3d20 | ||
Figure 5.

Scatter plots of experimental versus calculated binding energy for (a) twenty-five HIV-1 protease-inhibitor complexes culled by Jenwitheesuk and Samudrala [25] and (b) a larger set of 140 such complexes which include the initial twenty-five, with the remainder obtained by searching the Binding MOAD database [26, 27]. Both experimental binding energies and crystallographic structures are available for these complexes, and the latter were required for calculating binding energy (Δts) as outlined in the text and in Figure 4.
5. Conclusion
In this study, we derived and evaluated twelve distinct atomic four-body knowledge-based statistical potentials for protein structure prediction, by altering two parameter values: atom type (4-, 8-, or 20-letter alphabets) and distance cutoff for atomic interactions (none, 12 Å, 8 Å, or 4.8 Å). The best potential employed a simple 4-letter atomic alphabet and considered any quadruplet of atoms to be interacting when they were all pairwise within 12 Å of each other. In a head-to-head comparison of methods using 129 benchmarks from the Decoys-‘R'-Us database, our potential ranked 3rd and was outperformed by only two out of twelve other state-of-the-art methods. In addition to its simplicity and relative accuracy, our method is faster and more efficient in general, with some of the other physics- and knowledge-based potentials used for comparison employing well over one hundred different atom types. Future plans for improvement include combining this four-body potential together with other knowledge-based potentials, as well as subsequently implementing them together in conjunction with statistical machine learning tools.
Conflicts of Interest
The author declares that there are no conflicts of interest regarding the publication of this paper.
References
- 1.Berman H., Henrick K., Nakamura H., Markley J. L. The worldwide protein data bank (wwPDB): ensuring a single, uniform archive of PDB data. Nucleic Acids Research. 2007;35(supplement 1):D301–D303. doi: 10.1093/nar/gkl971. [DOI] [PMC free article] [PubMed] [Google Scholar]
- 2.Rykunov D., Fiser A. New statistical potential for quality assessment of protein models and a survey of energy functions. BMC Bioinformatics. 2010;11, article 128 doi: 10.1186/1471-2105-11-128. [DOI] [PMC free article] [PubMed] [Google Scholar]
- 3.Summa C. M., Levitt M., DeGrado W. F. An atomic environment potential for use in protein structure prediction. Journal of Molecular Biology. 2005;352(4):986–1001. doi: 10.1016/j.jmb.2005.07.054. [DOI] [PubMed] [Google Scholar]
- 4.Zhang C., Liu S., Zhou H., Zhou Y. An accurate, residue-level, pair potential of mean force for folding and binding based on the distance-scaled, ideal-gas reference state. Protein Science. 2004;13(2):400–411. doi: 10.1110/ps.03348304. [DOI] [PMC free article] [PubMed] [Google Scholar]
- 5.Rykunov D., Fiser A. Effects of amino acid composition, finite size of proteins, and sparse statistics on distance-dependent statistical pair potentials. Proteins: Structure, Function and Genetics. 2007;67(3):559–568. doi: 10.1002/prot.21279. [DOI] [PubMed] [Google Scholar]
- 6.Ferrada E., Melo F. Effective knowledge-based potentials. Protein Science. 2009;18(7):1469–1485. doi: 10.1002/pro.166. [DOI] [PMC free article] [PubMed] [Google Scholar]
- 7.Johansson K. E., Hamelryck T. A simple probabilistic model of multibody interactions in proteins. Proteins: Structure, Function and Bioinformatics. 2013;81(8):1340–1350. doi: 10.1002/prot.24277. [DOI] [PubMed] [Google Scholar]
- 8.de Berg M., Cheong O., van Kreveld M., Overmars M. Computational Geometry: Algorithms and Applications. Third. Berlin, Germany: Springer-Verlag; 2008. [DOI] [Google Scholar]
- 9.Sippl M. J. Boltzmann's principle, knowledge-based mean fields and protein folding. n approach to the computational determination of protein structures. Journal of Computer-Aided Molecular Design. 1993;7(4):473–501. doi: 10.1007/BF02337562. [DOI] [PubMed] [Google Scholar]
- 10.Sippl M. J. Knowledge-based potentials for proteins. Current Opinion in Structural Biology. 1995;5(2):229–235. doi: 10.1016/0959-440X(95)80081-6. [DOI] [PubMed] [Google Scholar]
- 11.Carter C. W., Jr., Lefebvre B. C., Cammer S. A., Tropsha A., Edgell M. H. Four-body potentials reveal protein-specific correlations to stability changes caused by hydrophobic core mutations. Journal of Molecular Biology. 2001;311(4):625–638. doi: 10.1006/jmbi.2001.4906. [DOI] [PubMed] [Google Scholar]
- 12.Krishnamoorthy B., Tropsha A. Development of a four-body statistical pseudo-potential to discriminate native from non-native protein conformations. Bioinformatics. 2003;19(12):1540–1548. doi: 10.1093/bioinformatics/btg186. [DOI] [PubMed] [Google Scholar]
- 13.Masso M., Vaisman I. I. Accurate prediction of enzyme mutant activity based on a multibody statistical potential. Bioinformatics. 2007;23(23):3155–3161. doi: 10.1093/bioinformatics/btm509. [DOI] [PubMed] [Google Scholar]
- 14.Masso M., Vaisman I. I. AUTO-MUTE: Web-based tools for predicting stability changes in proteins due to single amino acid replacements. Protein Engineering, Design and Selection. 2010;23(8):683–687. doi: 10.1093/protein/gzq042. [DOI] [PubMed] [Google Scholar]
- 15.Masso M., Vaisman I. I. AUTO-MUTE 2.0: a portable framework with enhanced capabilities for predicting protein functional consequences upon mutation. Advances in Bioinformatics. 2014;2014 doi: 10.1155/2014/278385.278385 [DOI] [PMC free article] [PubMed] [Google Scholar]
- 16.Singh R. K. Delaunay tessellation of proteins: Four body nearest-neighbor propensities of amino acid residues. Journal of Computational Biology. 1996;3(2):213–221. doi: 10.1089/cmb.1996.3.213. [DOI] [PubMed] [Google Scholar]
- 17.Samudrala R., Levitt M. Decoys 'R' Us: a database of incorrect conformations to improve protein structure prediction. Protein Science. 2000;9(7):1399–1401. doi: 10.1110/ps.9.7.1399. [DOI] [PMC free article] [PubMed] [Google Scholar]
- 18.Fogolari F., Pieri L., Dovier A., et al. Scoring predictive models using a reduced representation of proteins: Model and energy definition. BMC Structural Biology. 2007;7, article no. 15 doi: 10.1186/1472-6807-7-15. [DOI] [PMC free article] [PubMed] [Google Scholar]
- 19.Weiner S. J., Kollman P. A., Case D. A., et al. A new force field for molecular mechanical simulation of nucleic acids and proteins. Journal of the American Chemical Society. 1984;106(3):765–784. doi: 10.1021/ja00315a051. [DOI] [Google Scholar]
- 20.Brooks B. R., Bruccoleri R. E., Olafson B. D., States D. J., Swaminathan S., Karplus M. CHARMM: a program for macromolecular energy, minimization, and dynamics calculations. Journal of Computational Chemistry. 1983;4(2):187–217. doi: 10.1002/jcc.540040211. [DOI] [Google Scholar]
- 21.Delarue M., Koehl P. Atomic environment energies in proteins defined from statistics of accessible and contact surface areas. Journal of Molecular Biology. 1995;249(3):675–690. doi: 10.1006/jmbi.1995.0328. [DOI] [PubMed] [Google Scholar]
- 22.Koehl P., Delarue M. Polar and nonpolar atomic environments in the protein core: Implications for folding and binding. Proteins: Structure, Function, and Bioinformatics. 1994;20(3):264–278. doi: 10.1002/prot.340200307. [DOI] [PubMed] [Google Scholar]
- 23.Samudrala R., Moult J. An all-atom distance-dependent conditional probability discriminatory function for protein structure prediction. Journal of Molecular Biology. 1998;275(5):895–916. doi: 10.1006/jmbi.1997.1479. [DOI] [PubMed] [Google Scholar]
- 24.Zhou H., Zhou Y. Distance-scaled, finite ideal-gas reference state improves structure-derived potentials of mean force for structure selection and stability prediction. Protein Science. 2002;11(11):2714–2726. doi: 10.1110/ps.0217002. [DOI] [PMC free article] [PubMed] [Google Scholar]
- 25.Jenwitheesuk E., Samudrala R. Improved prediction of HIV-1 protease-inhibitor binding energies by molecular dynamics simulations. BMC Structural Biology. 2003;3(2) doi: 10.1186/1472-6807-3-2. [DOI] [PMC free article] [PubMed] [Google Scholar]
- 26.Benson M. L., Smith R. D., Khazanov N. A., et al. Binding MOAD, a high-quality protein-ligand database. Nucleic Acids Research. 2008;36(1):D674–D678. doi: 10.1093/nar/gkm911. [DOI] [PMC free article] [PubMed] [Google Scholar]
- 27.Hu L., Benson M. L., Smith R. D., Lerner M. G., Carlson H. A. Binding MOAD (Mother of All Databases) Proteins: Structure, Function and Genetics. 2005;60(3):333–340. doi: 10.1002/prot.20512. [DOI] [PubMed] [Google Scholar]
- 28.Wang G., Dunbrack R. L., Jr. PISCES: a protein sequence culling server. Bioinformatics. 2003;19(12):1589–1591. doi: 10.1093/bioinformatics/btg224. [DOI] [PubMed] [Google Scholar]
- 29.Brualdi R. A. Introductory Combinatorics. 3rd. New Jersey, NJ, USA: Prentice Hall; 1999. [Google Scholar]
- 30.Barber C. B., Dobkin D. P., Huhdanpaa H. The quickhull algorithm for convex hulls. Association for Computing Machinery. Transactions on Mathematical Software. 1996;22(4):469–483. doi: 10.1145/235815.235821. [DOI] [Google Scholar]
- 31.Pettersen E. F., Goddard T. D., Huang C. C., et al. UCSF Chimera—a visualization system for exploratory research and analysis. Journal of Computational Chemistry. 2004;25(13):1605–1612. doi: 10.1002/jcc.20084. [DOI] [PubMed] [Google Scholar]
- 32.Mitchell J. B. O., Laskowski R. A., Alex A., Thornton J. M. BLEEP - potential of mean force describing protein-ligand interactions: I. Generating potential. Journal of Computational Chemistry. 1999;20(11):1165–1176. doi: 10.1002/(SICI)1096-987X(199908)20:11<1165::AID-JCC7>3.3.CO;2-1. [DOI] [Google Scholar]
- 33.Dong G. Q., Fan H., Schneidman-Duhovny D., Webb B., Sali A., Tramontano A. Optimized atomic statistical potentials: assessment of protein interfaces and loops. Bioinformatics. 2013;29(24):3158–3166. doi: 10.1093/bioinformatics/btt560. [DOI] [PMC free article] [PubMed] [Google Scholar]
- 34.O'Meara M. J., Leaver-Fay A., Tyka M. D., et al. Combined covalent-electrostatic model of hydrogen bonding improves structure prediction with Rosetta. Journal of Chemical Theory and Computation. 2015;11(2):609–622. doi: 10.1021/ct500864r. [DOI] [PMC free article] [PubMed] [Google Scholar]
- 35.Park B., Levitt M. Energy functions that discriminate X-ray and near-native folds from well-constructed decoys. Journal of Molecular Biology. 1996;258(2):367–392. doi: 10.1006/jmbi.1996.0256. [DOI] [PubMed] [Google Scholar]
- 36.Xia Y., Levitt M. Extracting knowledge-based energy functions from protein structures by error rate minimization: Comparison of methods using lattice model. Journal of Chemical Physics. 2000;113(20):9318–9330. doi: 10.1063/1.1320823. [DOI] [Google Scholar]
- 37.Masso M. Four-body atomic potential for modeling protein-ligand binding affinity: Application to enzyme-inhibitor binding energy prediction. BMC Structural Biology. 2013;13(1, article no. S1) doi: 10.1186/1472-6807-13-S1-S1. [DOI] [PMC free article] [PubMed] [Google Scholar]