

Abstract
Objectives
This study evaluated the effects of filler type and the addition of thio-urethane oligomers on light-transmission, polymerization kinetics and depth of cure of resin composites.
Methods
BisGMA:UDMA:TEGMA (5:3:2 wt%) were mixed with 0 (control) or 20 wt% thio-urethane. Fillers with various sizes and refractive indices were included and refractive index (RI) measured. Unfilled resins were used as controls. The RIs of materials were measured before and after polymerization. The irradiance reaching the bottom of 3-mm thick specimens was measured during the polymerization. Degree of conversion to a depth of 5 mm was mapped. An optical bench was used to simultaneously follow conversion and light transmission.
Results
The addition of thio-urethane increased the RI for all composites. As expected, RI also increased with conversion for all materials. The one exception was for the material filled with OX-50, in which the RI of the composite decreased with conversion. In this case, the irradiance at the bottom of the 3 mm specimen was also the lowest among all groups. The addition of thio-utethanes had only minimal effect on light transmission within a filler type, but led to increased conversion in depth for all groups. The filler type itself had a greater effect on light transmission, and that correlated well with the degree of conversion.
Significance
The effect of the Thio-urethane addition on degree of conversion in depth was dependent on filler type. The additive can be tailored to improve the RI match with the filler to optimize light transmission in dental composites.
Keywords: Pre-polymerized additives, Resin composite, Polymerization
Graphical Abstract
1. Introduction
The vast majority of posterior restorations is performed using direct resin composites, with an annual failure rate of around 2%, resulting in cumulative survival values of as high as 60% after 20 years follow-up [1]. The expansion in use of composites to restore posterior teeth is mainly due to a significant improvement in wear behavior and general mechanical properties, which allowed this material to be applied in high load bearing zones [2]. However, there are still many drawbacks that prevent composite restorations from surviving longer than an average of 10 years [4], failing mainly due to secondary caries and fracture [1–4]. One drawback is the polymerization stress that develops at the interface [5], as well as the comparatively lower fracture toughness of these materials in relation to metal- and ceramic-based restorations [6]. Importantly, the mechanical properties are directly correlated to the degree of conversion, which in turn depends on sufficient amount of light reaching all areas of the restoration [7,8]. For that reason, manufacturers recommend curing the composite in increments no thicker than 2 mm. An additional reason to place the composite in increments is to decrease the C-factor within each increment, which in theory would reduce polymerization stress [5]. This incremental requirement makes the placement of composite restorations extremely time-consuming, especially in large preparations, and is also the source of significant variation among clinicians.
Recently, the use of bulk-fill composites has increased among clinicians, with increments up to 4-mm being usually recommended, reportedly without compromise to the polymerization of composite or changes to the stress development compared with the traditional incremental technique [9, 10]. Those materials are specially formulated with higher concentration of or more efficient photoinitiator systems, and/or with reduced filler content [11]. Previous studies have indeed demonstrated that the effectiveness of bulk-fill composites in promoting curing in depth is material-dependent [10]. For those materials, the changes in formulation do not include the monomer systems [for the most part], and the increased translucency is commonly achieved changing the filler size and/or pigments. Then, the influence of the refractive index mismatch between the lower RI organic and higher RI inorganic phases is not addressed. The greater the mismatch, the more light scattering takes place, and according to Monte Carlo theory, the lesser the light penetration through the depth of the material [12]. For several composites, this mismatch is more marked at the beginning of the polymerization reaction, and tends to decrease as conversion increases because the RI of the organic matrix increases as the process progresses [13]. One strategy, therefore, to minimize light scattering and consequently increase photon penetration depth is to have the refractive indices of both phases [organic and inorganic] be as close as possible at the beginning of the polymerization [14]. Since the refractive index of the filler is generally higher than the organic matrix, the use of compounds with higher refractive index in the organic matrix can be advocated. Some moieties, such as aromatic rings, urethane linkages and thiols, are known to increase the refractive index of organic compounds [15].
Thio-urethane oligomers, recently proposed as additives in resin composites, can be tailored to present several features that increase refractive index. These oligomers have been shown to produce networks with significantly improved fracture toughness and reduced polymerization stress, while at the same time achieving high conversion using the same procedures clinicians use to polymerize composites in practice [16–19]. The additional potential to minimize the mismatch with the inorganic filler phase in dental composites has not been investigated thus far. Therefore, this study proposes to investigate the influence of thio-urethane additives on the refractive index, polymerization kinetics, light transmission and depth of cure of resin composites as a function of filler type. The null hypothesis is that the thio-urethanes will now affect any of these parameters.
2. Material and Methods
2.1 Composite formulations
BisGMA (Bis-phenol A diglycidyl dimethacrylate), UDMA (urethane dimethacrylate), and TEGDMA (tri-ethylene glycol dimethacrylate), all from Esstech (Essington, PA, USA), were mixed in 50/30/20 wt% ratio. Thio-urethane oligomer was synthesized in solution (methylene chloride) by combining 1,3-bis(1-isocyanato-1-methylethyl) benzene with trimethylol-tris-3-mercaptopropionate, at 1:2 isocyanate:thiol molar ratio, leaving pendant thiols. The reaction was catalyzed by addition of Triethylamine and the thio-urethane was purified by precipitation in hexanes and rotaevaporation. The thio-urethane synthesized was added to the monomer mixture at a concentration of 20 wt% to produce the experimental matrix. No thio-urethane containing materials were used as the control. The photoinitiator 2,2-Dimethoxy-2-phenylacetophenone (DMPA) was added to 0.1 wt%, and 0.5 wt% of BHT (2,6-di-tert-butyl-4-methylphenol) was used as the inhibitor. Photoinitiator and inhibitor were obtained from SigmaAldrich (St. Louis, MO, USA). For each matrix, four composites were formulated varying the type of filler (Table 1), while neat resin was used as control. Fillers with average particle sizes of 0.05, 0.08 and 0.11 μm and refractive index of 1.54 (higher than the initial refractive index of the organic matrix) were added at 40 wt%. 0.05 μm average particle size colloidal silica (OX50), with refractive index of 1.45 (lower than the initial refractive index of the organic matrix) was added at 20 wt% due to excessive viscosity increase. This last material was only used for comparison with the neat resin in the statistical analysis.
Table 1.
Manufacturer information for the fillers used in the study.
| Filler | Manufacturer | Lot number | Composition* | Shape* | Filler size* | Refractive index* |
|---|---|---|---|---|---|---|
| SG-YBF100 (YBF100) | Sukgyung AT. Co. Ltda Ansa City, Korea | SG – UWNCNCP9 | Ytterbium Fluoride | Almost spherical | 0.11 μm | 1.54 |
| SG-YBG700GBF (YBG700) | Sukgyung AT. Co. Ltda Ansa City, Korea | SG – UWNCZXJ1 | Radiopaque Ba glass | Almost spherical | 0.08 μm | 1.54 |
| SG-YBF40-4-402 (YBF402) | Sukgyung AT. Co. Ltda Ansa City, Korea | SG – UCNAUEV9 | Ytterbium Fluoride | Almost spherical | 0.05 μm | 1.54 |
| Aerosil OX50 (OX50) | Evonik Degussa Corp. Parssippany, NJ, USA | 7631-80-9 | Fumed amorphous silica | Spherical | 0.04 μm | 1.45 |
Data provided by manufacturers.
2.2 Refractive index
The unpolymerized materials were placed over the horizontal main prism of an Abbe-type refractometer (Ningbo Gamry Optical Instrument Co., Shanghai, China) with refractive index scale ranging from 1300 to 1700, and precision of 0.0003. Polymer films were built between two polyester strips, photoactivated with a mercury arc lamp (Acticure 4000, Electro-Optical Engineering Inc., Montreal, Canada) for 5 minutes at 320 mW/cm2 (320–500 nm). 1-bromonaphthalene was used as a high refractive index interfacial contact agent to allow the refractive index reading of polymer films. Refractive index readings were obtained at room temperature at triplicate. For the isolated fillers, the refractive index values provided by the manufacturers were used.
2.3 Light-transmission through 3 mm specimens (measured with UV-Vis spectrophotometer)
Unpolymerized materials were inserted into silicon molds (3.0 mm of diameter, 3.0 mm of depth) between two polyester strips and then, placed over the top surface sensor of a portable spectrometer-based instrument (CheckMARC, BlueLight Analytics, Halifax, NS, Canada). The tip of light-curing device (Acticure 4000 was positioned 7 mm away from the upper surface of sample and the photo-activation was performed for 70 s) with 320 mW/cm2 (320–500 nm) reaching the surface of the specimen. This was done for several practical reasons: 1. to avoid heating concerns on the surface of the specimen, which would have affected the conversion; 2. to account for any inhomogeneity in the emission profile from the light guide, and 3. to allow for similar conditions of photoactivation to be achieved in the several test set-up geometries used in this study. During the entire time of photoactivation, the irradiance of light reaching the sensor through the 3-mm thickness of the material was recorded (n=3). The irradiance of light emitted ranging from 360 to 540 nm was recorded.
2.4 Light-transmission x Polymerization kinetics (0.8 mm specimens, measured with the optical bench)
An optical bench was set-up to allow the assessment of the degree of conversion and light-transmission simultaneously during polymerization on the same specimen, using methods described previously [13]. The unpolymerized material was inserted in silicone rubber molds (n =3; diameter = 6 mm; thickness = 0.8 mm) between two glass slides, fixed to a holder onto the optical bench. To collect IR spectra data, the NIR signal (Thermo Nicolet 6700, Thermo Scientific, Pittsburgh, PA, USA) was focused via fiber optics through condensing lens through the specimen and back into the NIR return fiber through a refocusing lens attached to spectrometer. The materials were photoactivated (according to previous description) for 5 minutes, while the light intensity emitted by device and transmitted through the specimen was recorded using a calibrated neutral density filter into the UV/Vis fiber optic inlet (USB 2000, Ocean Optics, Dunedin, FL, USA). Wavelengths of 365, 405 and 435 nm were followed during all photoactivation period. Methacrylate conversion in real time was calculate by following the vinyl overtone at 6,165 cm−1 with 2 scans/spectrum, 4 cm−1 resolution and >2 Hz data acquisition rate during the 5 minutes of experiment time. The polymerization rate (Rp) was calculated as the first derivative of the conversion vs. time curve.
2.5 Depth of polymerization
The materials were inserted into silicon mold (2 mm long × 2 mm wide × 5 mm thick) and covered with a glass slide, then the photoactivation was performed for 5 minutes according to previous description (n=3). The dimensions (4 mm2 of surface area) of specimens was chosen to ensure that the entire specimen would be covered by the light spot size. Afterwards, the specimen was removed from the mold and embedded into gypsum blocks. The blocks were sectioned using a cutting machine Accutom-5 (Struers, Cleveland, OH) using a diamond disc to obtain 0.4 mm thick slices parallel to the long axis of the specimen. The slices were positioned over the platform of the IR microscope (Nicolet Continuμm FTIR Microscope) connected to the spectrometer. Degree of conversion in depth was mapped using the motorized stage through the 5 mm length in transmission. Spectra were collected in 500-μm steps (aperture of 100 μm, 32 scans/spectrum, 4 cm−1 resolution), totaling 10 levels of measurement per specimen. Conversion was calculated taking into account the vinyl peak area at 6165 cm−1 normalized by an internal reference (aromatic peak area at 4625 cm−1). The spectrum of unpolymerized material was also collected on a different specimen. For each specimen, three spectra were collected at each depth, and the average of DC at each level was used in the statistical analysis.
2.6 Statistical analysis
Normal distribution of data was assessed by Shapiro-Wilk test and Levene’s method was used to analyze the presence of equal variance. Data from RI were subjected to 3-way ANOVA (factors: ‘presence of thio-urethane’, ‘filler type’, and ‘polymerization’). Data for irradiance, degree of conversion and Rpmax were individually analyzed with 2-way ANOVA (factors: ‘presence of thio-urethane’ and ‘filler type’). Data for DC according to depth were analyzed with 2-way Repeated Measure ANOVA. For all statistical analyses, YBF/YGB fillers were not compared to OX50 due differences in filler content. Multiple comparisons were performed using Tukey’s test with a significance level set at 95%.
3. Results
3.1 Refractive index and Irradiance at the bottom of 3 mm specimen (measured with MARC)
The results of refractive index and irradiance are presented in Table 2. Statistical analyses (OX50 versus neat resin; and other fillers and neat resin), demonstrated that the ‘presence of thio-urethane’ (p < 0.001), ‘filler type’ (p < 0.001), and ‘polymerization’ (p < 0.001) affects the RI. However, the effect of filler on RI depends on its interaction with ‘presence of thio-urethane’ (p = 0.029 for OX50; p < 0.001 for other fillers). The interaction between ‘filler’ and ‘polymerization’ was significant only YBF and YGB fillers were evaluated (p < 0.001), but not for OX50 (p = 0.080). On the other hand, the interaction between ‘presence of thio-urethane’ and ‘polymerization’ (YBF/YGB - p = 0.236; OX50 - p = 0.515), and between all factors (YBF/YGB - p = 0.159; OX50 - p = 0.822) were not significant. Variation in refractive index was not very marked, regardless of the materials. The refractive index of all materials increased with the addition of thio-urethane and after their polymerization. Neat resin materials presented lower RI than materials containing YBF/YGB fillers, and no difference was observed among these fillers when the interaction with ‘presence of thio-urethane’ was assessed. In the polymerized state, the addition of YBF100 led to increased RI, and the highest RI for unpolymerized materials was observed for YGB700. Regarding comparisons for OX50 and neat resin materials, the addition of OX50 reduced the RI irrespective of the presence of thio-urethane and polymerization.
Table 2.
Refractive index (mean, standard deviation) measured in materials modified or not with thio-urethane additive, as a function of filler type. Refractive index was assessed with and ABBE type refractometer in the unpolymerized paste, as well as in thin polymer films.
| Filler | Presence of thio-urethane | Polymerization | Monomers | |||
|---|---|---|---|---|---|---|
|
| ||||||
| Without TU | With TU | Un-polymerized | Polymerized | |||
| Neat resin | 1.517 (0.013) Bb | 1.526 (0.014) Ab | 1.509 (0.005) Bc | 1.534 (0.005) Ac | BisGMA | 1.54 |
| YBF100 | 1.528 (0.017) Ba | 1.532 (0.017) Aa | 1.515 (0.002) Bb | 1.546 (0.003) Aa | UDMA | 1.48 |
| YGB700 | 1.529 (0.013) Ba | 1.533 (0.013) Aa | 1.519 (0.002) Ba | 1.543 (0.002) Ab | TEGDMA | 1.46 |
| YBF402 | 1.527 (0.015) Ba | 1.531 (0.013) Aa | 1.517 (0.004) Bb | 1.542 (0.002) Ab | Thio-urethane | 1.53 |
|
|
||||||
| Neat resin | 1.517 (0.013) Ba | 1.526 (0.014) Aa | 1.509 (0.005) Ba | 1.534 (0.005) Aa | ||
| OX50 | 1.513 (0.011) Bb | 1.518 (0.013) Ab | 1.505 (0.003) Bb | 1.527 (0.004) Ab | ||
TU – Thio-urethane. Means followed by the same upper case letter in the same row and lower case letters within the same column are statistically similar (p > 0.05). The data for Y-series fillers and OX-50 are analyzed separately.
Results for the average irradiance measured at the bottom of 3 mm specimens at the end of a 70 sec exposure are displayed in Table 3. For statistical analysis involving YBF/YGB fillers, 2-way ANOVA demonstrated significant effect only for the factor ‘filler type’ (p < 0.001), while the p-value for the factor ‘presence of thio-urethane’ was 0.534. However, the presence of thio-urethane altered the effect of ‘filler type’ on irradiance (p < 0.001). Irrespective of the addition of thio-urethane, highest irradiance was measured for materials without filler. Among the fillers, YBF402 allowed higher light transmission, however, the irradiance measured for the material containing this filler was similar to those for YGB700 when thio-urethane was used. Only for the addition of YGB700 and materials without filler, did the use of thio-urethane affect the irradiance, reducing the values of light transmission for neat resin materials and increasing for composites with YGB700. For analysis involving OX50, 2-way ANOVA showed that both ‘filler’ (p < 0.001) and ‘presence of thio-urethane’ (p < 0.001) affected the irradiance, and the interaction was also significant (p < 0.001). The addition of thio-urethane reduced the irradiance for neat resin material and did not affected for composites with OX50. Irrespective of the presence of thio-urethane, composites containing OX50 presented lowest values of irradiance. The irradiance vs. time curves are presented in Figure 1.
Table 3.
Means (standard deviation) of the irradiance in mW/cm2 measured at the bottom of 3 mm specimens immediately after 70 s exposure at 320 mW/cm2 (reaching the top surface of the specimen). Results were obtained using the spectrophotometer (n=3).
| Filler | Without TU | With TU |
|---|---|---|
| Neat resin | 154.3 (3.1) Aa | 126.7 (3.5) Ab |
| YBF100 | 37.7 (1.5) Ca | 39.0 (2.0) Ca |
| YGB700 | 35.7 (2.3) Cb | 48.3 (2.1) Ba |
| YBF402 | 48.3 (2.3) Ba | 49.7 (0.6) Ba |
|
| ||
| Neat resin | 154.3 (3.1) Aa | 126.7 (3.5) Ab |
| OX50 | 13.7 (0.6) Ba | 10.3 (2.3) Ba |
For average of irradiance, distinct letters (uppercase for column, lowercase for line) indicate statistical difference (p < 0.05). The data for Y-series fillers and OX-50 are analyzed separately. TU – Thio-urethane.
Figure 1.

(A) Irradiance (mW/cm2) reaching the bottom of 3 mm thick specimens, measured with spectrophotometer, as a function of time. The output of the light source was 320 mW/cm2 and these curves reflect the variation in light transmission throughout the photoactivation of the different materials tested. (B) Profile of light reaching the sensor of spectrophotometer demonstrating the absolute irradiance according to wavelength. TU – Thio-urethane.
3.1 Polymerization Kinetics
The results of polymerization kinetics are displayed in Table 4. When YBF/YGB were evaluated, the factors ‘presence of thio-urethane’ (p < 0.001 for both moments of DC evaluation) and ‘filler type’ (p = 0.042 for DC at 5 min; p < 0.001 for DC after 1-week) significantly affected the DC, and the interaction between these factors was also significant (p = 0.012 for DC at 5 min; p < 0.001 for DC after 1-week). Irrespective of the moment of evaluation, unfilled materials showed the lowest DC in the presence of thio-urethane. In contrast, differences were observed for composites thio-urethane only for one week, when composites filled with YGB700 presented lower DC than those filled with YBF402. Irrespective of the moment of evaluation and the filler type, the addition of thio-urethane increased the DC. Two-way ANOVA for OX50 showed that the DC was affected by ‘presence of thio-urethane’ (p < 0.001 for both assessment times), and the effect of this factor depends on presence of filler (p = 0.004 for 5 min; p < 0.001 for 1-week). The factor ‘filler’ alone was significant only at measurement performed after 1-week (p = 0.031), whereas p = 0.366 was found for data from 5 min. The addition of thio-urethane increased the DC assessed at both times, and OX50 reduced the DC only at 1-week.
Table 4.
Polymerization kinetics parameters of 0.8 mm specimens measured in near-IR with the aid of an optical bench. Degree of conversion (mean, standard deviation in %) was measured immediately after a 5 min exposure at 320 mW/cm2 and after 1-week dry storage at room temperature in opaque containers (n=3). Maximum rate of polymerization (first derivative of conversion vs. time) was also calculated. Materials modified or not with thio-urethanes were evaluated as a function of the filler type.
| Filler | Degree of conversion (%) | Maximum rate of polymerization (%/s) | ||||
|---|---|---|---|---|---|---|
|
| ||||||
| At 5 minutes | After 1-week | |||||
|
| ||||||
| Without TU | With TU | Without TU | With TU | Without TU | With TU | |
| Neat resin | 55.6 (0.7) Bb | 67.5 (2.7) Aa | 70.8 (0.7) Bb | 85.9 (0.6)ABa | 3.8 (0.2) Bb | 4.4 (0.4) Aa |
| YBF100 | 58.9 (0.9) Ab | 67.2 (1.4) Aa | 73.8 (1.1) Ab | 86.1 (0.2)ABa | 5.4 (0.5) Aa | 4.3 (0.2) Ab |
| YGB700 | 59.3 (1.5) Ab | 66.7 (0.2) Aa | 74.4 (0.3) Ab | 85.3 (0.8) Ba | 5.1 (0.1) Aa | 4.3 (0.5) Ab |
| YBF402 | 58.0 (0.5) ABb | 69.0 (0.2) Aa | 74.2 (0.4) Ab | 86.9 (0.6) Aa | 4.9 (0.2) Aa | 4.5 (0.1) Aa |
|
| ||||||
| Neat resin | 55.6 (0.7) Ab | 67.5 (2.7) Aa | 70.8 (0.7) Ab | 85.9 (0.6) Aa | 3.8 (0.2) Ab | 4.4 (0.4) Aa |
| OX50 | 58.4 (0.9) Ab | 63.0 (1.1) Ba | 73.2 (2.3) Ab | 79.7 (1.0) Ba | 3.6 (0.3) Ab | 4.2 (0.3) Aa |
TU – Thio-urethane. Means followed by the same upper case letter in the same column and lower case letters within the same row are statistically similar (p > 0.05). The data for Y-series fillers and OX-50 are analyzed separately.
For the Rpmax, 2-way ANOVA performed with YBF/YGB data showed that both ‘filler type’ (p = 0.003) and ‘presence of thio-urethane’ (p = 0.006) affects the results, and this effect depends on interaction (p = 0.002). When the thio-urethane was used, the filler type did not affect the Rpmax. In contrast, unfilled materials showed the lowest values of Rpmax in the absence of thio-urethane, while no difference was observed between the filled materials. Except for YBF402, the addition of thio-urethane affected the Rpmax when materials with the same filler were compared. Using thio-urethane reduced the Rpmax when the fillers YBF100 and YGB700 were used, but increased the Rpmax in the absence of filler. For OX50 data, only the ‘presence of thio-urethane affected the Rpmax (p = 0.011), whereas ‘filler’ (p = 0.298) and the interaction were not significant (p = 0.932). The addition of thio-urethane increased the Rpmax. Figure 2 illustrates the Rp development as a function of DC.
Figure 2.

Rate of polymerization (%/s) as a function of degree of conversion for the materials tested. Results obtained with the optical bench in 0.8 mm specimens, with 320 mW/cm2 reaching the top of the specimen.
3.2 Light-transmission during polymerization
The results of light-transmission modification during the polymerization of each material are presented at Figure 3. The effect of fillers on light-transmission was similar for either material containing or not thio-urethane. Material without fillers presented slight modification on transmission of light during the polymerization, irrespective the wavelength evaluated. Composites containing YBF100, YBF402 and YGB700 allowed higher light-transmission with increased values of DC, whereas the opposite was observed for composites with OX50. When the fillers YBF100, YBF402 and YGB were used, it was observed a tendency of thio-urethane to reduce the light-transmission, while the difference was more significant at 405 and 435 nm.
Figure 3.

Relative light-transmission (normalized according to the initial value) of each material measured in real-time with polymerization in the optical bench (320 mW/cm2) reaching the top of the specimen). Light transmission through 0.8 mm specimens was recorded at wavelengths of 365 (A), 405 (B) and 435 nm (C). TU – Thio-urethane.
3.3 Depth of polymerization
The results of depth of polymerization are presented in Figure 4. For both statistical analyses (OX50 versus neat resin; and other fillers and neat resin), two-way repeated measure ANOVA showed that both the material (presence of thio-urethane vs. filler; p < 0.001) and the depth from surface (p < 0.001) significantly affected the DC, and that the effect of depth was dependent on the material (p-value of interaction < 0.001). In general, the materials containing thio-urethane presented higher DC irrespective of depth. Except for unfilled materials with thio-urethane, a trend in reduction of the DC towards the bottom of the specimen was observed. This reduction was more evident for composites with OX50, with DC lower than 40% observed beyond 2.5 and 3.0 mm of depth for composites without and with thio-urethane, respectively.
Figure 4.

Results of degree of conversion as a function of depth. For each analysis (left for YBF/YGB fillers; right for OX50), distinct letter (uppercase for line, lowercase for column) indicate statistical difference (p < 0.05).
4. Discussion
The advent of photo-activated resins definitely facilitated the clinical procedure, allowing for polymerization on demand. However, photo-activation also has drawbacks, such as the limited light penetration through different increments of composite, as well as light attenuation in hard-to-reach areas of the cavity preparation [20–22]. The main source for light scattering through the depth of the composite is the interface between the organic and inorganic phases [22]. Several attempts to modify restorative materials to improve the polymerization in depth have been evaluated, with several studies focusing on refractive index, content and size of fillers [13, 21–24]. In general, the refractive index of the organic matrix is lower than that of the inorganic filler, and that mismatch is more marked for the unpolymerized material [13, 23]. As polymerization progresses, the refractive index of the organic matrix increases, and the mismatch with the filler is lessened. Provided that the degree of conversion is greater than 60–70%, materials can be tailored so that esthetic requirements are met [25]. However, for thicker increments or for regions of the restoration which are not properly accessed by the light [such as the bottom of a proximal box in deep a class II restoration], the scattering of light is more severe and the mismatch in refractive indices becomes a more serious concern [26]. Therefore, in this study, the use of high refractive index additives was investigated as a way to reduce the mismatch in the un-polymerized material and aid in light transmission through the depth of the material.
The refractive index variation and the efficiency in light transmission were measured in several different ways in this study, and correlated with the degree of conversion as an outcome. The fillers used in this study were selected based on their refractive index and size distribution. According to the manufacturer, the refractive index of OX50 is 1.45 (0.04 μm average filler size), and the refractive index of all other fillers used in this study is 1.54 (YBF or YGB types). For the latter, the filler size ranged from 0.05 to 0.11 μm. The refractive index of the un-polymerized matrix not-modified with Thio-urethane was measured at 1.50. The Thio-urethane used in this study was selected because it presented aromatic, thiol and urethane functionalities in its backbone, which are known to increase the refractive indices of organic compounds [15]. This in fact led to an increase in the unpolymerized matrix refractive index, but only slightly, to 1.51. This is not unexpected based on the 20 wt% ratio of Thio-urethane added to the matrix, which corresponded to only 12 wt% of the composite material overall (except for OX-50 groups, where the filler loading was only 20 wt%, and where the Thio-urethane loading was relatively higher at 16 wt% of the overall mass). In other words, even with the addition of a higher refractive index oligomer, the mismatch with the high refractive index fillers was significant for the unpolymerized materials. As expected based on the law of mixtures, the combination of organic matrices with and without TU with the different fillers resulted in refractive indices intermediary to the isolated phases. Also as expected, the use of TU led to very similar increases in refractive index for all filler types. Interestingly, the 1.50 and 1.51 values for the unfilled matrices stayed between the refractive index values of OX-50 (1.45) and the remainder of the fillers (1.54). With the expected increase in the refractive index of the organic matrix during polymerization (which was indeed observed here), this allowed for the effects of an increasingly mismatched refractive index (OX-50 groups) and increasingly better matched refractive index (other fillers) to be evaluated during polymerization. The refractive index of polymerized specimens ranged from 1.52–1.54, much closer to the RIs of YBF100, YBF402 and YGB700. The mismatch with OX50 severely increases. These refractive indices observations greatly influenced the light transmission and kinetics, as will be discussed in the following paragraphs.
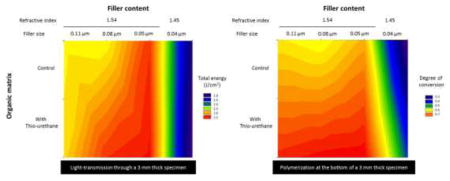
In the first set of light transmission experiments, the irradiance reaching the bottom of 3-mm thick specimens was measured during polymerization using the spectrophotometer accessory. The irradiance at the top of the specimen was 320 mW/cm2, chosen because it is a clinically-relevant value. The 3 mm value is an intermediate increment thickness, between what is recommended for conventional materials (2-mm) and what is preconized for bulk-fill composites (greater than 4-mm). As expected, the unfilled materials presented the highest initial and final irradiance at the bottom of the 3 mm specimen (Figure 1, Table 3), around 130–150 mW/cm2, whereas the light transmission at the bottom was reduced by up to 92% when fillers were added. This corroborates the effect of light scattering by filler particles [21–23]. Interestingly, the addition of TUs reduced the irradiance at the bottom of the specimen compared to the unfilled material control, which can be speculated to be due to light scattering by the additive itself. In the unfilled materials, the refractive index mismatch between the resin matrix and the additive might have introduced yet another interface, as has been demonstrated for other pre-polymerized additives [27, 28]. If only the filled materials are considered, the irradiance the bottom of the specimen at the end of the 70 s exposure varied between 10 and 50 mW/cm2. For those materials, the addition of TU either did not influence the irradiance at the bottom (YBF100 and YBF402), or increased the irradiance at the bottom (YGB700) or decreased the irradiance at the bottom (OX-50), as can be seen in Table 3. Those apparently contradictory results can be at least partially explained by the refractive index mismatch. The lowest irradiance at the bottom was obtained with OX-50, and that is due to the low refractive index of the filler – 1.45. As already explained, the matrix without and with TU starts out at 1.50 and 1.51, and increases to 1.53 and 1.54 refractive indices with polymerization, respectively. In other words, the mismatch in refractive index between filler and organic matrix increases with polymerization with OX-50, even more so when TUs are added. Therefore, the reduction in irradiance at the bottom of the specimen is expected. As for the other fillers, it is interesting to note that even though the YBF (ytterbium fluoride) and YGB (barium glass) fillers presented the same initial refractive index, the relative irradiances at the bottom they produced were distinct. In this case, it can be speculated that the light transmission through the sample was influenced by the composition of the filler itself, with more or less light being directly absorbed by the different components in the filler. Fluoride- and ytterbium- containing materials are known to be more opaque, even more so than Barium glass (according to the manufacturer - http://www.sukgyung.com/1bio.php?dept3=1&2). Within the two ytterbium-fluoride materials, the one with the largest particles seems to have absorbed/scattered the most light. The wavelengths of light being analyzed here ranged from 360–540 nm, and therefore, based on Rayleigh scattering theory (29), it can be hypothesized that the smaller particles, with average size of 50 nm, posed less interference to the passage of light than the 110 nm particles, which were in the same order of magnitude in size than the wavelength of light going through the composite. This also points to a possible heterogeneous size distribution in the particles of YBF100. For the barium glass particle, the addition of Thio-urethane increased the light transmission at the bottom of the polymerized specimen, likely due to the combination of increased refractive index in the matrix and the particle size below the wavelength of the light source.
Moreover, the modifications on light-transmission through to resin composites are also usually explained by Beer–Lambert’s law. According to this law, the light attenuation passing through a medium is directly related to total Fresnel reflectance coefficient and to product between the attenuation coefficient and the thickness of the sample, while the exponential value of this product is used in the equation. The attenuation coefficient (α) is composed by absorption coefficient (αa) and scattering coefficient (αs); expressed by following formula: α = αa (Vr) + αs (Vf, Δn, r, S). In this formula, the resin volume fraction (Vr) is related to absorption; while the filler volume fraction (Vf), relative refractive index (Δn), particle radius (r), and surface treatment (S) affects the scattering coefficient. Based on this formula, αa quantify the effect of filler content; while αs is related to how the filler type affect the light-transmission. Thus, it was expected with resin without filler would present higher light-transmission due to reduced light scattering; which was confirmed by results of present study.
The light transmission for three wavelengths (365, 405 and 435 nm) was also measured in real-time concomitantly with degree of conversion. In this test, the irradiance is limited by the sensitivity of the detector, so a value of 320 mW/cm2 reaching the specimen was used. It has been demonstrated an inverse relation between the incident wavelength and the light-absorption; whereas the opposite is observed for scattering effects [20]. It means that the light-attenuation is more affected by absorption in lowest wavelengths, while the higher wavelengths are more affected by scattering. Except for the composites filled with OX50, the other materials presented similar behavior irrespective the wavelength evaluated. When OX50 was used, the light-transmission relative to 365 nm started stable and drastically reduced the intensity when the DC reached around 45 and 58% for matrixes without and with thio-urethane, respectively. Differently, the light-transmission reduction became less pronounced and started earlier toward higher wavelengths.
The absorption affects more the light-transmission at 365 nm, while the light-absorption is highly related to resin matrix. Thus, the reduction of light-transmission in this wavelength can be related to moment where the resin matrix achieves high enough conversion to significantly increases it refractive index, resulting in higher discrepancy with that of filler [13]. Considering that the addition of thio-urethane delays the resin vitrification, the modification on light-transmission occurred later when this oligomer was added to composite [16–19]. In opposite, the scattering effect promoted by filler itself is more pronounced when higher wavelengths are incised over the specimens, resulting in early light-attenuation. Despite the higher effect of filler at higher wavelengths, the addition of thio-urethane also slightly reduced the inclination of light-transmission reduction curve, probably due to delayed vitrification.
Regarding to polymerization kinetics, the filler content also affected the Rpmax only when the thio-urethane was no used. Interestingly, neat resin and filled with OX50 presented the lowest Rpmax values, while no difference was observed between the resins without thio-urethane and with the other fillers. This is reasonable to associate these outcomes to filler content, where resin with lower content (20 wt%) or no-filler presented lower Rpmax than those with higher amount of filler (40 wt%). It could be speculated that the filler absorb heat from photo-activation resulting in accelerating of polymerization reaction, demonstrated by higher Rpmax [30]. The same behavior, however, was not observed for composites containing thio-urethane. This result can be attributed to chain-transfer reactions of the pendant thiols to the methacrylate, limiting the propagation of polymerization reaction [31, 32]. Another effect observed in kinetics with addition of thio-urethane is the deceleration begins in higher conversion, resulting in delay vitrification and highest final DC [16–19]. One effect that cannot be overlooked is the exothermic nature of this polymerization reaction. Differences in temperature during that process are also known to influence the refractive index of the material [33], and are therefore might be relevant to the current work. In the present study, however, only end point measurements of the refractive index have been conducted, one for the neat resin, and another for fully cured polymer films, both at room temperature. Moreover, the kinetic profiles for all materials containing filler, where this would find the most relevance, were very similar. Even though we did not use differential scanning calorimetry, for example, to actually evaluate the heat flow during reaction, it is reasonable to assume, given the direct correlation between heat of reaction and polymer conversion, that the temperature effects during polymerization were similar for all materials. The only instance when the rates differed was for the OX-50 filled materials without thiourethane. Since this material specifically was only compared to the neat resin in the statistical analysis, the temperature effects were disregarded from the discussion.
Regarding the light-transmission, the addition of thio-urethane had slight effect on light-transmission, whereas a more significant was observed for neat resin materials with the addition of the oligomer reducing the irradiance. It is important emphasize that the control resin presented as almost-transparent material, while addicting thio-urethane increased the opacity of neat resin. In opposite, a slightly higher irradiance was observed for material containing thio-urethane when the composite was filled with YGB700. Both composites filled with YGB700 presented similar light-transmission prior to polymerization, where the composite containing thio-urethane started to present higher light-transmission during the polymerization reaction. Interestingly, analyzing the relative transmission in function of DC, it was observed a higher increasing on transmission for composite without thio-urethane at wavelength, except for wavelength of 365 nm. However, it is important emphasize that the irradiance (using the Marc) was measured with specimens with 3.0-mm thick, whereas thinner specimens (0.8-mm) was used in optical bench. Thus, differences related to specimens can explain this difference.
The light-transmission showed close relation with DC measured in different depths from surface. In general, neat resin showed more homogeneous polymerization through entire depth of specimens, while composites with OX50 presented lower depth of polymerization. Slight difference on depth of polymerization was observed between the other fillers with a tendency of higher and lower DC for YGB700 and YFB402, respectively, in deeper depths. However, the main outcome was the tendency of materials containing thio-urethane present highest values in all depths. In concordance with the results found in measurement of polymerization kinetics, addition of chain-transfer thio-urethane increase the DC even close to surface, demonstrating this improvement on DC was not related to modifications on light-transmission. The presence of thiol pedants on thio-urethane structures promotes chains transference on polymerization reaction, delaying the gelation/vitrification stages, which occurs when the material presents higher DC [31, 34]. Considering that these stages represent phases when the mobility reactional is reduced and henceforth few increasing on DC can be observed, delaying the gelation/vitrification results in increased final DC [8].
The findings of the present study demonstrated that the refractive index of filler added to composite have higher effect on light-attenuation than the diameter of filler itself, while only huge difference on the light-transmissions significantly affected the depth of polymerization. In other side, the addition of thio-urethane oligomers significantly improved the DC for all depths evaluated, despite did not increase the light-transmission through of composite. Considering the polymerization stress is directly affect by volume of material [35], the use of additives thio-urethanes also have the advantageous to reduce the stress allowing the insertion of higher volumes of composite [16–19].
Highlights.
Addition of synthetized thio-urethane oligomers to methacrylate-based composites
Composites filled with inorganic fillers varying refractive index and size
Filler content affected the light-transmission and depth of polymerization
Effect of thio-urethane on light-transmission was a function of filler
Thio-urethane improved the conversion and depth of cure irrespective the filler
Acknowledgments
This work was supported by the National Institutes of Health (grant# NIH-NIDCR 1U01-DE02756, R15 DE023211 and K02 DE025280). ALFS is grateful to Capes/Brazil for scholarship (99999.006169/2014-07).
Footnotes
Publisher's Disclaimer: This is a PDF file of an unedited manuscript that has been accepted for publication. As a service to our customers we are providing this early version of the manuscript. The manuscript will undergo copyediting, typesetting, and review of the resulting proof before it is published in its final citable form. Please note that during the production process errors may be discovered which could affct the content, and all legal disclaimers that apply to the journal pertain.
References
- 1.Da Rosa Rodolpho PA, Donassollo TA, Cenci MS, Loguércio AD, Moraes RR, Bronkhorst EM, Opdam NJ, Demarco FF. 22-Year clinical evaluation of the performance of two posterior composites with different filler characteristics. Dent Mater. 2011;27:955–63. doi: 10.1016/j.dental.2011.06.001. [DOI] [PubMed] [Google Scholar]
- 2.Beck F, Lettner S, Graf A, Bitriol B, Dumitrescu N, Bauer P, Moritz A, Schedle A. Survival of direct resin restorations in posterior teeth within a 19-year period (1996–2015): A meta-analysis of prospective studies. Dent Mater. 2015;31:958–85. doi: 10.1016/j.dental.2015.05.004. [DOI] [PubMed] [Google Scholar]
- 3.Manhart J, Chen H, Hamm G, Hickel R. Buonocore Memorial Lecture. Review of the clinical survival of direct and indirect restorations in posterior teeth of the permanent dentition. Oper Dent. 2004;29:481–508. [PubMed] [Google Scholar]
- 4.Demarco FF, Corrêa MB, Cenci MS, Moraes RR, Opdam NJ. Longevity of posterior composite restorations: not only a matter of materials. Dent Mater. 2012;28:87–101. doi: 10.1016/j.dental.2011.09.003. [DOI] [PubMed] [Google Scholar]
- 5.Kwon Y, Ferracane J, Lee IB. Effect of layering methods, composite type, and flowable liner on the polymerization shrinkage stress of light cured composites. Dent Mater. 2012;28:801–9. doi: 10.1016/j.dental.2012.04.028. [DOI] [PubMed] [Google Scholar]
- 6.Thomaidis S, Kakaboura A, Mueller WD, Zinelis S. Mechanical properties of contemporary composite resins and their interrelations. Dent Mater. 2013;29:e132–41. doi: 10.1016/j.dental.2013.04.025. [DOI] [PubMed] [Google Scholar]
- 7.Chen YC, Ferracane JL, Prahl SA. Quantum yield of conversion of the photoinitiator camphorquinone. Dent Mater. 2007;23:655–64. doi: 10.1016/j.dental.2006.06.005. [DOI] [PubMed] [Google Scholar]
- 8.Wydra JW, Cramer NB, Stansbury JW, Bowman CN. The reciprocity law concerning light dose relationships applied to BisGMA/TEGDMA photopolymers: theoretical analysis and experimental characterization. Dent Mater. 2014;30:605–12. doi: 10.1016/j.dental.2014.02.021. [DOI] [PMC free article] [PubMed] [Google Scholar]
- 9.Zorzin J, Maier E, Harre S, Fey T, Belli R, Lohbauer U, Petschelt A, Taschner M. Bulk-fill resin composites: polymerization properties and extended light curing. Dent Mater. 2015;31:293–301. doi: 10.1016/j.dental.2014.12.010. [DOI] [PubMed] [Google Scholar]
- 10.Al-Ahdal K, Ilie N, Silikas N, Watts DC. Polymerization kinetics and impact of post polymerization on the Degree of Conversion of bulk-fill resin-composite at clinically relevant depth. Dent Mater. 2015;31:1207–13. doi: 10.1016/j.dental.2015.07.004. [DOI] [PubMed] [Google Scholar]
- 11.Alshali RZ, Salim NA, Sung R, Satterthwaite JD, Silikas N. Qualitative and quantitative characterization of monomers of uncured bulk-fill and conventional resin-composites using liquid chromatography/mass spectrometry. Dent Mater. 2015;31:711–20. doi: 10.1016/j.dental.2015.03.010. [DOI] [PubMed] [Google Scholar]
- 12.Chen YC, Ferracane JL, Prahl SA. A pilot study of a simple photon migration model for predicting depth of cure in dental composite. Dent Mater. 2005;21:1075–86. doi: 10.1016/j.dental.2005.05.002. [DOI] [PubMed] [Google Scholar]
- 13.Howard B, Wilson ND, Newman SM, Pfeifer CS, Stansbury JW. Relationships between conversion, temperature and optical properties during composite photopolymerization. Acta Biomater. 2010;6:2053–9. doi: 10.1016/j.actbio.2009.11.006. [DOI] [PMC free article] [PubMed] [Google Scholar]
- 14.Shortall AC, Palin WM, Burtscher P. Refractive index mismatch and monomer reactivity influence composite curing depth. J Dent Res. 2008;87:84–8. doi: 10.1177/154405910808700115. [DOI] [PubMed] [Google Scholar]
- 15.Bhagat SD, Chatterjee j, Chen B, Stiegman AE. High Refractive Index Polymers Based on Thiol–Ene Cross-Linking Using Polarizable Inorganic/Organic Monomers. Macromolecules. 2012;45:1174–1181. [Google Scholar]
- 16.Bacchi A, Dobson A, Ferracane JL, Consani R, Pfeifer CS. Thio-urethanes improve properties of dual-cured composite cements. J Dent Res. 2014;93:1320–5. doi: 10.1177/0022034514551768. [DOI] [PMC free article] [PubMed] [Google Scholar]
- 17.Bacchi A, Consani RL, Martim GC, Pfeifer CS. Thio-urethane oligomers improve the properties of light-cured resin cements. Dent Mater. 2015;31:565–74. doi: 10.1016/j.dental.2015.02.008. [DOI] [PMC free article] [PubMed] [Google Scholar]
- 18.Bacchi A, Nelson M, Pfeifer CS. Characterization of methacrylate-based composites containing thio-urethane oligomers. Dent Mater. 2016;32:233–9. doi: 10.1016/j.dental.2015.11.022. [DOI] [PMC free article] [PubMed] [Google Scholar]
- 19.Bacchi A, Pfeifer CS. Rheological and mechanical properties and interfacial stress development of composite cements modified with thio-urethane oligomers. Dent Mater. 2016;32:978–86. doi: 10.1016/j.dental.2016.05.003. [DOI] [PMC free article] [PubMed] [Google Scholar]
- 20.Taira M, Okazaki M, Takahashi J. Studies on optical properties of two commercial visible-light-cured composite resins by diffuse reflectance measurements. J Oral Rehab. 1999;26:329–37. doi: 10.1046/j.1365-2842.1999.00378.x. [DOI] [PubMed] [Google Scholar]
- 21.Fujita K, Ikemi T, Nishiyama N. Effects of particle size of silica filler on polymerization conversion in a light-curing resin composite. Dent Mater. 2011;27:1079–85. doi: 10.1016/j.dental.2011.07.010. [DOI] [PubMed] [Google Scholar]
- 22.Emami N, Sjödahl M, Söderholm KJ. How filler properties, filler fraction, sample thickness and light source affect light attenuation in particulate filled resin composites. Dent Mater. 2005;21:721–30. doi: 10.1016/j.dental.2005.01.002. [DOI] [PubMed] [Google Scholar]
- 23.dos Santos GB, Alto RV, Filho HR, da Silva EM, Fellows CE. Light transmission on dental resin composites. Dent Mater. 2008;24:571–6. doi: 10.1016/j.dental.2007.06.015. [DOI] [PubMed] [Google Scholar]
- 24.Shortall AC, Palin WM, Burtscher P. Refractive index mismatch and monomer reactivity influence composite curing depth. J Dent Res. 2008;87:84–8. doi: 10.1177/154405910808700115. [DOI] [PubMed] [Google Scholar]
- 25.Yoshimura HN, Chimanski A, Cesar PF. Systematic approach to preparing ceramic-glass composites with high translucency for dental restorations. Dent Mater. 2015;31:1188–97. doi: 10.1016/j.dental.2015.06.015. [DOI] [PubMed] [Google Scholar]
- 26.Harlow JE, Rueggeberg FA, Labrie D, Sullivan B, Price RB. Transmission of violet and blue light through conventional (layered) and bulk cured resin-based composites. J Dent. 2016;53:44–50. doi: 10.1016/j.jdent.2016.06.007. [DOI] [PubMed] [Google Scholar]
- 27.Rowe RC, Forse SF. The refractive indices of polymer film formers, pigments and additives used in tablet film coating: their significance and practical application. J Pharm Pharmacol. 1983;35:205–7. doi: 10.1111/j.2042-7158.1983.tb02913.x. [DOI] [PubMed] [Google Scholar]
- 28.Serbutoviez C, Kloosterboer JG, Boots HM, Paulissen FA, Touwslager FJ. Polymerization-induced phase separation III. Morphologies and contrast ratios of polymer dispersed liquid crystals. Liq Cryst. 1997;22:145–56. [Google Scholar]
- 29.Shao Y, Shih Y, Kim G, Shi FG. Study of optimal filler size for high performance polymer-filler composite optical reflectors. Opt Mater Express. 2015;5:423–9. [Google Scholar]
- 30.Daronch M, Rueggeberg FA, De Goes MF, Giudici R. Polymerization kinetics of pre-heated composite. J Dent Res. 2006;85:38–43. doi: 10.1177/154405910608500106. [DOI] [PubMed] [Google Scholar]
- 31.Pfeifer CS, Wilson ND, Shelton ZR, Stansbury JW. Delayed gelation through chain-transfer reactions: mechanism for stress reduction in methacrylate networks. Polymer. 2011;52:3295–3303. doi: 10.1016/j.polymer.2011.05.034. [DOI] [PMC free article] [PubMed] [Google Scholar]
- 32.Park HY, Kloxin CJ, Scott TF, Bowman CN. Stress Relaxation by Addition-Fragmentation Chain Transfer in Highly Crosslinked Thiol-Yne Networks. Macromolecules. 2010;43:10188–10190. doi: 10.1021/ma1020209. [DOI] [PMC free article] [PubMed] [Google Scholar]
- 33.Aloui F, Lecamp L, Lebaudy P, Burel F. Photopolymerization of an epoxy resin: conversion and temperature dependence of its refractive index. Macromol Chem Phys. 2016;217:2063–2067. [Google Scholar]
- 34.Boulden JE, Cramer NB, Schreck KM, Couch CL, Bracho-Troconis C, Stansbury JW, Bowman CN. Thiol-ene-methacrylate composites as dental restorative materials. Dent Mater. 2011;27:267–72. doi: 10.1016/j.dental.2010.11.001. [DOI] [PMC free article] [PubMed] [Google Scholar]
- 35.Braga RR, Boaro LC, Kuroe T, Azevedo CL, Singer JM. Influence of cavity dimensions and their derivatives (volume and ‘C’ factor) on shrinkage stress development and microleakage of composite restorations. Dent Mater. 2006;22:818–23. doi: 10.1016/j.dental.2005.11.010. [DOI] [PubMed] [Google Scholar]