

Abstract
Many studies have shown that schizophrenia patients have aberrant functional network connectivity (FNC) among brain regions, suggesting schizophrenia manifests with significantly diminished (in majority of the cases) connectivity. Schizophrenia is also associated with a lack of hemispheric lateralization. Hoptman et al. (2012) reported lower inter-hemispheric connectivity in schizophrenia patients compared to controls using voxel-mirrored homotopic connectivity. In this study, we merge these two points of views together using a group independent component analysis (gICA)-based approach to generate hemisphere-specific timecourses and calculate intra-hemisphere and inter-hemisphere FNC on a resting state fMRI dataset consisting of age- and gender-balanced 151 schizophrenia patients and 163 healthy controls. We analyzed the group differences between patients and healthy controls in each type of FNC measures along with age and gender effects. The results reveal that FNC in schizophrenia patients shows less hemispheric asymmetry compared to that of the healthy controls. We also found a decrease in connectivity in all FNC types such as intra-left (L_FNC), intra-right (R_FNC) and inter-hemisphere (Inter_FNC) in the schizophrenia patients relative to healthy controls, but general patterns of connectivity were preserved in patients. Analyses of age and gender effects yielded results similar to those reported in whole brain FNC studies.
Introduction
Schizophrenia is a severe mental disorder characterized by enduring, idiopathic psychotic symptoms (e.g., delusions, hallucinations, disorganized thinking and behavior), negative symptoms (e.g., avolition and amotivation), cognitive deficits, gray and white matter abnormalities, and disrupted connectivity across large-scale brain networks (Kubicki et al., 2007; Mohamed et al., 1999). Such dysconnectivity includes disruption of both structural (Kubicki et al., 2007; Rotarska-Jagiela et al., 2008) and functional connectivity (FC) (Calhoun et al., 2008).
Several studies have reported altered FC among brain regions in schizophrenia patients (Calhoun et al., 2009; Calhoun et al., 2008; Lynall et al., 2010; Yu et al., 2012). Defined as temporal correlation or other types of statistical dependency among spatially distant brain regions (Friston, 2002), FC has been used to examine the functional organization and temporal dependencies among these brain regions. FC can also be investigated at the network level using spatial independent component analysis (ICA) to determine connectivity patterns among spatial components, referred to as FNC (Arbabshirani et al., 2013; Jafri et al., 2008). Our study, similar to prior FNC studies, reports evidence of connectivity between functionally-coherent distributed brain networks based on temporal correlation.
Recent studies also show evidence of abnormal lateralization within certain brain networks in schizophrenia (Swanson et al., 2011). Differences between cerebral hemispheres were first observed by Paul Broca (Broca, 1861) and Carl Wernicke (Wernicke, 1874). Since then, there have been numerous studies noting cerebral lateralization in healthy subjects based on homodynamic activation (Agcaoglu et al., 2014; Cai et al., 2013; Clements et al., 2006; Gobbele et al., 2008) in a 4D frequency domain framework applied to resting fMRI data (Agcaoglu et al., 2015) and using FC (Gee et al., 2011; Gotts et al., 2013; Liu et al., 2009; Nielsen et al., 2013; Stark et al., 2008; Zhu et al., 2014; Zuo et al., 2010).
Several studies reported abnormal asymmetries of FC in schizophrenia (see Ribolsi et al. (2014) for a detailed review). Hoptman et al. (2012), using a voxel-mirrored homotopic connectivity method, showed lower homotopic connectivity in schizophrenia or schizoaffective disorder patients, particularly in the occipital lobe, thalamus and cerebellum. Homotopic connectivity is connectivity between regions that mirror of each other in the contralateral hemispheres. It presents evidence of communication of similar (homotopic) regions between hemispheres (Gee et al., 2011; Stark et al., 2008; Tang et al., 2016). Ke et al. (2010) found larger leftward FC asymmetry in patients with predominantly positive symptoms, and larger rightward FC asymmetry in patients with predominantly negative symptoms when compared to healthy controls in their ROI-based resting fMRI study. Oertel-Knochel et al. (2013) had found lower FC asymmetries in the planum temporale in schizophrenia patients and their relatives compared to healthy controls. Mwansisya et al. (2013) found aberrant inter-hemispheric resting state FC in globus pallidus, medial frontal gyrus and inferior temporal gyrus in first-episode schizophrenia patients compared to controls. This study also reported positive correlations between pallidum and medial frontal gyrus connectivity and the Wechsler Adult Intelligence Scale symbol-coding subset scores, pallidum connectivity and duration of the illness, and inferior temporal gyrus connectivity and negative symptom scores. The above mentioned connectivity studies used either seed/atlas based approaches or voxel-mirrored functional connectivity to investigate laterality and only examined connectivity of intra- or inter-hemispheric homotopic regions. The only study that investigated connectivity of heterotopic regions in different hemispheres was Gee et al. (2011), which examined the connectivity of heterotopic regions in healthy subjects in different hemispheres and was compared with intra-hemisphere connectivity in their atlas-based study. However, to the best of our knowledge there has been no lateralization study focused on differences in connectivity among brain networks (i.e., FNC) in schizophrenia.
In this study, we employ an ICA-based approach to study hemisphere-specific FNC. We then apply this method to a large, multisite dataset of schizophrenia patients and healthy controls to investigate differences between the patient and control populations in intra- and inter-hemispheric FNC. We also examine the effects of age, gender and handedness on FNC. As far as we know, this is the first study using FNC measures to calculate hemispheric differences and the first study to investigate connectivity differences in heterotopic regions in schizophrenia patients.
Methods and Materials
Participants
In this study, we used a large resting state fMRI dataset containing 314 subjects, 163 healthy controls (117 males, 46 females; mean age 36.9) and 151 schizophrenia patients that are matched in age and gender to a healthy control group (114 males, 37 females; mean age 37.8) combined from seven different sites across the United States (see Table 1) and passed the data quality control (E. Damaraju et al., 2014b). Informed consent was received from each subject prior to scanning in accordance with the Internal Review Boards of corresponding institutions.
Table 1.
Demographic information of the subjects, age, gender, and diagnosis distribution.
| # of subjects | % | |||
|---|---|---|---|---|
| Gender | 314 | 100 | ||
| Male Healthy | 117 | 37.2 | ||
| Male Schizophrenia | 114 | 36.3 | ||
| Female Healthy | 46 | 14.7 | ||
| Female Schizophrenia | 37 | 11.8 | ||
| Mean | SD | Min | Max | |
| Age (year) | 37.4 | 11.2 | 18 | 60 |
| Male Healthy | 36.9 | 10.8 | 19 | 60 |
| Male Schizophrenia | 37.9 | 11.5 | 18 | 60 |
| Female Healthy | 37.1 | 11.5 | 19 | 58 |
| Female Schizophrenia | 37.9 | 11.3 | 20 | 56 |
Cognitive and clinical measures were collected for 275 out of 314 subjects and analyzed as Computerized Multiphasic Interactive Neurocognitive System (CMINDS) composite scores. The composite scores (see Table 2) summarize the overall cognition in six different measures: attention/vigilance, speed of processing, verbal learning, working memory, visual learning and reasoning/problem solving (van Erp et al., 2015). Positive and Negative Syndrome Scale (PANSS) were available for 148 out of 151 patients and antipsychotic chlorpromazine (CPZ) dose equivalents were available for 129 patients (112 subjects were treated with the second-generation or atypical medication, while 17 subjects were treated with first-generation typical antipsychotic medications. Forty-eight patients were also treated with antidepressants, 24 with mood stabilizers, and 18 with anti-extrapyramidal symptoms medication (see Table 3).
Table 2.
Distribution of cognitive scores, as CMINDS composite scores, for 276 subjects.
| Total | Schizophrenia | Healthy | |
|---|---|---|---|
| CMIND Mean | -0.6726 | -1.4664 | 0.0550 |
| CMIND SD | 1.2995 | 1.1724 | 0.9346 |
| # of subjects | 276 | 132 | 144 |
Table 3.
Distribution of Positive and Negative Syndrome Scale and mean antipsychotic dose as CPZ equivalent are presented for schizophrenia patients. 148 patients had PANSS score and 122 patients had mean antipsychotic dose data available.
| Mean | SD | # of subject | |
|---|---|---|---|
| PANSS Negative | 14.3 | 5.3 | 148 |
| PANSS Positive | 14.8 | 4.56 | 148 |
| CPZ | 430.8 | 612.2 | 122 |
Data Acquisition
Six of the seven sites collected imaging data using a 3T Siemens Tim Trio System and one site collected imaging data on a 3T General Electric Discovery MR750 scanner. Resting state fMRI scans were acquired using a standard gradient-echo echo planar imaging paradigm: FOV of 220 × 220 mm (64 × 64 matrix), TR=2 s, TE=30 ms, FA=770, 162 volumes, duration of 5 minutes and 24 seconds, 32 sequential ascending axial slices of 4 mm thickness and 1 mm gap. Subjects were instructed to close their eyes and stay awake during the resting state scan.
Preprocessing
Functional MRI data were preprocessed with the pipeline described in (E. Damaraju et al., 2014b), using a combination of toolboxes such as AFNI (https://afni.nimh.nih.gov), SPM (http://www.fil.ion.ucl.ac.uk/spm), GIFT (http:mialab.mrn.org/software/gift) and MATLAB. The INRIAlign (Freire et al., 2002) toolbox in SPM was used for rigid body motion correction for subject head motion followed by slice-timing correction to account for timing differences in slice acquisition. The 3D Despike algorithm in AFNI was used to remove spike artifacts from the fMRI data. The fMRI data were warped to a Montreal Neurological Institute (MNI) template, resampled to 3 mm3 isotropic voxels, and smoothed with a 6 mm full width at half maximum (FWHM) using AFNI. Each voxel timecourse was variance normalized prior to the gICA; for additional image preprocessing details, see a previous study (E. Damaraju et al., 2014b).
Group Independent Component Analysis
The preprocessed data was decomposed into 100 spatially independent components using gICA implemented in GIFT. The gICA identifies spatially distinct, functionally-coherent networks by estimating maximally independent spatial sources (or spatial maps) from their linearly-mixed fMRI signals or timecourses (Calhoun et al., 2001; Erhardt et al., 2011). Out of the original 100 components, 47 components were identified as resting state networks (RSNs) based on several criteria: maximally activated voxels located in identified gray matter, minimal spatial overlap with known vascular, ventricular and head-motion susceptible edge regions and combined with large low-to-high frequency spectral power ratios in the component timecourses. We refer the readers to previous research (E. Damaraju et al., 2014b) for a detailed discussion of the gICA analysis performed on this data and selection of RSNs.
Generating Templates and Hemisphere-Specific Timecourses
We utilized spatiotemporal regression on symmetrized aggregated spatial maps of the components to generate hemisphere-specific component timecourses. Symmetrized aggregated spatial maps were generated by flipping the original aggregated spatial maps along their lateral axes and by then comparing each flipped voxel value with its unflipped voxel value and retaining the maximum intensity value. Hence, the symmetrized versions of the components that are mirror images of each other will be collinear (e.g., components 91, left lingual gyrus and 76, right lingual gyrus). We tested collinearity of the components using a variance inflation factor and removed four RSNs (IC 6, 91, 66 and 84) from our analyses, which had high collinearity with components IC 10 (precentral and postcentral gyrus), IC 76 (lingual gyrus), IC 94 (inferior parietal lobule) and IC 95 (angular gyrus) respectively. We also removed four artifact components that had a large variance inflation factor (IC 17, 31 39 and 52). After removals, the data comprised 92 symmetrized, aggregated spatial maps (43 RSNs & 49 artifacts) for subsequent analyses. Then, we split the symmetrized spatial maps and preprocessed subject data into left and right hemispheres. Finally, we applied spatiotemporal regression on the left and right hemispheres separately to generate subject-specific left- and right-hemisphere timecourses and spatial maps using GIFT. Generated RSNs are displayed in Figure 1 in terms of t-statistics, and the corresponding MNI regions are presented in Table 4.
Figure 1.
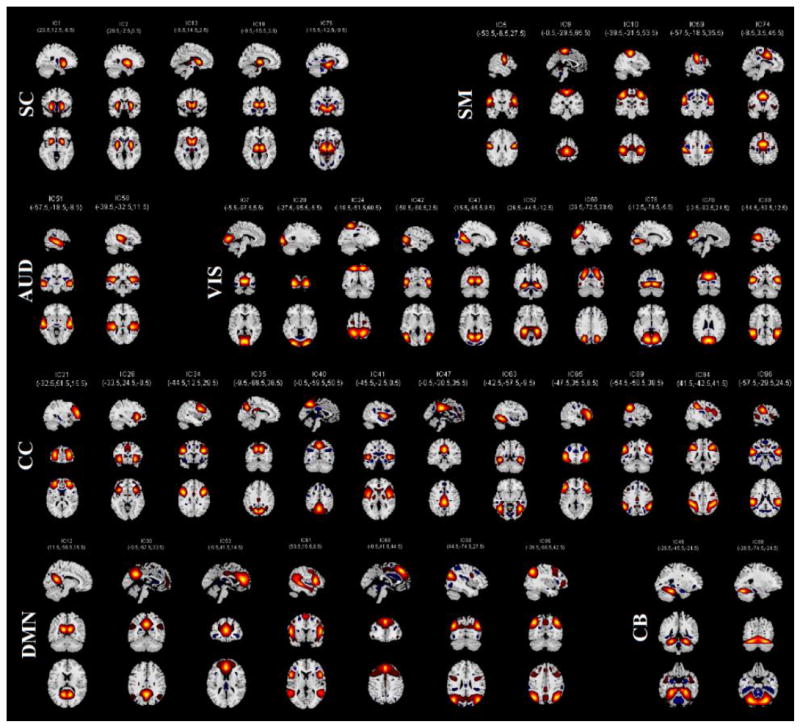
Symmetrized aggregated spatial maps of the 43 RSNs are displayed at the three most informative slices. RSNs are divided into groups based on their anatomical and functional properties and include sub-cortical (SC), sensorimotor (SM), auditory (AUD), visual (VIS), attention/cognitive control (CC), default-mode (DMN), and cerebellar (CB) networks.
Table 4.
MNI labels associated with the each symmetrized RSN shown in Figure 2: BA = Brodmann area; Vl = number of voxels in each cluster; Tmax = maximum t-statistics in each cluster; Coordinate of Tmax in MNI space, following LPI convention.
| BA | Vl | Tmax | Coordinate | |
|---|---|---|---|---|
| Sub-Cortical Networks | ||||
| IC75 | ||||
| R Lingual Gyrus | 8937 | 32.62 | 12 -21 -9 | |
| L Hippocampus | L 28 | 8019 | 31.02 | -15 -15 -9 |
| IC 1 | ||||
| R Putamen | R 47 | 13176 | 75.38 | 24 12 -9 |
| L Putamen | L 13 | 12960 | 74.43 | -24 12 -6 |
| IC 13 | ||||
| R Caudate | 15444 | 62.3 | 9 15 6 | |
| L Caudate | L 25 | 15255 | 61.54 | -6 15 0 |
| IC 2 | ||||
| R Putamen | 12231 | 75.42 | 30 -3 0 | |
| L Putamen | 12393 | 67.49 | -30 -6 3 | |
| IC 18 | ||||
| R Thalamus | 13230 | 67.43 | 12 -15 3 | |
| L Thalamus | 13284 | 68.07 | -9 -18 3 | |
| Auditory Networks | ||||
| IC58 | ||||
| R Heschls Gyrus | R 22 | 22437 | 40.88 | 48 -18 6 |
| L Superior Temporal Gyrus | L 41 | 23220 | 46.04 | -42 -30 9 |
| IC 51 | ||||
| R Middle Temporal Gyrus | R 21 | 21897 | 41.19 | 57 -18 -9 |
| L Middle Temporal Gyrus | L 21 | 18144 | 37.69 | -57 -12 -9 |
| Visual Networks | ||||
| IC 57 | ||||
| R Fusiform Gyrus | R 36 | 16092 | 45.84 | 24 -42 -12 |
| L Fusiform Gyrus | L 36 | 13392 | 49.14 | -24 -42 -12 |
| IC 42 | ||||
| R Middle Temporal Gyrus | R 37 | 17847 | 48.84 | 48 -66 3 |
| L Middle Temporal Gyrus | L 37 | 17469 | 47.31 | -48 -69 6 |
| IC 60 | ||||
| R Middle Occipital Gyrus | R 19 | 24084 | 46.19 | 30 -72 33 |
| L Middle Occipital Gyrus | L 7 | 23571 | 44.67 | -27 -69 33 |
| IC 20 | ||||
| R Inferior Occipital Gyrus | R 18 | 17577 | 49.94 | 30 -93 -6 |
| L Inferior Occipital Gyrus | L 18 | 20466 | 46.78 | -27 -93 -6 |
| IC 76 | ||||
| R Lingual Gyrus | R 18 | 21978 | 49.38 | 18 -75 -6 |
| L Lingual Gyrus | L 18 | 22410 | 49.01 | -12 -78 -6 |
| IC 78 | ||||
| L Cuneus | R 18 | 20871 | 51.66 | 3 -84 24 |
| L Cuneus | L 18 | 20655 | 52.49 | -3 -84 24 |
| IC 80 | ||||
| R Middle Temporal Gyrus | R 22 | 20790 | 46.58 | 54 -51 12 |
| L Middle Temporal Gyrus | L 22 | 21060 | 42.07 | -57 -51 12 |
| IC 7 | ||||
| R Calcarine Gyrus | R 18 | 20574 | 68.56 | 3 -87 6 |
| L Calcarine Gyrus | L 18 | 21627 | 69.97 | -6 -87 6 |
| IC 43 | ||||
| R Calcarine Gyrus | R 30 | 23895 | 58.64 | 15 -63 9 |
| L Calcarine Gyrus | L 30 | 22734 | 56.3 | -12 -66 9 |
| IC 24 | ||||
| R Superior Parietal Lobule | R 7 | 20628 | 40.18 | 18 -54 63 |
| L Superior Parietal Lobule | L 7 | 20277 | 41.39 | -24 -51 60 |
| Somatomotor Networks | ||||
| IC 59 | ||||
| R Postcentral Gyrus | R 4 | 15660 | 40.46 | 60 -18 36 |
| L Postcentral Gyrus | L 3 | 14526 | 38.51 | -60 -18 33 |
| IC 9 | ||||
| R Paracentral Lobule | R 6 | 20250 | 56.22 | 3 -33 63 |
| L Paracentral Lobule | L 6 | 20547 | 54.44 | -3 -27 63 |
| IC 10 | ||||
| R Postcentral Gyrus | R 3 | 27864 | 46.41 | 42 -21 54 |
| L Postcentral Gyrus | L 3 | 27162 | 43.02 | -42 -24 60 |
| IC 5 | ||||
| R Postcentral Gyrus | R 6 | 17739 | 58.65 | 54 -6 27 |
| L Postcentral Gyrus | L 6 | 15147 | 56.56 | -54 -9 30 |
| IC 74 | ||||
| R Middle Cingulate Cortex | R 24 | 23355 | 49.52 | 3 -3 45 |
| L SMA | L 24 | 20601 | 46.79 | 0 0 48 |
| Cognitive Control Networks | ||||
| IC 63 | ||||
| R Fusiform Gyrus | R 37 | 12771 | 38.94 | 42 -54 -12 |
| L Fusiform Gyrus | L 37 | 12393 | 43.58 | -42 -51 -12 |
| IC 65 | ||||
| R Inferior Frontal Gyrus | R 46 | 18441 | 34.31 | 51 39 3 |
| L Inferior Frontal Gyrus | L 47 | 16956 | 37.4 | -45 39 -3 |
| IC 28 | ||||
| R Inferior Frontal Gyrus | R 47 | 18711 | 57.8 | 33 24 -9 |
| L Inferior Frontal Gyrus | L 47 | 17469 | 50.67 | -33 24 -6 |
| IC 89 | ||||
| R SupraMarginal Gyrus | R 40 | 17739 | 49.69 | 57 -48 36 |
| L Inferior Parietal Lobule | L 40 | 15606 | 45.36 | -54 -54 39 |
| IC 35 | ||||
| R Precuneus | R 7 | 16011 | 51.6 | 9 -72 39 |
| L Precuneus | L 7 | 14391 | 54.06 | -9 -69 36 |
| IC 21 | ||||
| R Middle Frontal Gyrus | R 10 | 22761 | 37.94 | 30 51 15 |
| L Middle Frontal Gyrus | L 10 | 21276 | 39.88 | -33 51 21 |
| IC 47 | ||||
| R Middle Cingulate Cortex | R 23 | 17928 | 58.74 | 3 -27 30 |
| R Middle Cingulate Cortex | L 23 | 17037 | 53.19 | 0 -27 30 |
| IC 94 | ||||
| R Inferior Parietal Lobule | R 40 | 27702 | 43.3 | 42 -45 48 |
| L Inferior Parietal Lobule | L 40 | 32805 | 45.09 | -45 -39 39 |
| IC 34 | ||||
| R Inferior Frontal Gyrus | R 9 | 17982 | 39.27 | 48 12 27 |
| L Precentral Gyrus | L 9 | 15984 | 41.63 | -45 12 30 |
| IC 40 | ||||
| R Precuneus | R 7 | 19170 | 57.25 | 3 -57 51 |
| L Precuneus | L 7 | 19440 | 56.52 | 0 -60 51 |
| IC 41 | ||||
| R Insula | R 13 | 19872 | 49.75 | 45 0 0 |
| L Insula | L 22 | 17604 | 46.92 | -45 3 -3 |
| IC 96 | ||||
| R SupraMarginal Gyrus | R 40 | 13446 | 41.72 | 60 -27 24 |
| L SupraMarginal Gyrus | L 13 | 12636 | 36.02 | -51 -36 24 |
| Default-mode Networks | ||||
| IC 30 | ||||
| R Precuneus | R 7 | 19089 | 69.94 | 3 -63 36 |
| L Precuneus | L 31 | 17496 | 65.02 | -3 -57 33 |
| IC 53 | ||||
| Anterior Cingulate Cortex | 32 | 21870 | 50.72 | -3 42 15 |
| IC 69 | ||||
| Superior Medial Gyrus | 8 | 17982 | 50.48 | 0 42 45 |
| IC 95 | ||||
| R Angular Gyrus | R 40 | 28134 | 50.56 | 48 -63 42 |
| L Angular Gyrus | L 40 | 31212 | 49.31 | -42 -63 45 |
| IC 90 | ||||
| R Middle Occipital Gyrus | R 39 | 13554 | 40.7 | 45 -75 30 |
| L Middle Occipital Gyrus | L 39 | 13851 | 37.8 | -39 -75 30 |
| IC 61 | ||||
| R Inferior Frontal Gyrus | R 45 | 24219 | 32.99 | 51 18 6 |
| L Inferior Frontal Gyrus | L 44 | 32535 | 38.66 | -54 15 9 |
| IC 12 | ||||
| R Precuneus | R 30 | 17226 | 65.19 | 12 -54 15 |
| L Precuneus | L 23 | 16956 | 70.24 | -9 -57 15 |
| Cerebellar Networks | ||||
| IC 46 | ||||
| R Cerebellum | R 37 | 14634 | 44.93 | 27 -48 -24 |
| L Cerebellum | L 37 | 14175 | 45.29 | -24 -45 -24 |
| IC 88 | ||||
| R Cerebellum | R 19 | 28863 | 49.02 | 33 -72 -24 |
| L Cerebellum | L 19 | 26865 | 49.35 | -30 -72 -24 |
Functional Network Connectivity Calculation
For each hemisphere, subject timecourses went through post-processing steps. Time series of RSNs were detrended and orthogonalized with respect to the estimated realignment parameters (including their derivatives and their squares and derivatives of their squares), despiked, and band-pass filtered using a fifth-order Butterworth filter with cutoff frequencies of [0.01- 0.15 Hz]. The FNC between the two components is calculated by using a cosine similarity measure as follows:
The TCCX and TCcy are the timecourses of two different components and n is the length of the timecourses (Cetin et al., 2014). The FNC matrices are calculated using the timecourses of 43 left components and 43 right components. For each subject, we have an intra-left hemisphere (L_FNC) (903 pairs (432 – 43)/2), an intra-right hemisphere (R_FNC) (903 pairs) and an inter-hemisphere (Inter_FNC) (1849 pairs with 43 homotopic pairs (432)) FNC matrices.
Calculating Group Averages
Both using all participants and also used separately for the patient and control subgroups, we tested whether the FNC means differ from zero by using one sample t-test with a 0.05 false discovery rate (FDR) correction. Figure 2 shows the results for each of the FNCs of healthy control and schizophrenia patients. For visualization purposes, we displayed homotopic FNC results in a bar plot.
Figure 2.
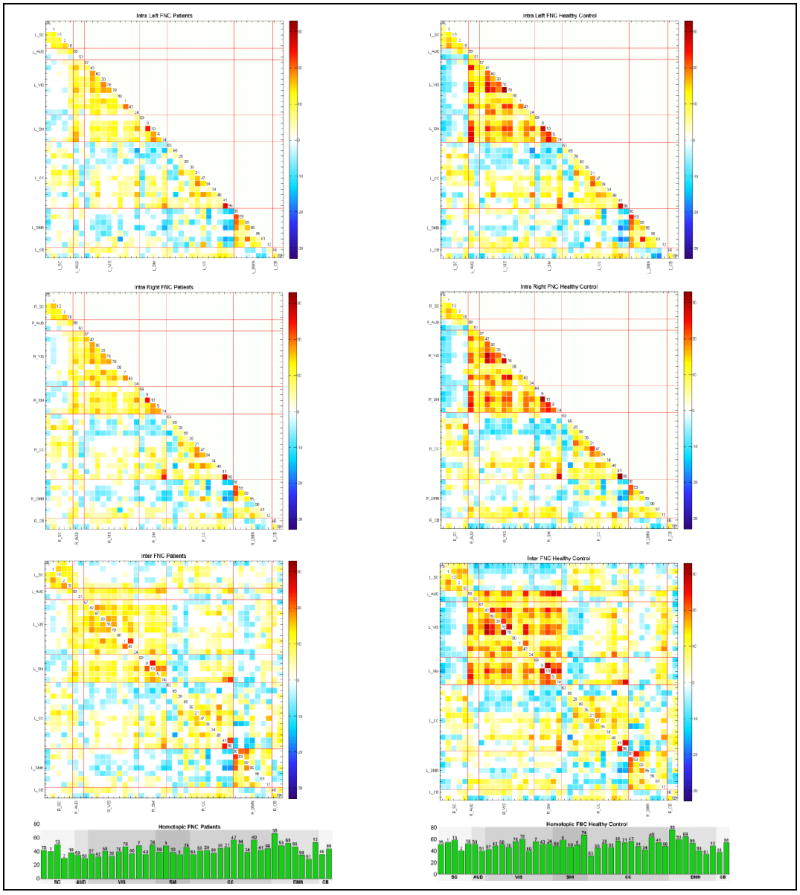
Averages of Patients (left column) and Healthy Control (right column) subgroups for all FNC types (L_FNC, R_FNC and Inter_FNC from top to bottom respectively) are displayed as t-statistics thresholded with 0.01 levels FDR. Homotopic FNCs are displayed in bar plots for visualization purposes and they have the highest connectivity strength. In all FNC types, we observe diminished connectivity strength in patients.
Comparing Strength of lateralized FNC types in Patients and Healthy Control
For the patient and healthy control subgroups, we compared the strength of connectivity captured in L_FNC, R_FNC, and in Inter_FNC. Inter_FNC’s upper triangular (RL_FNC) and lower triangular (LR_FNC) parts were taken separately for comparison. To do so for each group and for each type of FNC, we first regressed out motion as mean frame displacement and site ID. Later, we performed a one sample t-test in each group separately and thresholded with 0.05 levels FDR correction, and then retained the FNC indices that were significantly different from 0. Then for each pair of compared FNC types (FNCs that are significant in both of the FNC types that we are comparing), we retained network-pairs whose connectivity had the same directionality (positive or negative) and also were significant in both FNC matrices (the two FNCs that we are comparing). We were interested in connectivity strength (as long as it was the same in both FNC types), so the network-pair connectivity was then converted to absolute values. For each pair of FNC types, a paired t-test on magnitudes was then performed. Results were corrected with 0.05 levels FDR. Later, for patient and control groups separately, we identified the number of significant network-pairs and recorded which FNC type they favored.
Modeling Age, Gender, Schizophrenia and Handedness Effects in Intra FNC Differences
In order to investigate the differences between left and right hemisphere-specific FNCs, a left-right FNC difference map was calculated for each subject (L_FNC minus R_FNC). The values from this difference map were then individually employed as the dependent variable in a multiple linear regression on age, gender, schizophrenia, handedness, and sites, as well as motion parameters. We prefer the regression method in order to regress out the motion, site ID and handedness effect on the differences. The model used is formulized below:
Xgen is a categorical variable representing the gender of subject with 1 for females and 0 for males before mean removal. The age (Xage) is the demeaned subject age; Xdiag is 1 for schizophrenia patients and 0 is for healthy control before mean removal. Handedness is the subject’s Edinburg handedness score ranges between -2 and 2 (positive for right handers) before mean removal; Xmot is the demeaned mean frame displacement; and Xsite1, 2,…6 are dummy coded site variables (six site variables coded with 1 for the site and 0s for the others, while site 7 represented as all 0s) representing seven different data sites; each variable was also demeaned. All β’s are the coefficients of the regression model, with ɛ being the error parameter for the model, and σ(i,j) is the difference between L_FNC and R_FNC. This analysis captures the network pairs for which the differences in left/right hemisphere-specific connectivity are significantly affected (p<0.05, following false discovery rate (FDR) correction for multiple comparisons) (Genovese et al., 2002) by age, gender, diagnosis, and handedness.
To further evaluate the effect of the scanner/site, we removed the subjects from the different brand scanner and repeated the analysis with the remaining 262 subjects; results were consistent with those of the whole dataset; therefore, we kept the analysis using the whole dataset.
Substantial efforts were taken to ensure motion was not a confounder. First, ICA as a whole has been shown to be more robust to motion than seed-based approaches as the ICA approach is naturally denoising the data (E. Damaraju et al., 2014a). In addition, the ICA time series of the RSNs were detrended and orthogonalized with respect to estimated motion parameters (including their derivatives, their squares and derivatives of the squares) and despiked (a step which is similar to scrubbing). In addition, motion parameters were added as nuisance covariates in order to mitigate against residual motion effects. We also checked the motion differences between schizophrenia patients and healthy control on mean frame displacement using a two-sample t-test. Results indicated significantly higher motion in patients than controls (For all subjects; mean = 0.2947, sd = 0.1308, group difference p = 4.6440e-04; for 163 healthy controls, mean = 0.27, sd = 0.1214; for 151 patients, mean= 0.3213, sd = 0.1356). After excluding subjects whose mean frame displacement was greater than 0.45 mm, the remaining 150 healthy controls (initially 163) and 118 schizophrenia patients (initially 151) did not have a significant mean frame displacement difference (For these 268 subjects; mean = 0.2541, sd = 0.0889, group difference p = 0.1144; for 150 healthy controls, mean = 0.2464, sd = 0.0923; for 118 patients, mean = 0.2637, sd = 0.0838). We repeated the analysis with the retained 268 subjects; and found that the results were consistent with those of the whole dataset. In addition, an ANOVA test comparing mean frame displacement between sites showed a significant site difference. To further check how this impacted the results, we excluded the site with the different mean frame displacement (the only GE scanner) and repeated the ANOVA test, which showed that the means were no longer significantly different between sites (p=0.1683). Analysis using the six sites with the same brand scanner showed results consistent with those of the whole dataset.
Modeling Age, Gender, Schizophrenia and Handedness Effects in Intra Hemisphere and Inter Hemisphere FNC
We also examined the effects of age, gender, diagnosis and handedness on the hemisphere-specific FNCs (L_FNC and R_FNC) and on the Inter_FNC. We used a similar regression model as described above, with σ(i,j) being the intra- or inter-FNC value rather than the differences. Significance for beta values was later thresholded with 0.05 levels FDR. Age and gender results on intra- and inter-FNC are presented in supplementary materials.
Modeling Effects of Cognitive Scores, Symptom Scores and Mean Antipsychotic Dose
We examined the effect of cognitive scores (CMINDS), symptom PANSS scores, and mean antipsychotic dose (CPZ equivalent) in separate regression analysis on intra- and inter-FNCs and the left-right difference FNCs.
Analysis of Euclidian Distance and Connectivity Strength
Some studies have reported an inverse relationship between regional distance and connectivity strength (Gee et al., 2011; Stark et al., 2008). We examined whether distance was a factor in determining connectivity strength using a linear regression model. We first calculated the center of mass of the components and then the Euclidian distances between the components in left and right aggregated maps. We separately analyzed the homotopic regions and heterotopic regions using only the significant network-pairs (determined by one sample t-tests followed by FDR correction) in a linear regression. For heterotopic analysis, only positively correlated pairs are included.
RESULTS
Results of Group Averages
The average FNC results for schizophrenia and healthy control subgroups are displayed in Figure 2 in terms of FDR corrected (0.01 levels) t-statistics. In all FNC types, patients have lower connectivity strength relative to healthy controls. However, the overall patterns of correlation show similar trends in intra-left, intra-right and inter-hemisphere FNC both in patients and healthy control. We observed a high correlation in intra-subcortical, intra-visual, intra-sensorimotor, intra-default mode, and sensorimotor and visual networks in all FNC types. Intra-cognitive control also is mostly positively correlated, with the exception of anti-correlated networks, IC 63 (fusiform gyrus) and IC 65 (inferior frontal gyrus). General intra-hemispheric and inter-hemispheric connectivity patterns also show similar patterns as to those seen under a standard whole brain FNC analysis (E. Damaraju et al., 2014b). Homotopic networks are highly correlated, and their connectivity strength is much higher than that of heterotopic networks. Moreover, we found that the closer the homotopic pairs were to each other, the higher the connectivity strength became.
Results of Connectivity Strength
Results of comparison of connectivity strength between different FNC types are summarized in Figure 3 (for details see Table S2). Overall, in both patients and healthy controls, we observe higher intra-hemisphere connectivity strength in the right hemisphere compared to the left hemisphere, and right hemisphere intra-hemisphere connectivity is also stronger than inter-hemisphere connectivity. The left hemisphere appears to be connected with the right hemisphere and itself in a balanced way, although is also slightly more connected with itself. While subjects with schizophrenia show patterns of asymmetry in connectivity (for example the right hemisphere dominancy in connectivity) similar to healthy control subjects, there is a substantial decrease in asymmetry in schizophrenia subjects that suggests schizophrenia is associated with lower hemispheric connectivity dominance compared to healthy mental functioning.
Figure 3.
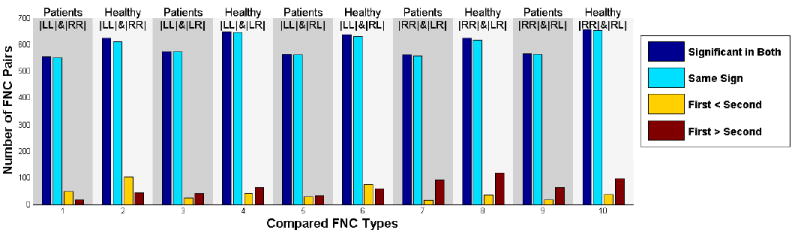
Comparing strength of connectivity in different FNC types for patients and healthy control groups. LL is the L_FNC, RR is the R_FNC, LR is the lower triangular of Inter_FNC, and RL is the upper triangular of Inter_FNC. Dark blue shows the number of regions significant in both of the corresponding FNCs, light blue shows the significant regions with same sign, yellow shows the number of regions having greater connectivity strength in FNC written in first, while red shows the number of regions having greater connectivity strength in FNC written in the second. The first and the second is the FNC type written in the subtitle consecutively. For instance, on the first comparison, we compare the strength of L_FNC in patients and R_FNC in patients therefore first is the L_FNC in patients and second is the R_FNC in patients.
Results of Regression Analysis
Many network-pairs show significant differences between L_FNC and R_FNC matrices (0.05 levels FDR corrected; see Figure 4). Almost all network-pairs show higher absolute connectivity strength in the right hemisphere (both positively and negatively correlated) compared to the left hemisphere. In contrast, the intra-hemisphere default mode network shows higher connectivity strength in the left compared to right hemisphere. Almost all networks in the most correlated functional domains (e.g., intra-visual, intra-sensorimotor, intra-default mode, and visual to sensorimotor networks) show higher connectivity strength in the right hemisphere relative to the left hemisphere. Intra-cognitive control has higher positive correlation between most of its network pairs, and there is a higher anti-correlation with its constituent anti-correlated network IC 63 (fusiform gyrus) in the right hemisphere relative to left hemisphere.
Figure 4.
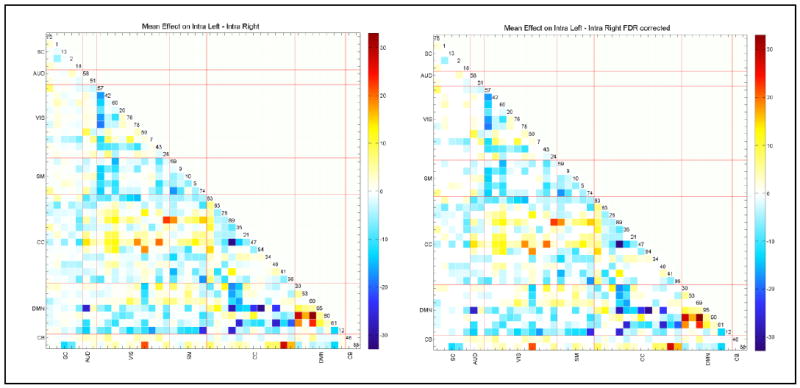
Paired t-test (L_FNC minus R_FNC) results in – log10(p-value)*sign(beta) format to compare left and right FNC on the left, and after 0.05 levels FDR correction on the right. A lot of networks pairs exhibit significant differences, mostly suggesting right hemisphere having more connectivity strength.
The effects of diagnosis, age, and gender on L_FNC and R_FNC asymmetry differences are presented in Figure 5. Diagnosis effects suggest mostly diminished hemispheric differences in patients relative to controls. Age does not show any significant effects on left-right differences while gender does in only two pairs, suggesting that age and gender have mostly similar patterns of intra-hemisphere connectivity. Handedness, cognitive scores, and positive and negative symptoms scores do not show any significant effects (after 0.05 levels FDR correction) on the L_FNC - R_FNC difference.
Figure 5.
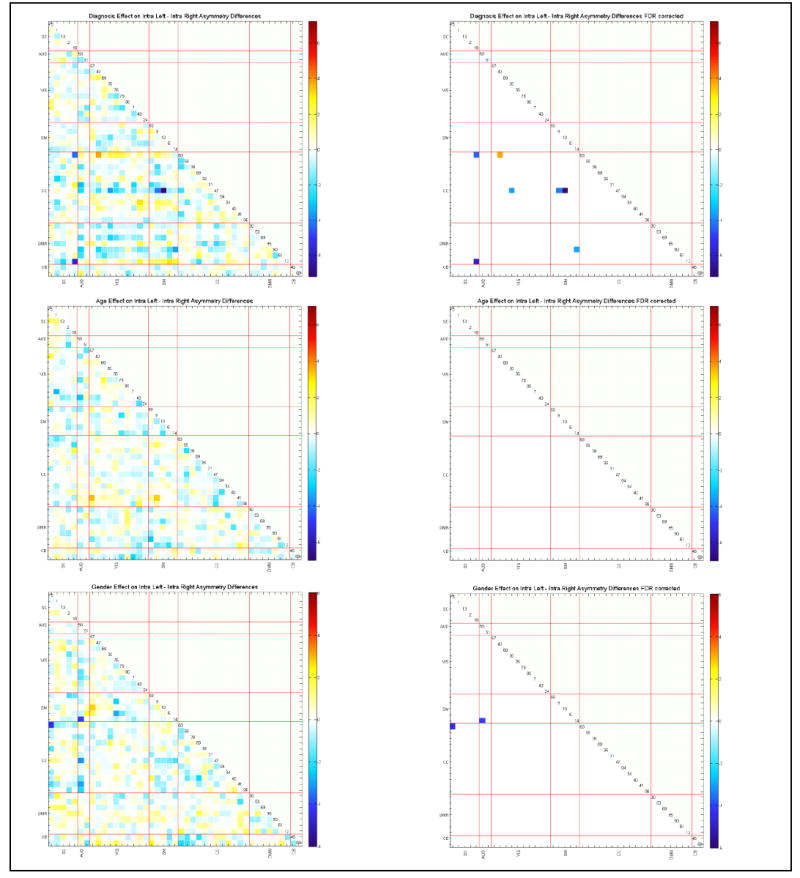
Regression results of age, gender and diagnosis effects on L_FNC and intra R_FNC asymmetry differences, presented in – log10(p-value)*sign(beta) format. With a cross check with on the mean L_FNC and R_FNC differences (Figure 4) leads the observation that patients have diminished left and right connectivity differences, consistent with our findings in comparing connectivity strength. Age and gender seems to affect both FNCs in similar ways.
The effects of diagnosis for all FNC types are presented in Figure 6. Schizophrenia appears to affect all FNC types similarly, though consistent with the conventional results (E. Damaraju et al., 2014b), the largest connectivity differences between subjects with schizophrenia and healthy controls are observed in the intra-auditory, visual and sensorimotor networks.
Figure 6.
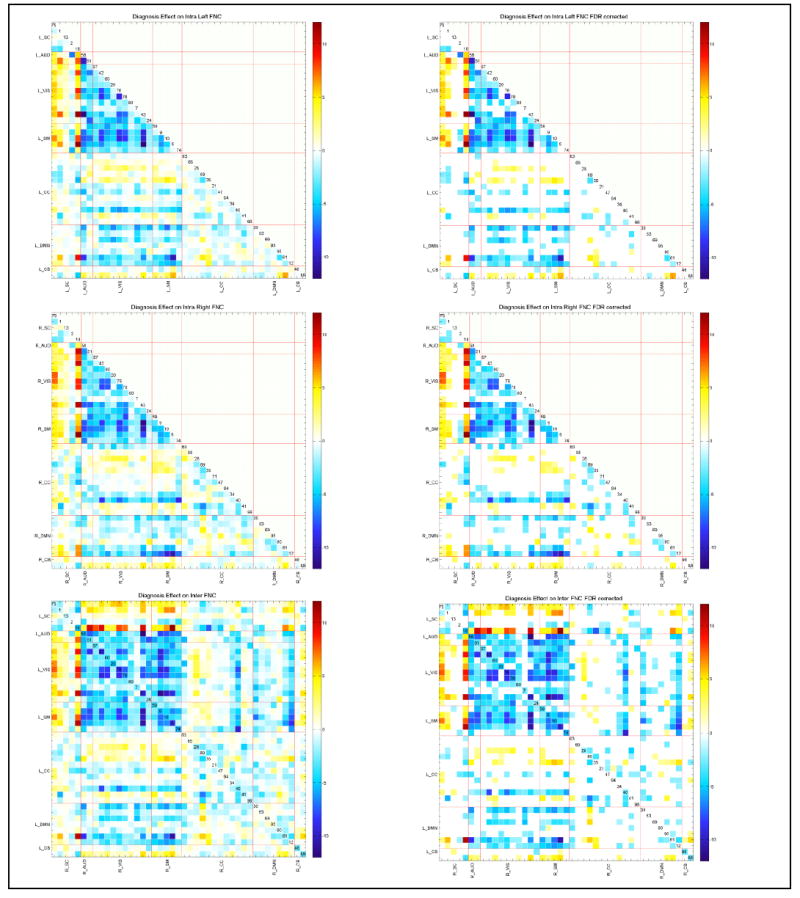
Schizophrenia effect on all FNC types, displayed as – log10(p-value)*sign(beta) format (at left column); after 0.05 levels FDR correction (at right column). General patterns look similar, for almost all pairs patients have weaker connectivity. Especially, the highly positively connected regions of auditory, visual, sensorimotor networks show less connectivity in patients.
Effects of Cognitive Scores, Symptom Scores and Mean Antipsychotic Dose
We examined whether cognitive scores, symptoms scores and mean antipsychotic dose were significantly associated with intra- and inter-FNCs or in left-right difference FNCs using separate regression models. Results did not indicate any significant association; therefore, we kept the results without abovementioned variables. (For detailed information on these analyses, see supplementary materials.)
Relationship of Euclidian Distance and Connectivity Strength
We found a strong linear relationship between connectivity strength and Euclidian distance for L_FNC (p=1.44e-60, r-squared=0.0131); R_FNC (p=4.026e-61, r-squared=0.0163); homotopic regions (p=8.36e-6, r-squared=0.386); and Inter_FNC (p=1.97e-9, r-squared=0.0367) (See Figure 7). Our results are consistent with Gee et al. (2011) and Stark et al. (2008), who also reported an inverse relationship between Euclidian distance and connectivity strength in FNC strength. Gee et al. (2011) and Stark et al. (2008) also examined whether distance alone can explain strength differences between intra- and inter-hemisphere connectivity and concluded that distance alone cannot explain strength differences between intra- and inter-hemisphere connectivity. Our findings of a significant difference between L_FNC and R_FNC are consistent with that conclusion; L_FNC and R_FNC have the same Euclidian distance and yet do have significant FNC strength differences.
Figure 7.
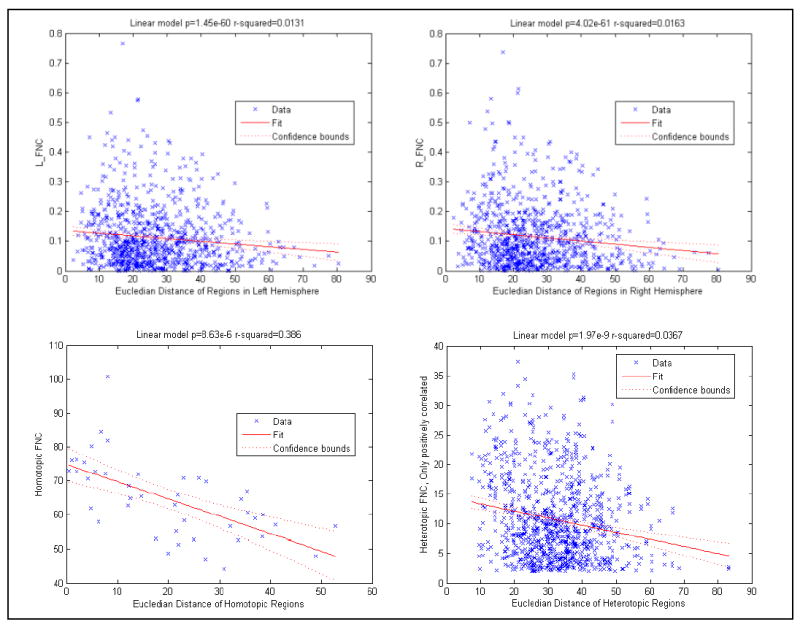
Linear regression results of Euclidian distance and connectivity strength. Both homotopic connectivity and heterotopic connectivity have an inverse relationship. Our findings of significant strength differences between L_FNC and R_FNC support that Euclidian distance difference cannot explain the strength differences between different FNC types.
DISCUSSION
We proposed a gICA approach to investigate hemispheric FNC differences within and between cerebral hemispheres; and between schizophrenia patients and healthy controls. We also investigated the effects of age, gender and handedness on hemispheric FNC. We found that subjects with schizophrenia have lower (both positive and negative) connectivity strength relative to healthy controls in all FNC types (L_FNC, R_FNC and Inter_FNC). We found pronounced connectivity strength differences between intra-left and intra-right FNCs, and between intra-hemisphere and inter-hemisphere connectivity in schizophrenia patients compared to healthy controls. Although the general pattern of schizophrenia effects in all three FNC types are similar and consistent with schizophrenia effects on conventional whole brain FNC (E. Damaraju et al., 2014b), our findings add evidence of diminished asymmetry of connectivity strength in schizophrenia patients relative to healthy controls. Laterality and connectivity have been shown to be abnormal in schizophrenia (Hoptman et al., 2012; Swanson et al., 2011) and our analysis addresses the intersection between these areas of inquiry.
Our analysis of homotopic regions reveals that homotopic regions have much higher connectivity strengths than heterotopic regions. Gee et al. (2011) also found significantly higher connectivity strength in homotopic regions as compared to heterotopic regions in their atlas-based study. Gee et al. (2011) also ranked the homotopic regions according to connectivity strength and found an inverse relationship with the Euclidean distance of homotopic regions and their connectivity strength.
We also found significant within-hemisphere connectivity magnitude differences favoring the right hemisphere, suggesting that the right hemisphere is more tightly functionally connected (both in terms of phase alignment and anti-alignment) than the left hemisphere. Previous results on intra-hemispheric connectivity have been mixed: our findings are consistent with several other studies showing higher connectivity strength in the right compared to the left hemisphere (Ribolsi et al., 2014), but run counter to findings of stronger intra-left connectivity (Gotts et al., 2013) and studies (Gee et al., 2011) that found no significant intra-hemispheric connectivity differences. Our study uses a relatively large sample size (151 schizophrenia patients and 163 healthy controls) while previous studies have low sample size ranging from 32 to 59 (Gee et al., 2011; Hoptman et al., 2012; Ke et al., 2010; Oertel-Knochel et al., 2013). Some diffusion tensor imaging studies also reported abnormal asymmetries between hemispheres in fractional anisotropy (FA) in schizophrenia patients comparing to healthy control (Ribolsi et al., 2014). Previous study (Miyata et al., 2012) found the rightward-shift of FA in the external capsule correlates with negative symptom severity, even though schizophrenia patients have a similar pattern of overall FA asymmetries with healthy subjects.
Regression analysis on L_FNC and R_FNC differences indicated that several functional networks including visual, sensorimotor and cognitive control showed higher connectivity strength in the right hemisphere; default mode network shows higher connectivity strength in the left hemisphere. Effects of diagnosis on the differences suggest that in these patients the differences are smaller, especially with connectivity involving cognitive control networks, which is consistent with a lack of lateralization in patients. Age and gender do not exhibit strong effects on the intra-hemisphere connectivity differences, which is consistent with our findings in 4D domain (Agcaoglu et al., 2015).
We did not find any significant relationship between lateralization and symptoms, nor did we find a relationship between cognitive scores and laterality. This suggests that the laterality abnormalities observed are more general reflections of the overall connectivity abnormalities in schizophrenia, but are not directly tied to the resulting symptoms or cognitive deficits observed in schizophrenia. As this was an eyes-closed resting fMRI study, it is possible that different results might be obtained for eyes-opened conditions. Additionally, it would be interesting to look more closely at time-varying connectivity to test if the laterality effect is changing throughout time and is being averaged out. Despite its limitation, this is one of the largest resting fMRI studies of schizophrenia and thus it strongly suggests that brain lateralization plays less of a role in the degree of manifestation of the illness than it does as an overall marker of schizophrenia.
What have we learned about the pathophysiology of schizophrenia form this large study? In chronically treated patients there is not only reduced overall FNC, but the normal FNC asymmetry is disturbed. There is a clear reduction in the hemispheric FNC asymmetries (R>L). In terms of inter-hemispheric connectivity, both homotypic and heterotypic FNCs are reduced. This suggests a global functional connectivity deficit in schizophrenia, similar to the whole brain gray matter volume reductions reported with MRI (Haijma, 2013) and wide-spread structural connectivity deficits (e.g., reduced fractional anisotropy) with DTI (Kanaan, 2005)). Hence, these global functional reductions may be secondary to gray matter and/or white matter deficits. Future longitudinal studies in schizophrenia may examine if the FNC deficits precede or follow structural reductions in gray and/or white matter.
Limitation
We should consider some limitations regarding interpreting the results. First, all schizophrenia patients were treated with antipsychotics, which could potentially confound the results even though analyses using antipsychotic doses did not reveal any significant effects. Though our subjects are ranging from age 18 to 60, they do not cover the most rapidly changing ages of childhood and adolescence; and overall the sample was not balanced in gender distribution (83 females, 231 males). Moreover, we focused on the resting state networks extracted from a previous study that has an ICA model order of 100 for comparison purposes, but it would also be interesting to evaluate hemisphere-specific FNCs with higher and lower model orders. Even though the study sample is large, the subjects were scanned for a minimum of 5 minutes 24 seconds (162 volumes); this may limit the sensitivity detection of the effects. Additionally, even though substantial efforts were taken to ensure that motion differences between patients and controls is not a confounder, residual motion confounds could still be present. Finally, this sample includes data from seven different sites, and even though we regressed out the site effects from the FNCs in the analysis, residual site confounds could be present.
Conclusion
In summary, we propose a gICA-based approach to determine hemisphere-specific timecourses and analyzed intra- and inter-hemisphere FNC differences in a resting-state fMRI dataset balanced between schizophrenia patients and healthy controls. We found diminished connectivity strength in patients compared with controls in all FNC types. A distinctive finding that has emerged from our hemispheric FNC analysis is that schizophrenia is associated with a significant reduction in hemispheric functional asymmetry. We also found that hemisphere-specific FNCs preserve the general connectivity patterns seen in conventional whole-brain FNC. Moreover, effects of schizophrenia distribute over intra-hemisphere and inter-hemisphere FNCs as much as they do over whole-brain FNC. Our analysis combines two streams of resting state-fMRI research: lateralization of functional networks and functional network connectivity. This analysis allowed us to extend and synthesize results of several previous studies tying schizophrenia to both abnormal network laterality and abnormal network connectivity. In future work, investigating hemisphere-specific FNCs in a dataset containing unmedicated schizophrenia patients and covering the full age range would help further our understanding of abnormal laterality of connectivity in schizophrenia.
Supplementary Material
Compliance with Ethical Standards.
This study was funded in part by NIH grants P20GM103472 and R01EB020407.
Author Oktay Agcaoglu, Author Robyn Miller, Author Eswar Damaraju, Author Barnaly Rashid, Author Juan Bustillo, Author Mustafa S. Cetin, Author Theo G.M. Van Erp, Author Sarah McEwen, Author Adrian Prada, Author Judith Ford, Author Dara S. Manoach, Author Kelvin O. Lim, Author Daniel H. Mathalon, Author Steven G. Potkin and Author Vince D. Calhoun declare that they have no conflict of interest.
All procedures followed were in accordance with the ethical standards of the responsible committee on human experimentation (institutional and national) and with the Helsinki Declaration of 1975 and the applicable revisions at the time of the investigation. Informed consent was obtained from all patients for being included in the study.
Acknowledgments
This work was supported in part by NIH grants P20GM103472 and R01EB020407.
References
- Agcaoglu O, Miller R, Mayer AR, Hugdahl K, Calhoun VD. Lateralization of resting state networks and relationship to age and gender. Neuroimage. 2014 doi: 10.1016/j.neuroimage.2014.09.001. [DOI] [PMC free article] [PubMed] [Google Scholar]
- Agcaoglu O, Miller R, Mayer AR, Hugdahl K, Calhoun VD. Increased spatial granularity of left brain activation and unique age/gender signatures: a 4D frequency domain approach to cerebral lateralization at rest. Brain Imaging Behav. 2015 doi: 10.1007/s11682-015-9463-8. [DOI] [PMC free article] [PubMed] [Google Scholar]
- Arbabshirani MR, Kiehl KA, Pearlson GD, Calhoun VD. Classification of schizophrenia patients based on resting-state functional network connectivity. Front Neurosci. 2013;7:133. doi: 10.3389/fnins.2013.00133. [DOI] [PMC free article] [PubMed] [Google Scholar]
- Broca Paul. Sur le principe des localisations cerebrales. Bulletin de la Societe d”Anthropologie. 1861;2:190–204. [Google Scholar]
- Cai Q, Van der Haegen L, Brysbaert M. Complementary hemispheric specialization for language production and visuospatial attention. Proc Natl Acad Sci U S A. 2013;110(4):E322–330. doi: 10.1073/pnas.1212956110. [DOI] [PMC free article] [PubMed] [Google Scholar]
- Calhoun VD, Adali T, Pearlson GD, Pekar JJ. A method for making group inferences from functional MRI data using independent component analysis. Hum Brain Mapp. 2001;14(3):140–151. doi: 10.1002/hbm.1048. [DOI] [PMC free article] [PubMed] [Google Scholar]
- Calhoun VD, Eichele T, Pearlson G. Functional brain networks in schizophrenia: a review. Front Hum Neurosci. 2009;3:17. doi: 10.3389/neuro.09.017.2009. [DOI] [PMC free article] [PubMed] [Google Scholar]
- Calhoun VD, Kiehl KA, Pearlson GD. Modulation of temporally coherent brain networks estimated using ICA at rest and during cognitive tasks. Hum Brain Mapp. 2008;29(7):828–838. doi: 10.1002/hbm.20581. [DOI] [PMC free article] [PubMed] [Google Scholar]
- Cetin MS, Christensen F, Abbott CC, Stephen JM, Mayer AR, Canive JM, Calhoun VD, et al. Thalamus and posterior temporal lobe show greater inter-network connectivity at rest and across sensory paradigms in schizophrenia. Neuroimage. 2014;97:117–126. doi: 10.1016/j.neuroimage.2014.04.009. [DOI] [PMC free article] [PubMed] [Google Scholar]
- Clements AM, Rimrodt SL, Abel JR, Blankner JG, Mostofsky SH, Pekar JJ, Cutting LE, et al. Sex differences in cerebral laterality of language and visuospatial processing. Brain Lang. 2006;98(2):150–158. doi: 10.1016/j.bandl.2006.04.007. [DOI] [PubMed] [Google Scholar]
- Damaraju E, Allen E, Calhoun VD. Impact of head motion on ICA-derived functional connectivity measures. Biennial Conference on Resting State / Brain Connectivity; Boston, MA. 2014a. [Google Scholar]
- Damaraju E, Allen EA, Belger A, Ford JM, McEwen S, Mathalon DH, Calhoun VD. Dynamic functional connectivity analysis reveals transient states of dysconnectivity in schizophrenia. Neuroimage-Clinical. 2014b;5:298–308. doi: 10.1016/j.nicl.2014.07.003. [DOI] [PMC free article] [PubMed] [Google Scholar]
- Erhardt EB, Rachakonda S, Bedrick EJ, Allen EA, Adali T, Calhoun VD. Comparison of Multi-Subject ICA Methods for Analysis of fMRI Data. Human Brain Mapping. 2011;32(12):2075–2095. doi: 10.1002/hbm.21170. [DOI] [PMC free article] [PubMed] [Google Scholar]
- Freire L, Roche A, Mangin JF. What is the best similarity measure for motion correction in fMRI time series? IEEE Trans Med Imaging. 2002;21(5):470–484. doi: 10.1109/TMI.2002.1009383. [DOI] [PubMed] [Google Scholar]
- Friston Karl. Beyond phrenology: what can neuroimaging tell us about distributed circuitry? Annual review of neuroscience. 2002;25(1):221–250. doi: 10.1146/annurev.neuro.25.112701.142846. [DOI] [PubMed] [Google Scholar]
- Gee DG, Biswal BB, Kelly C, Stark DE, Margulies DS, Shehzad Z, Milham MP, et al. Low frequency fluctuations reveal integrated and segregated processing among the cerebral hemispheres. Neuroimage. 2011;54(1):517–527. doi: 10.1016/j.neuroimage.2010.05.073. [DOI] [PMC free article] [PubMed] [Google Scholar]
- Genovese CR, Lazar NA, Nichols T. Thresholding of statistical maps in functional neuroimaging using the false discovery rate. Neuroimage. 2002;15(4):870–878. doi: 10.1006/nimg.2001.1037. [DOI] [PubMed] [Google Scholar]
- Gobbele R, Lamberty K, Stephan KE, Stegelmeyer U, Buchner H, Marshall JC, Waberski TD, et al. Temporal activation patterns of lateralized cognitive and task control processes in the human brain. Brain Res. 2008;1205:81–90. doi: 10.1016/j.brainres.2008.02.031. [DOI] [PubMed] [Google Scholar]
- Gotts SJ, Jo HJ, Wallace GL, Saad ZS, Cox RW, Martin A. Two distinct forms of functional lateralization in the human brain. Proc Natl Acad Sci U S A. 2013;110(36):E3435–3444. doi: 10.1073/pnas.1302581110. [DOI] [PMC free article] [PubMed] [Google Scholar]
- Haijma SV, Van Haren N, Cahn W, Koolschijn PCMP, Hulshoff Pol HE, Kahn RS. Brain Volumes in Schizophrenia: A MetaAnalysis in Over 18 000 Subjects. Schizophrenia Bulletin. 2013;39(5):1129–1138. doi: 10.1093/schbul/sbs118. http://doi.org/10.1093/schbul/sbs118. [DOI] [PMC free article] [PubMed] [Google Scholar]
- Hoptman MJ, Zuo XN, D’Angelo D, Mauro CJ, Butler PD, Milham MP, Javitt DC. Decreased interhemispheric coordination in schizophrenia: a resting state fMRI study. Schizophr Res. 2012;141(1):1–7. doi: 10.1016/j.schres.2012.07.027. [DOI] [PMC free article] [PubMed] [Google Scholar]
- Jafri MJ, Pearlson GD, Stevens M, Calhoun VD. A method for functional network connectivity among spatially independent resting-state components in schizophrenia. Neuroimage. 2008;39(4):1666–1681. doi: 10.1016/j.neuroimage.2007.11.001. [DOI] [PMC free article] [PubMed] [Google Scholar]
- Kanaan Richard AA, Kim JinSuh, Kaufmann Walter E, Pearlson Godfrey D, Barker Gareth J, McGuire Philip K. Diffusion Tensor Imaging in Schizophrenia. Biological Psychiatry. 2005 Dec 15;58(12):921929. doi: 10.1016/j.biopsych.2005.05.015. ISSN 00063223, http://doi.org/10.1016/j.biopsych.2005.05.015. [DOI] [PubMed] [Google Scholar]
- Ke M, Zou R, Shen H, Huang X, Zhou Z, Liu Z, Hu D, et al. Bilateral functional asymmetry disparity in positive and negative schizophrenia revealed by resting-state fMRI. Psychiatry Res. 2010;182(1):30–39. doi: 10.1016/j.pscychresns.2009.11.004. [DOI] [PubMed] [Google Scholar]
- Kubicki M, McCarley R, Westin CF, Park HJ, Maier S, Kikinis R, Shenton ME. A review of diffusion tensor imaging studies in schizophrenia. J Psychiatr Res. 2007;41(1-2):15–30. doi: 10.1016/j.jpsychires.2005.05.005. [DOI] [PMC free article] [PubMed] [Google Scholar]
- Liu H, Stufflebeam SM, Sepulcre J, Hedden T, Buckner RL. Evidence from intrinsic activity that asymmetry of the human brain is controlled by multiple factors. Proc Natl Acad Sci U S A. 2009;106(48):20499–20503. doi: 10.1073/pnas.0908073106. [DOI] [PMC free article] [PubMed] [Google Scholar]
- Lynall ME, Bassett DS, Kerwin R, McKenna PJ, Kitzbichler M, Muller U, Bullmore E. Functional connectivity and brain networks in schizophrenia. J Neurosci. 2010;30(28):9477–9487. doi: 10.1523/JNEUROSCI.0333-10.2010. [DOI] [PMC free article] [PubMed] [Google Scholar]
- Miyata J, Sasamoto A, Koelkebeck K, Hirao K, Ueda K, Kawada R, Murai T, et al. Abnormal asymmetry of white matter integrity in schizophrenia revealed by voxelwise diffusion tensor imaging. Hum Brain Mapp. 2012;33(7):1741–1749. doi: 10.1002/hbm.21326. [DOI] [PMC free article] [PubMed] [Google Scholar]
- Mohamed S, Paulsen JS, O’Leary D, Arndt S, Andreasen N. Generalized cognitive deficits in schizophrenia: a study of first-episode patients. Arch Gen Psychiatry. 1999;56(8):749–754. doi: 10.1001/archpsyc.56.8.749. [DOI] [PubMed] [Google Scholar]
- Mwansisya TE, Wang Z, Tao H, Zhang H, Hu A, Guo S, Liu Z. The diminished interhemispheric connectivity correlates with negative symptoms and cognitive impairment in first-episode schizophrenia. Schizophr Res. 2013;150(1):144–150. doi: 10.1016/j.schres.2013.07.018. [DOI] [PubMed] [Google Scholar]
- Nielsen JA, Zielinski BA, Ferguson MA, Lainhart JE, Anderson JS. An evaluation of the left-brain vs. right-brain hypothesis with resting state functional connectivity magnetic resonance imaging. PLoS One. 2013;8(8):e71275. doi: 10.1371/journal.pone.0071275. [DOI] [PMC free article] [PubMed] [Google Scholar]
- Oertel-Knochel V, Knochel C, Matura S, Prvulovic D, Linden DE, van de Ven V. Reduced functional connectivity and asymmetry of the planum temporale in patients with schizophrenia and first-degree relatives. Schizophr Res. 2013;147(2-3):331–338. doi: 10.1016/j.schres.2013.04.024. [DOI] [PubMed] [Google Scholar]
- Ribolsi M, Daskalakis ZJ, Siracusano A, Koch G. Abnormal asymmetry of brain connectivity in schizophrenia. Front Hum Neurosci. 2014;8:1010. doi: 10.3389/fnhum.2014.01010. [DOI] [PMC free article] [PubMed] [Google Scholar]
- Rotarska-Jagiela A, Schonmeyer R, Oertel V, Haenschel C, Vogeley K, Linden DE. The corpus callosum in schizophrenia-volume and connectivity changes affect specific regions. Neuroimage. 2008;39(4):1522–1532. doi: 10.1016/j.neuroimage.2007.10.063. [DOI] [PubMed] [Google Scholar]
- Stark DE, Margulies DS, Shehzad ZE, Reiss P, Kelly AM, Uddin LQ, Milham MP. Regional variation in interhemispheric coordination of intrinsic hemodynamic fluctuations. J Neurosci. 2008;28(51):13754–13764. doi: 10.1523/JNEUROSCI.4544-08.2008. [DOI] [PMC free article] [PubMed] [Google Scholar]
- Swanson N, Eichele T, Pearlson G, Kiehl K, Yu Q, Calhoun VD. Lateral differences in the default mode network in healthy controls and patients with schizophrenia. Hum Brain Mapp. 2011;32(4):654–664. doi: 10.1002/hbm.21055. [DOI] [PMC free article] [PubMed] [Google Scholar]
- Tang C, Zhao Z, Chen C, Zheng X, Sun F, Zhang X, Jia J. Decreased Functional Connectivity of Homotopic Brain Regions in Chronic Stroke Patients: A Resting State fMRI Study. PLoS One. 2016;11(4):e0152875. doi: 10.1371/journal.pone.0152875. [DOI] [PMC free article] [PubMed] [Google Scholar]
- van Erp TG, Preda A, Turner JA, Callahan S, Calhoun VD, Bustillo JR, Fbirn, et al. Neuropsychological profile in adult schizophrenia measured with the CMINDS. Psychiatry Res. 2015;230(3):826–834. doi: 10.1016/j.psychres.2015.10.028. [DOI] [PMC free article] [PubMed] [Google Scholar]
- Wernicke Carl. Der aphasische Symptomencomplex. Eine psychologische Studie auf anatomischer Basis; Breslau, M Crohn und Weigert 1874 [Google Scholar]
- Yu Q, Allen EA, Sui J, Arbabshirani MR, Pearlson G, Calhoun VD. Brain connectivity networks in schizophrenia underlying resting state functional magnetic resonance imaging. Curr Top Med Chem. 2012;12(21):2415–2425. doi: 10.2174/156802612805289890. [DOI] [PMC free article] [PubMed] [Google Scholar]
- Zhu L, Fan Y, Zou Q, Wang J, Gao JH, Niu Z. Temporal reliability and lateralization of the resting-state language network. PLoS One. 2014;9(1):e85880. doi: 10.1371/journal.pone.0085880. [DOI] [PMC free article] [PubMed] [Google Scholar]
- Zuo XN, Kelly C, Di Martino A, Mennes M, Margulies DS, Bangaru S, Milham MP, et al. Growing together and growing apart: regional and sex differences in the lifespan developmental trajectories of functional homotopy. J Neurosci. 2010;30(45):15034–15043. doi: 10.1523/JNEUROSCI.2612-10.2010. [DOI] [PMC free article] [PubMed] [Google Scholar]
Associated Data
This section collects any data citations, data availability statements, or supplementary materials included in this article.