

Highlights
-
•
In Spain, diabetic retinopathy (DR) prevalence in type 2 diabetic patients was 14.9%.
-
•
DR was higher in women and older patients.
-
•
eGFR, duration of disease, HbA1c ≥ 7% and high blood pressure were associated with DR.
-
•
DR was also higher in patients taking insulin.
-
•
Patients with DR used to have comorbidities more frequently.
Keywords: Diabetes mellitus, Diabetic retinopathy, Risk factors, eGFR
Abstract
Aim
Diabetic retinopathy (DR) is the leading cause of blindness in working age population in developed countries. Albuminuria and estimated glomerular filtration rate (eGFR) have been considered biomarkers for DR. This study aimed to investigate the prevalence of DR and its relationship with eGFR and other risk factors in type 2 diabetic patients (T2DM) in Spain.
Methods
A cross-sectional and descriptive study has been performed in 14,266 patients. Clinical records were reviewed. Demographic data, clinical diagnoses, clinical variables, and results from laboratory tests were recorded. Prevalence rates of DR were calculated. Logistic regression analysis was applied to assess predictors of the DR presence/absence.
Results
DR prevalence was 14.9%, being more prevalent in women (p = 0.0087) and in older patients (p < 0.0001). Duration of disease (OR = 5.3, IC95% = 3.8–7.4; p < 0.0001), eGFR < 60 ml/min/1.73 m2 (OR = 2.0, IC95% 1.6–2.4; p < 0.0001), levels of HbA1c ≥ 7% (OR = 1.9, IC95% = 1.5–2.3; p < 0.0001) and high blood pressure (OR = 1.6, IC95% = 1.2–2.1; p = 0.0032) were associated with higher risk of DR. DR was also more frequent in patients taking insulin (32,6% vs. 10,2%; p < 0.0001).
Conclusion
Around one in seven patients with T2DM has DR after nine years since diagnosis. Time since diagnosis, insulin therapy, cardiovascular profile, and renal dysfunction are associated with DR in patients with T2DM in Spain.
Introduction
Diabetic care has improved during the past years, and yet diabetic retinopathy (DR) and diabetic macular oedema (DME) are the leading causes of blindness and severe visual loss among working-age population around the world. In 2010, almost 2% of the diabetic patients were legally blind and 10.2% had visual impairment, worldwide [1]. Both diabetic complications are also responsible for a significant worsening of quality of life [2]. The problem is being aggravated by the fact that currently diabetes mellitus (DM) is a global epidemic and that both type 1 and type 2 diabetic patients are not exempt from the development of diabetic complications. Blood glucose, blood pressure, serum lipids, and smoking are some of the modifiable risk factors associated with progression of DR [3].
DM early detection and treatment help to reduce the new cases of DR and delay the progression to severe visual loss. Several modifiable and non-modifiable risk factors have been associated with DR development. Modifiable risk factors for DR progression are glucose metabolic control, blood pressure, serum lipids and smoking. In the other hand, non-modifiable risk factors for DR are duration of the DM, age, genetic predisposition and ethnicity [4], [5].
The prevalence of DR is not clear as most of the studies conducted all around the world differed widely, ranging from 14% to 40%. DR prevalence is even higher, 64%, in epidemiological studies based on insulin therapy databases. The DR prevalence rate in the study conducted by Kempen et al. in United States was 40% [6] while in the study conducted by Wong et al. in Malay adults in Singapore was 33% [7]. Yau et al. with a meta-analysis and Ruta et al. with a detailed literature search evaluated the global DR prevalence and found rates of 35% [8] and 28% [9], respectively. The literature published within the past ten years consistently revealed higher DR prevalence in Western countries compared with Middle-East and Asian countries. The DR prevalence differed widely even in the studies performed in same country and city. For instance, in the Beijing Eye Study 2006 the reported prevalence among diabetic Chinese adult was about 28% and in the Beijing eye study in patients older than 40 was about 37% [10]. Similarly, the DR prevalence in Spain differs among studies, with rates varying from 7% to 26% [3], [11], [12], [13]. The differences in DR prevalence among Spanish studies could be due to the methodology used, clinical and socio-demographic differences in the populations included as well as differences in DR risk factors.
There are many proposed risk factors in the development of DR. For instance, time from diagnosis is a key DR risk factor and in many studies the presence of DR 20 years after DM diagnosis was presented in 66% of patients with T2DM and in near 100% of patients with type 1 DM [3]. Likewise, obesity is very common DR risk factor in patients with T2DM, which should always be considered in all the studies. In Spain, according to a questionnaire of the National Health System from 2010, the prevalence rate of obesity and overweight in the overall population was 15% and 37%, respectively [14]. Likewise, albuminuria has been considered a biomarker for the risk for DR in diabetic patients but its role has been questioned. The estimated glomerular filtration rate (eGFR) as a measure of renal function has been considered a useful alternative biomarker by some authors. However, due to the relationship between albuminuria and eGFR, the use of eGFR as a biomarker for the risk for DR should be proven [15].
The objective of the present study was to determine the DR prevalence, DR risk factors and DR relationship with eGFR in patients with T2DM included in three epidemiological studies (HIPOQoL, OBEDIA and PATHWAYS studies) conducted in Spain [16], [17], [18].
Methods
Study, design, settings and population
The DM2 HOPE study is a cross-sectional and descriptive study that has been performed in patients included in three epidemiological multicenter studies in patients with T2DM conducted in Spain between 2009 and 2011: 1) OBEDIA, a study designed to assess the T2DM prevalence in patients with overweight or obesity [17]. 2) HIPOQoL-II, a study to assess the quality of life in T2DM patients in Spain [16]. 3) PATHWAYS, a study to assess the reasons for referral of T2DM to the specialists in Spain [18]. All the studies were approved by the Ethics Committee from the Hospital Clinic de Barcelona. All the patients included in the three study were diagnosed as affected by T2DM (International Classification of Diseases 10 codes E11 and E14) had signed the informed consent.
For the present analyses patients from the three studies were included if they were older than 18 years, had a diagnosis of T2DM, had data about the presence or absence of DR, and had eGFR available. Patient’s clinical history was reviewed and the following information was collected: demographic data, appointment dates, clinical diagnoses, clinical variables, prescribed medication, referrals to specialists and hospitals, and laboratory tests results. DR was evaluated by well-trained ophthalmologists by using mydriasis, ophthalmoscopy and posterior pole biomicroscopy. The severity of the disease was defined following the International Diabetic Retinopathy Severity Scale. Retinopathy was considered present if any of the following lesions were detected: microaneurysms, hemorrhages, hard exudates, cotton wool spots, venous beading, new vessels, proliferative vitreoretinopathy, laser scars, retinal detachment or vitreous hemorrhages. Whenever ocular fundus could not be graded due to inadequate dilation or media opacities, patients were excluded from the study. Likewise, it was checked that the diagnosis of diabetic complications and comorbidities was carried out by a specialist with the standardized exam/test used in the routine clinical practice of each centre. EGFR was estimated using the abbreviated (four-variable) Modified Diet in Renal Disease (MDRD-4) equation [19]. Renal impairment (RI) was defined as eGFR < 60 ml/min/1,73 m2 for an estimated creatinine clearance < 60 ml/min. Laboratory tests results included total serum cholesterol, high-density lipoprotein (HDL), low density lipoprotein (LDL), serum triglycerides (TG) and glycaemic control (measured by HbA1 C). Registre sanitari del cor (REGICOR) score (Framingham risk score adaptation to Spanish population) were used in order to assess cardiovascular risk (CVR). In the study visit of the three studies, the systolic and diastolic blood pressures were measured. Lifestyle (smoking and dietary habits, physical activities and alcohol consumption) was collected by directly asking the patient. In the analysis, a smoker was defined as either a current smoker or a subject who had stopped smoking within the previous 12 months.
Data analysis
The difference between DR and non DR was assessed according to variables related with retinopathy. The correlation of DR with different risk factors was also evaluated. Logistic regression analysis was applied to assess predictors of the DR presence/absence.
Description of the qualitative variables was performed using absolute (i.e. counts) and relative (i.e. percentages) frequencies while quantitative variables using mean (standard deviation [SD] or 95% confidence interval [95%CI]) or median (interquartile range [IQR]) values. The results of the multivariable analysis included the odds ratios (ORs) and 95%CI. The software used in the analysis was SAS version 9.2 for Windows.
Categorical and continuous variables were summarised as percentages and mean ± standard deviation (SD), respectively. Missing values were not included in the count. Qualitative variables were analysed by the Chi-square test or the Fisher exact test, as appropriate, and quantitative variables were analysed using the t-test or the Mann-Whitney test. A p-value < 0.05 was considered statistically significant. Statistical analyses were performed using the SAS® statistical package for Windows (version 9.2, SAS Institute Inc., Cary, NC, USA).
Results
The clinical history of 14,266 patients was reviewed. Table 1 shows the socio-demographic, clinical and lifestyle characteristics as well as the comorbidities of the total cohort and according to the presence or absence of DR. Briefly for the total cohort, the mean (SD) age was 64.3 (11.2) years, the mean time from T2DM duration was 9.0 (7.1) years, the mean HbA1c level was 7.3% (1.2%), with 42.2% of patients with HbA1c levels below 7%. Half patients (49.8%) were obese and 40.5% had overweight. Half patients had a familiar history of diabetes (55.7%) while almost three-quarters of patients had dyslipidaemia (74.1%) and hypertension (72.9%). A total of 74% of patients were treated with oral agents, 3.3% with insulin and 22.7% with both medications.
Table 1.
Socio-demographic characteristics, clinical history, diabetic complications and comorbidities, and lifestyle habits in the total cohort and according to the presence of DR.
| DR absence (n = 10910) | DR presence (n = 1910) | Total cohort‡ (n = 14 266) | |
|---|---|---|---|
| Socio-demographic Characteristics | |||
| Sex, n (%)* | |||
| Men | 5707 (52.5%) | 939 (49.3%) | 7374 (51.9%) |
| Women | 5159 (47.5%) | 967 (50.7%) | 6825 (48.1%) |
| Age at study visit (y), mean (SD)** | 64.1 (11.4) | 68.6 (9.9) | 64.3 (11.2) |
| Caucasian ethnicity | 7002 (96.9%) | 1286 (96.8%) | 9558 (96.5%) |
| University studies* | 475 (6.5%) | 58 (4.2%) | 682 (6.8%) |
| Clinical history | |||
| T2 DM duration (y), mean (SD)*** | 8.4 (6.6) | 14.0 (8.5) | 9.0 (7.1) |
| Familiar history of diabetic, n (%)*** | 4866 (54.6%) | 1043 (63.4%) | 6669 (55.7%) |
| HbA1c levels (%), mean (SD)†*** | 7.19 (1.2) | 7.66 (1.2) | 7.3 (1.2) |
| HbA1c < 7%, n (%) | 2956 (45.5%) | 274 (27.5%) | 3270 (42.2%) |
| HbA1c ≥ 7% - < 9%, n (%) | 3048 (46.9%) | 588 (59.1%) | 3785 (48.8%) |
| HbA1c ≥ 9%, n (%) | 496 (7.6%) | 133 (13.4%) | 703 (9.1%) |
| BMI, n (%) | 30.77 (5.0) | 30.72 (5.1) | 30.60 (5.1) |
| Healthy weight (BMI < 25 kg/m2), n (%) | 920 (8.4%) | 189 (9.9%) | 1386 (9.7%) |
| Overweight (BMI ≥ 25- < 30 kg/m2), n (%) | 4371 (40.1%) | 751 (39.3%) | 5771 (40.5%) |
| Obese (BMI ≥ 30 kg/m2), n (%) | 5618 (51.5%) | 971 (50.8%) | 7109 (49.8%) |
| Abdominal circumference (cm), mean (SD) | 103.06 (13.8) | 103.10 (14.6) | 102.0 (14.2) |
| Men | 105.2 (13.3) | 104.6 (13.7) | 104.9 (13.5) |
| Women* | 100.6 (13.9) | 101.6 (15.4) | 100.4 (14.5) |
| Dyslipidemia, n (%)†*** | 5381 (73.7%) | 1167 (85.1%) | 7486 (74.1%) |
| Total Cholesterol (mg/dL), mean (SD) | 198.64 (41.5) | 200.68 (42.6) | 199.60 (41.3) |
| LDL Cholesterol (mg/dL), mean (SD) | 119.70 (35.9) | 121.99 (38.6) | 120.59 (36.3) |
| HDL Cholesterol (mg/dL), mean (SD)*** | 50.36 (17.7) | 48.44 (15.7) | 50.10 (17.3) |
| Triglycerides (mg/dL), mean (SD)** | 160.50 (91.5) | 165.63 (101.6) | 160.94 (92.2) |
| Comorbidities | |||
| Nephropathy, n (%)*** | 1647 (15.1%) | 762 (39.9%) | 2409 (18.8%) |
| eGFR (ml/min/1.73 m2), median (IQR)†*** | 75.2 (61.4–91.0) | 65.1 (51.3–82.5) | 73.8 (59.5–90.0) |
| eGFR ≥ 90 (mL/min), n (%) | 1612 (26.8%) | 161 (17.7%) | 1783 (25.2%) |
| 60 ≥ eGFR < 90 (mL/min), n (%) | 3002 (49.9%) | 378 (41.5%) | 3472 (49.0%) |
| 30 ≥ eGFR < 60 (mL/min), n (%) | 1297 (21.6%) | 334 (36.6%) | 1686 (23.8%) |
| eGFR < 30 (mL/min), n (%) | 108 (1.8%) | 39 (4.30%) | 147 (2.1%) |
| Creatinine level (mg/dl), mean (SD)†*** | 1.0 (0.4) | 1.1 (0.5) | 1.0 (0.4) |
| Urine albumin/creatinine ratio (mg/g), mean (SD)†*** | 4.9 (2.3) | 4.3 (2.6) | 4.8 (2.3) |
| Hypertension, n (%)†*** | 5398 (74.2%) | 1183 (87.1%) | 7339 (74.1%) |
| SBP/DBP < 130/80 mmHg, n (%) | 1343 (18.4%) | 165 (12.1%) | 1809 (18.0%) |
| 130/80 ≤ SBP/DBP ≤ 139/89 mmHg, n (%) | 2416 (33.1%) | 386 (28.2%) | 3320 (33.0%) |
| SBP/DBP ≥ 140/90 mmHg, n (%) | 3548 (48.6%) | 816 (59.7%) | 4937 (49.1%) |
| Cerebrovascular disease, n (%)*** | 514 (4.7%) | 259 (13.6%) | 773 (6.0%) |
| Cardiovascular disease, n (%)†*** | 2017 (28.5%) | 631 (47.5%) | 2867 (29.3%) |
| Diabetic foot, n (%)*** | 364 (3.3%) | 231 (12.1%) | 595 (4.6%) |
| Peripheral arteriopathy, n (%)*** | 970 (8.9%) | 456 (23.9%) | 1426 (11.1%) |
| Lifestyle | |||
| Dietary restrictions, n (%)* | 8404 (79.3%) | 1526 (82.4%) | 11035 (79.4%) |
| Tobacco use** | 2148 (19.8%) | 306 (16.2%) | 2681 (18.9%) |
| Alcohol consumption | 2192 (21.1%) | 353 (19.6%) | 2872 (21.2%) |
| Sedentarism, n (%)*** | 6405 (63.0%) | 1288 (71.6%) | 8512 (63.6%) |
BMI, body mass index; DBP, diastolic blood pressure; DR, diabetic retinopathy; eGFR, estimated glomerular filtration rate; HDL, high-density lipoprotein; IQR, interquartile range; LDL, low density lipoprotein; SBP, systolic blood pressure; SD, standard deviation; T2DM, type 2 diabetes mellitus; y, years.
Statistical significant differences are given with degree of significance indicated (*p < 0.05, **p < 0.001. ***p < 0.0001)
†No data from HIPOQoL II were available. Percentage calculated over the total number of patients in OBEDIA + PATHWAYS studies.
Information about the presence of DR was missing in 1446 patients.
Table 2 shows the prevalence of DR in the total cohort (14.9%) and according to sex, age, diabetes control and dyslipidemia. A higher prevalence of DR was observed in women compared with men (p = 0.0087), in older patients (19.2% in patients ≥65 years vs. 10.1% in patients <65 years, p < 0.0001), in patients with HbA1c ≥ 9% compared with patients with HbA1c ≤ 7% (p < 0.0001) and in patients with dyslipidemia (p < 0.0001). Similarly, higher prevalence of DR was observed in patients with higher TG (p = 0.0006), lower HDL levels (p < 0.0001), longer T2DM duration (p < 0.0001) and in patients taking insulin (32.6% vs. 10.2%; p < 0.0001) (Figs. 1 and 2, respectively). Likewise, higher prevalence of DR was observed in patients with hypertension (18.0% vs. 8.5%, p < 0.0001) as well as in patients with history of cardiovascular disease (23.8% vs. 12.1%, p < 0.0001), cerebrovascular disease (33.5% vs. 13.7%, p < 0.0001) and diabetic nephropathy (31.6% vs. 11%, p < 0.0001). Thus, patients with DR seemed to have had more frequently diabetic complications and comorbidities. Patients with more CVR used to have more frequently higher DR prevalence rates (19.7% CVR high/very high vs. 11.5% low/moderate). The prevalence of DR was 12.3% in patients with a very high CVR (REGICOR) and 6.9% in patients with a low CVR (p = 0.0017).
Table 2.
Prevalence of DR in the total cohort and according sex, age, diabetes control and dyslipidemia.
| DR prevalence, n (%) | p-values | |
|---|---|---|
| Total cohort (n = 12820) | 1 910 (14.9%) | |
| According to | ||
| Sex | 0.0087 | |
| Men (n = 6646) | 939 (14.1%) | |
| Women (n = 6126) | 967 (15.8%) | |
| Age | p < 0.0001 | |
| 18–44 years (n = 559) | 29 (5.2%) | |
| 45–64 years (n = 5534) | 587 (10.6%) | |
| 65–74 years (n = 4066) | 724 (17.8%) | |
| ≥75 years (n = 2661) | 569 (21.4%) | |
| HbA1c levels | p < 0.0001 | |
| HbA1c ≤ 7% (n = 3230) | 278 (8.6%) | |
| HbA1c > 7% – < 9% (n = 3636) | 589 (16.2%) | |
| HbA1c ≥ 9% (n = 629) | 138 (21.9%) | |
| Dyslipidemia | p < 0.0001 | |
| Presence (n = 6548) | 1166 (17.8%) | |
| Absence (n = 2129) | 204 (9.6%) |
DR, diabetic retinopathy; T2DM, type 2 diabetes mellitus.
Fig. 1.
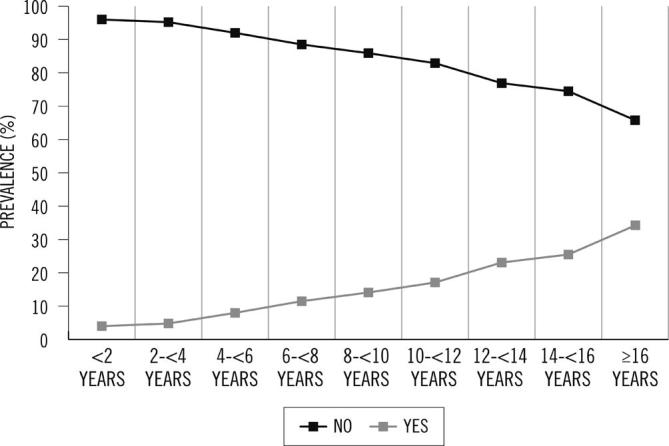
Prevalence of DR and diabetes duration.
Fig. 2.

Prevalence of DR and type of treatment.
Logistic regression analysis showed that patients with a disease duration 15 years or longer presented a 5.3 times greater chance to have DR than patients with a disease duration under 5 years (OR = 5.3; 95%CI = 3.8–7.4; p < 0.0001). Patients with an eGFR < 60 ml/min/1.73 m2 had a 2.0 greater chance to have DR than patients with an eGFR > 60 ml/min/1.73 m2 (OR = 2.0; 95%CI = 1.6–2.4; p < 0.0001). Regarding glycemic control, patients with levels of HbA1c ≥ 7% had a 1.9 greater chance to have DR than patients with levels of HbA1c below 7% (OR = 1.9; 95%CI = 1.5–2.3; p < 0.0001). Finally, patients with hypertension presented a 1.6 greater chance to have DR than patients without hypertension (OR = 1.6, IC95% = 1.2–2.1; p = 0.0032) (Fig. 3). No significant association between smoking or alcohol consumption and DR was found.
Fig. 3.

Multiple logistic regression analysis to assess predictors of the DR presence/absence.
Discussion
Recent studies have reported that the prevalence of DM in Spain is increasing and, as is well known, a relevant number of these patients will develop ocular complications (e.g. DR) leading to blindness. The DM2 HOPE study has one of the largest population based study cohorts in Spain and the analysis presented here focuses on the prevalence of DR in T2DM patients.
The overall prevalence rate of DR in Spanish T2DM patients was 15%. This rate is considerably low compared to the rates reported in others Spanish studies, with the exception of that reported in the Basque Country, which showed the lowest DR prevalence rates reported; 7.2% [11]. Divergences in population baseline characteristics (both clinical and socio-demographic), methodology used and DR risk factors can be responsible for the observed DR differences [2]. For instance, in this study ophthalmoscopy was used to diagnose DR. Prevalence seems to be lower when the diagnosis is based on ophthalmoscopy and higher when is based on photographic methods [20], [21]. Digital retinography is considered a useful screening tool for evaluating diabetic retinopathy and particularly ETDRS 7 field digital retinography is considered the Gold Standard in DR diagnosis and monitoring for improvement or progression of DR over time [22], [23]. Thus, ophthalmoscopy probably explains the low DR prevalence reported here. Nevertheless, it does not explain the low rate compared to other Spanish population based studies that used digital retinography, like the study of Rodriguez Poncela et al. conducted in Catalonia; 12.3% in DR prevalence [22]. However, there are many clinical characteristics that could explain the studies' discrepant result. For example, the mean HbA1c level and the diabetes duration were lower in the Catalonian population based study; 7.15% vs. 7.34% and 7.2 (1.3) years vs. 9.0 (7.1) years, respectively. HbA1c level and diabetes duration are risk factors for DR.
In relation to DR risk factors, some studies suggest that the glycaemia, lipids, blood pressure, body weight, smoking and pregnancy status are common risk factors [24]. We found a significant association between the presence of DR and hypertension, diabetes duration, glycaemic control and eGFR. Regarding the hypertension, other studies have showed the importance of blood pressure in the progression of DR. For instance, the United Kingdom Prospective Diabetes Study (UKPDS) found that the risk of DR progression could be reduced by 34% and the risk of a significant loss of visual acuity by 47% in patients with a blood pressure <150/85 mmHg compared with patients with <180/105 mmHg [25]. Age has also been suggested as another important risk factor, but study results are inconsistent. In our cohort, the prevalence of DR varies from 5.2% in patients younger than 44 years to 21.4% in patients older than, or equal to, 75 years old. Similar results have been described for other authors [26]. However, Kyung-Chul Y et al. did not found differences in the prevalence of DR in relation to age or gender [27].
Regarding the eGFR, similar results were observed by Man et al. and Rodriguez Poncelas et al. [15], [22]. Both authors found that impaired renal function and chronic kidney disease (CKD) were associated with the presence of DR when compared to normal renal function. The correlation with DR and family history of DM was not assessed since the unawareness among most patients about the strong link between family history of DM and DM systemic complications. No significant associations were found between DR and smoking or alcohol consumption in this study. The lack of association with the smoking habits was probably due to the low prevalence of smoking in the cohort.
The present study has some strengths and limitations. The main strengths are that the analysis included patients from all the regions of Spain, access to patients’ clinical history data and information about DR. Likewise, the big sample size is also a strength. On the other hand, the main limitation is the study design, a pool analysis from three cross-sectional studies. Other limitation is the DR diagnosis, based on ophthalmoscopy instead of digital retinography. In addition, neither DR nor diabetic complications and comorbidities were confirmed by a specialist at the study visit. The lack of data about the presence/absence of DME is another limitation since it is the most common cause of visual loss in T2MD patients. The analysis of most of the variables was only performed for the total cohort of patients and according to the presence of DR. The lack of analysis according to the sex represents a limitation since DR risk factors may be different for women and men.
Finally, the results of this study highlight the substantial public health burden of DR and the importance of finding DR modifiable risk factors. However, more population-based cohort studies are needed in order to confirm the associations reported in the present study.
Conclusions
Around one in seven T2DM patients had DR after nine years since diagnosis. Time since diagnosis, insulin therapy, cardiovascular profile (risk factors/events), and renal dysfunction were associated with DR in T2DM patients. Population based cohort studies are needed to confirm these associations in order to support DR screening measures in the future.
Acknowledgements
We thank OBEDIA, HIPOQoL-II and PATHWAYS participants and Novartis Pharmaceuticals, S.A., Barcelona (Spain) support.
Acknowledgments
Funding
Financial support was provided by Novartis Farmacéutica, S.A., Barcelona, Spain.
Acknowledgments
Conflict of interests
Dr. Maribel López has received speaking and/or advisory board honoraria from Novartis, Bayer, Lilly and Boeringher Inghelheim.
Dr. F Xavier Cos has received speaking and/or advisory board honoraria from Sanofi, Novo Nordisk, Boeringher-Ingelheim, Lilly, Novartis, MSD, Roche diagnostics, Astra Zeneca.
Dr. Fernando Álvarez-Guisasola has received speaking and/or advisory board honoraria from AstraZeneca, Eli Lilly, Merck, NovoNordisk, Sanofi-Aventis and Johnson & Johnson.
Eva Fuster is employee from Novartis.
Contributor Information
Maribel López, Email: Marilopez535.mlg@gmail.com.
Francesc Xavier Cos, Email: xcos.claramunt@gmail.com.
Fernando Álvarez-Guisasola, Email: f.a.guisasola@gmail.com.
Eva Fuster, Email: eva.fuster@novartis.com.
References
- 1.Romero-Aroca P., Sagarra-Alamo R., Pareja-Rios A., López M. Importance of telemedicine in diabetes care: Relationships between family physicians and ophthalmologists. World J Diab. 2015 Jul 25;6(8):1005–1008. doi: 10.4239/wjd.v6.i8.1005. [DOI] [PMC free article] [PubMed] [Google Scholar]
- 2.Wild S., Roglic G., Green A., Sicree R., King H. Global prevalence of diabetes: estimates for the year 2000 and projections for 2030. Diabetes Care. 2004 May;27(5):1047–1053. doi: 10.2337/diacare.27.5.1047. [DOI] [PubMed] [Google Scholar]
- 3.Scanlon P.H., Aldington S.J., Stratton I.M. Epidemiological issues in diabetic retinopathy. Middle East Afr J Ophthalmol. 2013 Dec;20(4):293–300. doi: 10.4103/0974-9233.120007. [DOI] [PMC free article] [PubMed] [Google Scholar]
- 4.Klein R, Klein BE, Moss SE, Davis MD, DeMets DL. The Wisconsin epidemiologic study of diabetic retinopathy. III. Prevalence and risk of diabetic retinopathy when age at diagnosis is 30 or more years. Arch Ophthalmol Chic Ill 1960. 1984 Apr; 102(4):527–32. [DOI] [PubMed]
- 5.Younis N., Broadbent D.M., Harding S.P., Vora J.R. Prevalence of diabetic eye disease in patients entering a systematic primary care-based eye screening programme. Diabet Med J Br Diabet Assoc. 2002 Dec;19(12):1014–1021. doi: 10.1046/j.1464-5491.2002.00854.x. [DOI] [PubMed] [Google Scholar]
- 6.Kempen JH, O’Colmain BJ, Leske MC, Haffner SM, Klein R, Moss SE, et al. The prevalence of diabetic retinopathy among adults in the United States. Arch Ophthalmol Chic Ill 1960. 2004 Apr; 122(4):552–63. [DOI] [PubMed]
- 7.Wong T.Y., Cheung N., Tay W.T., Wang J.J., Aung T., Saw S.M. Prevalence and risk factors for diabetic retinopathy: the Singapore Malay Eye Study. Ophthalmology. 2008 Nov;115(11):1869–1875. doi: 10.1016/j.ophtha.2008.05.014. [DOI] [PubMed] [Google Scholar]
- 8.Yau J.W.Y., Rogers S.L., Kawasaki R., Lamoureux E.L., Kowalski J.W., Bek T. Global prevalence and major risk factors of diabetic retinopathy. Diabetes Care. 2012 Mar;35(3):556–564. doi: 10.2337/dc11-1909. [DOI] [PMC free article] [PubMed] [Google Scholar]
- 9.Ruta L.M., Magliano D.J., Lemesurier R., Taylor H.R., Zimmet P.Z., Shaw J.E. Prevalence of diabetic retinopathy in Type 2 diabetes in developing and developed countries. Diabet Med J Br Diabet Assoc. 2013 Apr;30(4):387–398. doi: 10.1111/dme.12119. [DOI] [PubMed] [Google Scholar]
- 10.Hu Y., Teng W., Liu L., Chen K., Liu L., Hua R. Prevalence and risk factors of diabetes and diabetic retinopathy in Liaoning province, China: a population-based cross-sectional study. PLoS ONE. 2015;10(3):e0121477. doi: 10.1371/journal.pone.0121477. [DOI] [PMC free article] [PubMed] [Google Scholar]
- 11.Alonso-Morán E., Orueta J.F., Fraile Esteban J.I., Arteagoitia Axpe J.M., Marqués González M.L., Toro Polanco N. The prevalence of diabetes-related complications and multimorbidity in the population with type 2 diabetes mellitus in the Basque Country. BMC Public Health. 2014 Oct;10(14):1059. doi: 10.1186/1471-2458-14-1059. [DOI] [PMC free article] [PubMed] [Google Scholar]
- 12.López I.M., Díez A., Velilla S., Rueda A., Alvarez A., Pastor C.J. Prevalence of diabetic retinopathy and eye care in a rural area of Spain. Ophthalmic Epidemiol. 2002 Jul;9(3):205–214. doi: 10.1076/opep.9.3.205.1516. [DOI] [PubMed] [Google Scholar]
- 13.Pedro R.-A., Ramon S.-A., Marc B.-B., Juan F.-B., Isabel M.-M. Prevalence and relationship between diabetic retinopathy and nephropathy, and its risk factors in the North-East of Spain, a population-based study. Ophthalmic Epidemiol. 2010 Aug;17(4):251–265. doi: 10.3109/09286586.2010.498661. [DOI] [PubMed] [Google Scholar]
- 14.Ministerio de Sanidad, Servicios Sociales e Igualdad. Available from: https://www.msssi.gob.es/; [accessed 2017 Jun 16].
- 15.Man R.E.K., Sasongko M.B., Wang J.J., MacIsaac R., Wong T.Y., Sabanayagam C. The association of estimated glomerular filtration rate with diabetic retinopathy and macular edema. Invest Ophthalmol Vis Sci. 2015 Jul;56(8):4810–4816. doi: 10.1167/iovs.15-16987. [DOI] [PubMed] [Google Scholar]
- 16.Jódar-Gimeno E., Álvarez-Guisasola F., Ávila-Lachica L., Palomares-Ortega R., Roldán-Suárez C., Lizán-Tudela L. Quality of life and fear for hypoglycaemia in patients with type 2 diabetes mellitus. Rev Clin Esp. 2015 Mar;215(2):91–97. doi: 10.1016/j.rce.2014.07.009. [DOI] [PubMed] [Google Scholar]
- 17.Gomis R., Artola S., Conthe P., Vidal J., Casamor R., Font B. Prevalence of type 2 diabetes mellitus in overweight or obese outpatients in Spain. OBEDIA Study. Med Clin (Barc) 2014 Jun 6;142(11):485–492. doi: 10.1016/j.medcli.2013.03.013. [DOI] [PubMed] [Google Scholar]
- 18.Escalada F.J., Ezkurra P., Ferrer J.C., Ortega C., Roldán C., Font B. Análisis sobre los motivos de derivación de pacientes con diabetes mellitus tipo 2 entre atención primaria y atención especializada. Estudio Pathways. Adv Diabetol. 2013;29(3):60–67. [Google Scholar]
- 19.Levey AS, Greene T, Kusek J, Beck G. A simplified equation to predict glomerular filtration rate from serum creatinine. J Am Soc Nephrol 2000; 11: 155A (A0828).
- 20.Harding S., Greenwood R., Aldington S., Gibson J., Owens D., Taylor R. Grading and disease management in national screening for diabetic retinopathy in England and Wales. Diabet Med J Br Diabet Assoc. 2003 Dec;20(12):965–971. doi: 10.1111/j.1464-5491.2003.01077.x. [DOI] [PubMed] [Google Scholar]
- 21.Olson J.A., Strachan F.M., Hipwell J.H., Goatman K.A., McHardy K.C., Forrester J.V. A comparative evaluation of digital imaging, retinal photography and optometrist examination in screening for diabetic retinopathy. Diabet Med J Br Diabet Assoc. 2003 Jul;20(7):528–534. doi: 10.1046/j.1464-5491.2003.00969.x. [DOI] [PubMed] [Google Scholar]
- 22.Rodriguez-Poncelas A., Miravet-Jiménez S., Casellas A., Barrot-De La Puente J.F., Franch-Nadal J., López-Simarro F. Prevalence of diabetic retinopathy in individuals with type 2 diabetes who had recorded diabetic retinopathy from retinal photographs in Catalonia (Spain) Br J Ophthalmol. 2015 Dec;99(12):1628–1633. doi: 10.1136/bjophthalmol-2015-306683. [DOI] [PMC free article] [PubMed] [Google Scholar]
- 23.Jenkins AJ, Joglekar MV, Hardikar AA, Keech AC, O’Neal DN, Januszewski AS. Biomarkers in Diabetic Retinopathy. Rev Diabet Stud RDS. 2015 Spring-Summer;12(1–2):159–95. [DOI] [PMC free article] [PubMed]
- 24.King P., Peacock I., Donnelly R. The UK prospective diabetes study (UKPDS): clinical and therapeutic implications for type 2 diabetes. Br J Clin Pharmacol. 1999 Nov;48(5):643–648. doi: 10.1046/j.1365-2125.1999.00092.x. [DOI] [PMC free article] [PubMed] [Google Scholar]
- 25.Chuang L.-M., Soegondo S., Soewondo P., Young-Seol K., Mohamed M., Dalisay E. Comparisons of the outcomes on control, type of management and complications status in early onset and late onset type 2 diabetes in Asia. Diabetes Res Clin Pract. 2006 Feb;71(2):146–155. doi: 10.1016/j.diabres.2005.05.007. [DOI] [PubMed] [Google Scholar]
- 26.Yoon K.-C., Mun G.-H., Kim S.-D., Kim S.-H., Kim C.Y., Park K.H. Prevalence of eye diseases in South Korea: data from the Korea National Health and Nutrition Examination Survey 2008–2009. Korean J Ophthalmol. 2011 Dec;25(6):421–433. doi: 10.3341/kjo.2011.25.6.421. [DOI] [PMC free article] [PubMed] [Google Scholar]
- 27.Williams G.A., Scott I.U., Haller J.A., Maguire A.M., Marcus D., McDonald H.R. Single-field fundus photography for diabetic retinopathy screening: a report by the American Academy of Ophthalmology. Ophthalmology. 2004 May;111(5):1055–1062. doi: 10.1016/j.ophtha.2004.02.004. [DOI] [PubMed] [Google Scholar]