

Abstract
Objective(s):
The present study was aimed to evaluate the time-mannered and dose-dependent effects of 5α-dihydrotestosterone (5α-DHT) on the proliferation and differentiation of bone forming cells using MC3T3-E1 cells.
Materials and Methods:
Cell proliferation was analyzed using MTS and phase contrast microscopic assays. Osteogenic differentiation was assessed through a series of in vitro experiments including crystal violet staining, alkaline phosphatase (ALP) activity, and Van Gieson (VG) staining. Taken together, the efficiency of bone mineralization was examined by using alizarin red s (ARS) staining, Von Kossa staining, scanning electron microscopy (SEM) and energy dispersive x-ray (EDX) analysis.
Results:
The resulting data revealed that 5α-DHT exhibits promising potential particularly at a dose of 0.1 ng/ml, in promoting the growth of MC3T3-E1 cells compared to the control group (CN). Moreover, a significantly higher ALP activity was evident in the experimental group treated with 5α-DHT compared to the CN group at various time intervals. MC3T3-E1 cells treated with 5α-DHT also expressed a remarkably higher collagen deposition and mineralization (calcium and phosphate contents) compared to the CN group at various time intervals.
Conclusion:
Conclusively, we suggest that 5α-DHT exhibits outstanding potential of promoting proliferation and differentiation in osteoblasts which could be the in vitro basis for the efficacy of 5α-DHT in the treatment of androgen-deficient male osteoporosis.
Keywords: Active bone formation, Differentiation, MC3T3-E1 cells, Morphogenic modulation, Proliferation, 5α-dihydrotestosterone
Introduction
Bone remodeling is a continuous process between bone resorption (activity of osteoclasts) and formation (activity of osteoblasts). Deregulation between these oppositely acting processes may cause bone diseases (1, 2). Bone formation entails a series of intricate events that collectively involve proliferation and differentia-tion of osteoprogenitor cells. Moreover, bone formation requires differentiation and activation of osteoblasts in order to synthesize extracellular matrix (ECM) and regulate mineralization processes (3). Osteogenic differentiation is a highly regulated developmental process that continues during the turnover as well as the bone repair. The chronologic expression of bone matrix proteins (type I collagen and alkaline phosphatase (ALP)) and accumulation of minerals (calcium and phosphate) are the potential biomarkers of osteogenic differentiation (4).
Among several cell culture models developed to analyze the proliferation and differentiation trends of osteoblasts, the pre-osteoblastic cells from mouse calvariae (MC3T3-E1 cells) are well-studied (5, 6). MC3T3-E1 cells develop to all stages of osteoblast differentiation and simulate well to the in vivo osteoblastic population in terms of expression of marked ALP activity and ability to produce ECM within 30 days post-plating (7, 8). Several factors have been known to influence the expression of osteoblast phenotypes into the culture media including the source of cell culture, culturing media, culturing time, and the presence of bioactive compound(s) that influence cell proliferation and differentiation.
Like all metabolically active cells, osteoblasts require endocrine players or hormonal guidance to execute their metabolic activities (9). It is well-established that sex hormones (estrogen, progesterone, and androgen) are among the vital modulators of bone
health particularly in protecting bones from weakness and in regulating the minerals to their optimum levels (10, 11). Of these sex hormones, androgen shows the strongest effects on proliferation and differentiation of osteoblasts (12).
5α-dihydrotestosterone (5α-DHT) (5α- androstan-17β-ol-3-one) is an androgen hormone that is physiologically synthesized from testosterone by the enzymatic action of 5α-reductase in the prostate, testes, hair follicles, and adrenal glands (13). Relative to testosterone, 5α-DHT is a more potent agonist-of androgen receptors (14). In addition, 5α-DHT exhibits excellent affinity for bone tissues and its influence on bone metabolism has been well-established (14). Numerous studies demonstrated that 5α-DHT significantly stimulates osteoblastic proliferation and differentiation and decreases bone resorption, which lead to normalization of bone density (15, 16). Various clinical studies have also confirmed that 5α-DHT exhibits greater efficacy of down-regulating bone resorption and stimulating osteoblastic activity in male osteoporosis (17, 18).
Even though, previous studies have explored the positive effects of 5α-DHT on the osteoblasts proli-feration and differentiation, the time-mannered and dose-dependent modulations of osteoblasts have not been extensively studied. Moreover, a particular stage during the osteoblastic development at which exposure to 5α-DHT causes maximal differentiation has not been investigated yet. Thus, we hypothesized that both the duration of treatment and the stage of cell development could be influenced by the effect of 5α-DHT on osteoblast differentiation. Thus, the aim of the present study was to evaluate the time-mannered and dose-dependent effects of 5α-DHT on the proliferation and osteogenic differentiation of MC3T3-E1 cells. The ability of 5α-DHT to promote osteoblastic proliferation was assessed using MTS assay and phase contrast microscopy. Moreover, the cells differentiation activity of 5α-DHT was evaluated using crystal violet staining, ALP activity, and colla-gen deposition. Taken together, the matrix minerali-zation was analyzed using alizarin red s (ARS) and von Kossa staining. The osteogenic potential of 5α- DHT was harmonized by examining surface morphology using scanning electron microscopic (SEM) and energy dispersive X-ray (EDX) analysis.
Materials and Methods
Materials
The mouse calvariae origin osteoblastic cell line (MC3T3-E1) subclone 14 (CRL-2594, highly differen-tiating) purchased from American Type Culture Collection (ATCC) Cell Bank (Manassas, VA, USA) was used as in vitro model. Cell culture reagents (alpha modified minimal essential medium (α-MEM), penicillin & streptomycin and fetal bovine serum (FBS)) were sourced from Gibco Laboratories (Grand Island, NY, USA). Ascorbic acid, β-glycerophosphate, and MTS (3-(4,5-dimethylthiazol-2-yl)-5-(3-carboxy-methoxyphenyl)-2-(4-sulfophenyl)-2H tetrazolium) dye were purchased from Sigma-Aldrich, USA. ALP activity assay kit was purchased from Abcam (ab83369) (USA). 5α-DHT and crystal violet powder were purchased from Sigma Aldrich, Germany. All other chemicals were sourced from the pharmaco-logy and cell culture laboratories of Universiti Kebangsaan Malaysia (UKM). All reagents and plastic wares used were trace element free and were analyzed for high purity grade.
Cell culture
MC3T3-E1 cells were used as a pre-osteoblastic model that were cultured in a growth medium consisting of α-MEM supplemented with 10% FBS and 1% penicillin/streptomycin (antibiotic/antimycotic). The cells were then incubated in a humidified atmos-phere (95% air and 5% CO2) at 37 °C until they reached 80% confluence. The adherent cells were then enzy-matically released from the flask by treating with an aqueous solution of 0.2% trypsin and 0.02% EDTA (ethylenediamine tetraacetic acid) for 2 to 4 min. The cells were counted using a hemocytometer and seeded at a density of 1×10³ cells/cm2 in a 96-well culture plate and were then re-cultured under the same experimental conditions. For experiments, cells were cultured for 24 hr to obtain monolayers containing α-MEM with 10% FBS to promote cell survival, division, and metabolism. Prior to initiating osteogenic differen-tiation, cells were sparsely seeded in 96-well culture plates and cultured overnight in an incubator. After-ward, cells were induced with osteogenic differen-tiation medium (which contains alpha-MEM with 50 µg/l ascorbate analog to resists hydrolysis (ascorbate-2-phosphate) and permits collagen type I fibril assem-bly and 10 mM β-glycerophosphate to promote mine-ralization of collagen fibrils) for a complete osteogenic differentia-tion. Notably, cultured cells were fed with osteogenic differentiation media twice weekly over a 2 to 3 week period.
Cell proliferation
Cell proliferative ability of different concen-trations (0.001, 0.01 and 0.1 ng/ml) of 5α-DHT was analyzed at various time points (days 1, 3, and 6) using colorimetric [3-(4,5-dimethylthiazol- 2-yl)-5-(3-caroxymethoxyphenyl)-2-(4-sulfophenyl)-2H-tetrazolium] (MTS) assay. Briefly, MC3T3-E1 cells were seeded at a density of 1×10³ cells/well in 96-well plates with six duplicate wells per treatment and maintained in growth media under 5% CO2 at 37 °C for 24 hr. After 24 hr incubation, the media was replaced with fresh growth media containing 5α-DHT at different concentrations (0.001, 0.01 and 0.1 ng/ml) for 1, 3, and 6 days. The normal growth medium (not inclusive of 5α-DHT) was used as control (CN). At the end of each time interval, 20 μl of a pre-diluted MTS solution was introduced to each well and the cells were incubated at 37 °C in the dark for 2 hr. The absorbance of each well was then recorded at 490 nm using a microplate reader.
Phase contrast microscopy
Another set of experiments was performed at various time points (1, 3, and 6 days) to examine the cell growth rate and morphology of MC3T3-E1 after treating with different concentrations of 5α-DHT (0.001, 0.01, and 0.1 ng/ml) using trinocular inverted phase contrast microscopy (Leica, Tokyo). The resulting photomicrographs of experimental cells were compared with the untreated (CN) cells.
Crystal violet staining
To examine the effect of 5α-DHT on cell growth rate during the differentiation phase of MC3T3-E1 cells, crystal violet staining assay was performed (19). Briefly, MC3T3-E1 cells were seeded into the 96-well cell culture plates with successive induction with differentiation media after being treated with different concentrations (0.001, 0.01, and 0.1 ng/ml) of 5α-DHT at various time intervals (3, 6, 9, 15, and 21 days). At each predetermined time point, cells were rinsed with phosphate-buffered saline (PBS) and were then stained with 0.5% crystal violet solution (prepared in 10% ethanol) for 10 min. The excess stain was then removed by washing with PBS, thrice. The stained cells were observed and photographed under trinocular inverted phase contrast microscopy.
Besides qualitative analysis, a quantitative approach was also used to evaluate the effect of different concentrations of 5α-DHT on the growth rate of MC3T3-E1 cells. Briefly, the crystal violet stain that had stained experimental cells in the previous experiment was dissolved in 200 µl of 10% acetic acid and the absorbance of the resulting solution was recorded at 590 nm using a spectrophotometer (19). The comparative ability of different concentrations of 5α-DHT to promote growth rate of MC3T3-E1 cells was then assessed compared with the CN group.
ALP activity
This experiment was performed to evaluate the ability of 5α-DHT to express the secretion of ALP (an early differentiation marker) from MC3T3-E1 cells at different time intervals (3, 6, 9, 15, and 21 days) using the ALP colorimetric assay kit. The assay was performed according to the manufacturer’s instructions. Briefly, 1 × 10⁵ cells were collected from each treatment group and homogenized with assay buffer. The homogenized cellular lysate was then centrifuged at 13,000 g for 3 min to remove insoluble cellular debris. Afterward, 80 μl of supernatant was collected from each sample and added into the pre-labeled 96-well plate with subsequent addition of 50 μl of 5 mM pNPP solution into each well. The 96-well plates were then incubated at 25 °C in the dark for 60 min followed by the addition of 20 μl of stop solution into each well, except to the background control wells. The optical density value was then measured at 405 nm using a microplate reader.
Determination of collagen content using VG staining
The ability of 5α-DHT to differentiate MC3T3-E1 cells at different concentrations was also assessed at various time intervals (3, 6, 9, 15, and 21 days) through evaluating the synthesis and subsequent deposition of collagen. In this experiment, the osteoblastic cells were stained with Van Gieson’s (VG) stain by following a previously developed method (8), with slight modification. Accordingly, the cells seeded in the 96-well culture plate and treated with different concentrations of 5α-DHT were washed with PBS thrice and were then fixed with 2% formaldehyde at 4 °C for 15 min. The treated and washed cells were then incubated with VG stain for 5 min at room temperature and were rinsed with deionized water twice. Afterward, the stained cells were observed and photographed under inverted phase contrast microscope equipped with a digital camera (Leica, Tokyo).
Evaluation of ECM mineralization
Calcium contents using ARS staining
Effect of 5α-DHT on ECM mineralization of MC3T3-E1 cells was also evaluated at different time intervals (3, 6, 9, 15, and 21 days) by using the ARS dye and the results were compared with the CN group. This assay was performed by following a previously developed method (20). Briefly, 1 × 10⁵ cells/well were seeded into a 24-wells culture plate and induced with osteoblast differentiation media. The cells were treated with different concen-trations (0.001, 0.01, and 0.1 ng/ml) of 5α-DHT for various time intervals (3, 6, 9, 15, and 21 days) and the media was replaced with equal volumes of a fresh media on every alternate day. At each predetermined time point, the media was removed and the cells were washed with PBS thrice followed by their fixation with 4.0% paraformaldehyde at 4 °C for 20 min and subsequent rinsing with deionized water. The fixed cells were then stained with 40 mM ARS solution (pH, 4.4) at room temperature for 30 min followed by rinsing with deionized water thrice. Finally, the stained cells were imaged for calcified nodules formation (acquiring bright red color) under inverted phase contrast microscopy equipped with a digital camera. The calcium deposition was also assessed quantitatively by using the Image J software.
Assessment of phosphate deposition using Von Kossa staining
To further evaluate the efficacy of 5α-DHT to differentiate osteoblasts and to promote expression and deposition of phosphate minerals, Von Kossa staining was performed. The staining protocol was begun after the cells (untreated or treated MC3T3-E1 cells) were fixed with 10% neutral buffered formalin for 15 min at room temperature. The fixed cells were then washed with deionized water thrice and were then incubated with 5% silver nitrate solution under ultraviolet light at room temperature for 1 hr. At the end of the incubation period, any residual silver nitrate solution was washed away by rinsing the culture dish with distilled water thrice and the cells were neutralized with 5% sodium thiosulfate for 10 min. The cells were then air-dried and imaged under a phase contrast microscope equipped with digital camera (21).
Cell morphology using SEM and EDX analyses
To examine the morphological changes that occurred in 5α-DHT treated MC3T3-E1 cells as well as the forma-tion of mineralized bone matrices, the treated cells were also examined using SEM (JEOL JSM 6300, operated at 10 keV) and EDX (JEOL JSM 6300, operated at 10 keV) at various time intervals.
Prior to performing SEM analysis, the preopera-tive procedure entails the fixation of cultured cells with 2.5% glutaraldehyde (prepared in PBS) at 4% for 30 min. Following the fixation, the cultured cells were washed with 0.1M cacodylate buffer and dehydrated in graded ethanol series. Prior to under-going image analysis, each sample was sputter coated with carbon to eliminate any charging effects and the mineralized crystals were then examined under SEM (JEOL JSM 6300, operated at 10 keV). SEM photomicrographs were taken to image the morphology of untreated and treated MC3T3-E1 cells at different time intervals (3, 6, 9, 15, and 21 days) using resolution and magnification of 2000×.
Moreover, the chemical composition of minera-lized bone matrices which was observed in SEM photomicrographs of CN and treated MC3T3-E1 was further characterized using EDX microanalysis (JEOL JSM 6300, operated at 10 keV). The results were expressed in the form of qualitative spectra showing the relative intensity of each mineral (calcium and phosphate) expressed by the analyzed mineralized nodule.
Statistical analysis
All experiments were performed three times independently with quadruplicate sampling (n=4) and the resulting data were expressed as mean± standard deviation (S.D.) One-way analysis of vari ance (one-way ANOVA) was performed using SPSS ver-sion 21.0. Statistical significance between tested groups was identified as *P<0.05.
Results
The present study aimed to evaluate the ability of 5α-DHT to promote proliferation (increase in cell number and cell growth) and osteogenic differentiation (ECM formation, ALP activity, collagen synthesis, and mineralization) in MC3T3-E1 cells at different concentrations and time points. The resulting data promisingly revealed that 5α-DHT exhibits greater potential to promote both cell proliferation and osteogenic differentiation compared to the untreated MC3T3-E1 cells (CN group).
5α-DHT promotes osteoblasts proliferation
Prior to evaluating the proliferative and differen-tiation effects, the optimum dosage of 5α-DHT was determined by using MTS assay and the results are presented in Figure 1. Results showed that the numbers of MC3T3-E1 cells were increased in all experimental (i.e. untreated and treated) groups with time. No significant difference in the prolifera-tion of MC3T3-E1 cells was observed between 5α-DHT treated cells and the CN group after an exposure of 24 hr. The rate of proliferation in 5α-DHT treated cells (particularly at 0.01 to 0.1 ng/ml concentration) was increased significantly when the duration of treatment was increased from 3 to 6 days (P<0.05, one way ANOVA) compared to the CN group. The rate of cell proliferation was gradually decreased when the concentration of 5α-DHT was further reduced (<0.01 ng/ml). The cytotoxic effects of 5α-DHT were observed at higher doses (≥0.1 ng/ml). Based on the results, we selected three best concen-trations of 5α-DHT (0.001, 0.01 and 0.1 ng/ml) for further assessments.
Figure 1.

Cell proliferation of MC3T3-E1 treated with different concentrations of 5α-dihydrotestosterone (104–10-4 ng/mL) compared to the untreated cells. The results were obtained from three independent experiments in quadruplicates (n=4) and were expressed as mean ± standard deviation. *indicates a significant difference between the treated and control groups (P<0.05, one way ANOVA)
Before evaluating the effects of MC3T3-E1 cells on osteogenic differentiation, MTS assay was carried out to appraise the safety and toxicity profiles of 5α-DHT. Interestingly, the results demonstrated a good safety profile of 5α-DHT particularly at low concentration (≤0.1 ng/ml).
Cell proliferation using phase contrast microscopy
The cell proliferative effects of different concen-trations of 5α-DHT and their morphological features were also observed at various time points using phase contrast microscope (Figure 2). The resulting photo-micrographs clearly indicated typical spindle shaped morphology of MC3T3-E1 cells with fibroblastic appearance. The cells were uniformly thin with smoothly extended cytoplasm throughout the observation period. Generally, a consistent increase in the numbers of MC3T3-E1 cells was observed in both CN as well as 5α-DHT-treated cells from days 1 to 6. The rate of proliferation was relatively higher in 5α-DHT-treated cells compared to the untreated cells (CN group). Additionally, 5α-DHT-treated cells also showed a gra-dual increase in the density of cells from days 1 to 6 and exhibited denser and well-defined cell membrane. The highest proliferation and density was observed in MC3T3-E1 cells treated with 0.1 ng/ml (Figure 2).
Figure 2.
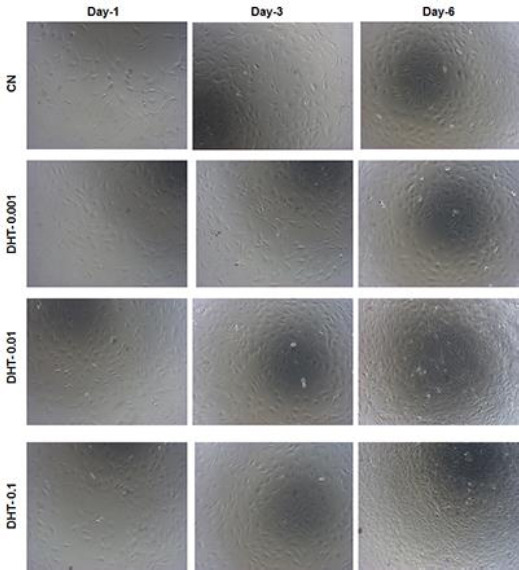
Morphological features of 5α-dihydrotestosterone treated MC3T3-E1 cells at various time points (days 1, 3, and 6) compared to the untreated cells using phase contrast microscopy (original magnification, ×10)
5α-DHT promotes cells growth
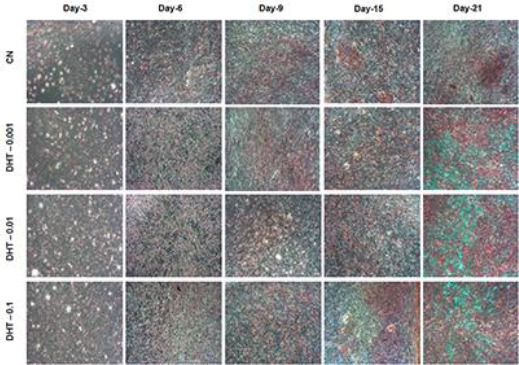
Prior to assessing phenotypic differentiation of MC3T3-E1 cells, the differentiation in terms of proliferation was evaluated using crystal violet staining. This staining was used to examine the effects of 5α-DHT on cellular growth during the differentiation stages (Figures 3 and 4). Figure 3 shows that MC3T3-E1 cells in cultures (treated and untreated) gradually increased in growth from day 3 to 21; however, the increase in cell growth was more obvious in 5α-DHT-treated cells (predominantly in DHT–0.01 and DHT–0.1 groups).
Figure 3.

Time-mannered and dose-dependent increase in the cell growth was observed in 5α-dihydrotestosterone treated MC3T3-E1 cells at various time points (days 3, 6, 9, 15, and 21) compared to the control groups, using crystal violet staining. The increase in cell growth was more pronounced in cells treated with 0.1 ng/mL of 5α-dihydrotestosterone compared to other tested groups. The photomicrographs were imaged under phase contrast microscopy (original magnification, ×10). The cells acquired deep purple color with staining
Figure 4.

Cell growth of MC3T3-E1 cells treated with various concentrations of 5α-dihydrotestosterone at various time points (days 3, 6, 9, 15, and 21) compared to the untreated control cells using crystal violet staining. Data are expressed as means ± standard deviation (n=12). Absorbance was measured at 540 nm using microplate reader. *P<0.05 indicates a significant difference between 5α-DHT-treated and CN groups
Furthermore, the quantitative analysis also revea-led a dose-dependent increase in the growth rate of MC3T3-E1 cells in 5α-DHT-treated cells (Figure 4). The rate of cell growth was increased in a time-dependent manner in both CN and 5α-DHT-treated cells from day 3 to 9. The rate of cell growth was pronounced in 5α-DHT-treated cells compared with CN cells when the concentration was increased from 0.001 to 0.1 ng/ml from day 3 onwards. However, after day 9, the rate of cell growth declined but there were still significant differences between CN and 5α-DHT-treated cells.
ALP activity
The ability of 5α-DHT to promote osteoblastic differentiation was assessed by measuring ALP activity in 5α-DH-treated MC3T3-E1 cells at various time intervals (day 3 to 21) and the results were compared with the CN group (Figure 5). Results demonstrated that ALP activity was increased in all experimental (untreated and treated) groups in a time-dependent manner from day 3 to 15; however, ALP activity significantly declined on day 21 in all tested groups. Comparative analysis revealed that increase in ALP activity was more pronounced in 5α-DH-treated MC3T3-E1 cells (predominantly DHT-0.01 and DHT-0.1 groups) compared to the CN group (P<0.05, one way ANOVA).
Figure 5.

Time-mannered and dose-dependent increase in alkaline phosphatase activity was observed in MC3T3-E1 cells treated with 5α-dihydrotestosterone and control groups. Data are extracted from three independent experiments in quadruplicate (n=4) and is expressed as means ± standard deviation. *indicates significant difference (P<0.05, one way ANOVA) between treated and untreated groups
Estimation of collagen
In this experiment, a time-mannered and dose-dependent synthesis and deposition of collagen were observed in both 5α-DHT treated cells and the CN group from day 3 to 21 (Figure 6). Results demonstrated that collagen deposition was not clearly identified on day 3 in any experimental groups (treated and untreated). The collagen deposition started to appear (acquiring light red color with VG stain) on day 6 in both CN and 5α-DHT-treated groups. The intensity of collagen deposition progressively increased in a time-dependent manner (from day 9 to 21) in all tested groups; however, higher integers of collagen were observed in 5α-DHT-treated groups compared to the CN group (Figure 6). Further analysis of histological monographs revealed that 5α-DHT increases collagen contents in MC3T3-E1 cells in a dose-dependent manner and highest integers of cellular and matrix collagen were observed in MC3T3-E1 cells treated with 0.1 ng/mL of 5α-DHT compared to cells treated with 0.001 and 0.01 ng/mL (Figure 6).
Figure 6.
Time-mannered and dose-dependent increase in collagen deposition in both treated and untreated groups. Highest collagen deposition was observed in cells treated with 0.1 ng/ml of 5α-dihydrotestosterone compared to the untreated and other 5α-dihydrotestosterone treated groups at various time points. The photomicrographs were taken from four different regions of treated stained cells
Assessment of mineralization
Estimation of calcium content using ARS staining
To evaluate the efficacy of 5α-DHT to promote mineralization (calcium deposition) in MC3T3-E1 cells, a qualitative analysis using ARS dye was performed. The resulting photomicrographs of the CN (untreated) group showed relatively lower intensity of nodule formation (indicating the magnitude the calcium deposition) which started to appear on day 9 (Figure 7). The intensity was subsequently increased from day 9 onwards and the highest ECM mineralization was achieved on day 21. The photomicrographs of 5α-DHT-treated cells also expressed calcified nodule formation in a time- as well as concentration-dependent manner during days 9 to 21; however, the intensity of calcified nodule formation was more obvious on day 21 compared to the CN group (Figure 7). A comparative analysis evident that magnitude of calcium deposition was remarkably high in MC3T3-E1 cells treated with 0.1 ng/ml of 5α-DHT compared to the cells treated with 0.001 and 0.01 ng/ml and CN cells (Figure 7).
Figure 7.

Effect of 5α-DHT on calcium deposition in MC3T3-E1 cells. Significantly higher calcium deposition was observed in cells treated with 0.1 ng/ml of 5α-dihydrotestosterone compared to other concentrations and control groups. The calcium deposition in extracellular matrix was analyzed using ARS staining. MC3T3-E1 cells were induced with an osteogenic medium at different time intervals (days 3, 6, 9, 15, and 21)
To harmonize calcium deposition trend (presented in Figure 7), we have also performed a quantitative analysis of ARS staining using the Image J software. Results are presented in the form of the mean stained area (µm2) of each photomicrograph obtained in ARS staining (Figure 8). The resulting data depict that a progressive time-mannered increase in the staining area was observed in all experimental (untreated and treated) groups and the highest staining areas were observed on days 15 and 21. Comparative analysis between the tested groups indicated that the extent of mineralization was markedly high in 5α-DHT-treated groups (predominantly DHT–0.1) which mean that 5α-DHT-0.1 enhanced ECM mineralization significantly at 0.1 ng/ml on day 21 compared to other treatment and CN groups (Figure 8).
Figure 8.
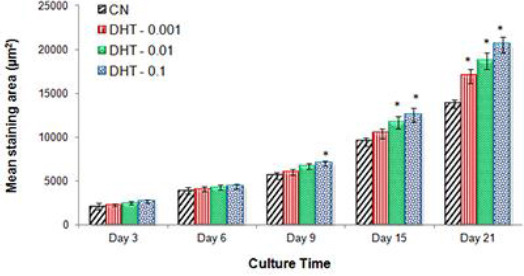
Quantitative measurement of mineralized staining area (µm2). Mean staining area is calculated using the Image J software to represent mineralized nodule formation in MC3T3-E1 cells treated with three different concentrations of 5α-dihydrotestos-terone (0.001, 0.01, and 0.1 ng/ml) compared to untreated control group at various time points. Data are expressed as mean ± standard deviation (n=12). * indicates significant difference (P<0.05) between treated and CN groups
To examine the efficacy of 5α-DHT to promote phosphate deposition, von Kossa staining was perfor-med. The intensity of characteristic dark brown color indicates the extent of phosphate deposits which play a prime role in bone osteogenesis. The resulting photo- micrographs of all experimental groups indicated that the characteristic brown spots (indicative of phosphate deposits) started to appear on day 6; however, relatively higher integers of phosphate deposition were observed in 5α-DHT-treated groups compared to the CN group (Figure 9). The CN group showed a lower magnitude of phosphate deposits throughout the culture period (days 3, 6, 9, 15, and 21) compared to those of 5α-DHT treated cells. It was also observed that the magnitude of dark brown color in 5α-DHT treated
Figure 9.

Effects of 5α-dihydrotestosterone on the deposition of phosphate minerals in MC3T3-E1 cells. The resulting photo-micrographs revealed higher phosphate deposition in cells treated with 0.1 mg/mL of 5α-dihydrotestosterone compared to the control or other treatment groups 5α-DHT promotes phosphate deposition
The CN group showed a lower magnitude of phosphate deposits throughout the culture period (days 3, 6, 9, 15, and 21) compared to those of 5α-DHT treated cells. It was also observed that the magnitude of dark brown color in 5α-DHT treated cultures was gradually increased from day 9 onward and the highest intensity was achieved on day 21, which indicated a premier deposition of phosphate in the mineralized ECM matrix of MC3T3-E1 cells. Among the treated groups, the intensity of dark brown spots observed at day 21 was noticeably high in cells treated with 0.1 mg/ml of 5α-DHT compared to other groups (Figure 9). The pattern of mineralization was in line with ARS staining (dark red color for calcified nodule).
SEM analysis
Mineral deposition in differentiated cells was also studied microscopically using SEM analysis (Figure 10). Results demonstrated that after 9 days of culture, both CN and 5α-DHT-treated MC3T3-E1 cells were widely spread and had formed extensive cell sheets with typical flattened morphology. A highly structured cell membrane indicated a good metabolic activity of cell cultures. The untreated and treated cells exhibited star-like (numerous cytoplasmic extensions) morphology which indicates good growth of MC3T3-E1 cells after 9 days of culture. Further observation of surface characteristics showed numerous globular masses of mineral deposits (identified as white color crystals) in the ECM of cultured cells (Figure 10). In many regions of SEM monographs, small globular foci appeared as coalesced masses that represented large deposits of minerals. In both CN and 5α-DHT-treated groups, the presence of mineral deposits was evident on day 9 and increased gradually over time (time-dependent) with maximum mineralization observed on day 21. Interestingly, when compared with the CN group, the intensity of mineral deposition was remarkably high in the 5α-DHT-treated groups; particularly in the 5α-DHT-0.1 group (Figure 10).
Figure 10.

Scanning electron microscopic images of MC3T3-E1 cells induced with an osteogenic medium after treatment with different concentrations (0.001, 0.01, and 0.1 ng/ml) of 5α-dihydrotestosterone compared to the control groups at different time intervals (days 9, 15, and 21)
EDX microanalysis
The chemical composition of globular masses observed in the ECM (as shown in Figure 10) was also analyzed using EDX microanalysis (Figure 11). EDX spectra demonstrated that the white globular masses that were observed during the cell differentiation phase were primarily composed of calcium (Ca) and phosphate (P) minerals in all experimental groups (Figure 11).
Figure 11.

Energy dispersive X-ray spectra of MC3T3-E1 cells treated with different concentrations (0.001, 0.01, and 0.1 ng/ml) of 5α-dihydrotestosterone compared to the control groups at day 21. Results showed higher mineralization in the cells treated with 0.1 ng/ml of 5α-dihydrotestosterone compared to the control and other treatment groups
EDX microanalysis of the untreated MC3T3-E1 cells showed a well-defined characteristic peak of calcium and a relatively small peak of phosphorus (Figure 11). Nodules of similar composition were also observed in cell cultures treated with 5α-DHT; however, a higher intensity of mineralization (calcium and phosphate deposition) was observed in these cells compared to the CN group (Figure 11). Further analysis of EDX spectra obtained from 5α-DHT-treated cells revealed a dose-dependent effect with a noticeably high amount of calcium and phosphate depositions in MC3T3-E1 cells treated with 0.1 ng/ml compared to the other groups (Figure 11).
Discussion
Osteoporosis is a metabolic disorder charac-terized by a decrease in the density of bones, decreasing their strength and resulting in fragility. Osteoporosis literally leads to abnormally porous bones that are compressible, like a sponge. This disorder of the skeleton weakens the bone and results in frequent fractures (breaks) in the bones.
The major pharmacological modalities currently being used for the treatment of osteoporosis include primarily estrogen replacement therapy (ERT) and testosterone replacement therapy (TRT) along with bisphosphonates, selective estrogen receptor modula-tors, and calcitonin. Several studies demonstrated that testosterone regulates bone density by promo-ting bone formation via upregulation of androgen receptors (22, 23). However, relative to testosterone, 5α-DHT is a more potent agonist of androgen recep-tors and exhibits excellent affinity for bone tissues and influences bone metabolism (14). Numerous studies demonstrated that 5α-DHT significantly stimu-lates osteoblastic proliferation and differentiation and decreases bone resorption, which lead to norma-lization of bone density (15-17).
Bone remodeling is tightly regulated by two processes: bone formation and bone resorption. The balance between these two opposite functioning processes is the main key to maintaining bone density and bone health. In the present study, we have conducted numerous experiments to explore the efficacy of 5α-DHT in promoting osteoblast proliferation, differentiation, and mineralization by using MC3T3-E1 cells as in vitro osteoblastic model.
Prior to evaluating the therapeutic efficacy of a tested compound, it is critically important to test its safety and toxicity profile. Hence, to investigate the safe dose regimen for 5α-DHT, we have conducted MTS assay and observed that 5α-DHT showed a good safety profile particularly at low concentrations (≤0.1 ng/ml). At higher doses (>0.1 ng/ml), 5α-DHT causes slight toxicity to MC3T3-E1 cells. These results were also confirmed through evaluating the effect of 5α-DHT on MC3T3-E1 cell proliferation. We observed that a relatively low rate of proliferation was observed in MC3T3-E1 cells when exposed to low concentrations of 5α-DHT (<0.01 ng/ml); however, the rate of proliferation was significantly increased when the concentrations of 5α-DHT were increased (>0.01 ng/ml). Further increase in the concentration (>0.1 ng/ml) of 5α-DHT arrested cell proliferation and adversely affected cellular growth and thus is not appropriate for prolonged cell culture. Our results are in line with a previous study which had evidenced that androgens, either alone or in combination with other hormones, promote cells growth at low concentrations both in vitro and in vivo (24). The increased cell proliferation, cell density, and confluence in 5α-DHT treated MC3T3-E1 cells was expected to be due to its androgenic nature to promote bone cell proliferation (25).
In vitro cell osteogenic or differentiation potential of 5α-DHT was assessed by evaluating various phenotypic features of osteoblastic cells including ALP activity, collagen synthesis, and mineralization (calcium and phosphate deposition) of MC3T3-E1 cells (26). Prior to assessment of phenotype differen-tiation, cell differentiation in terms of proliferation was evaluated using crystal violet staining. We observed that 5α-DHT promoted cell growth even during differen-tiation phase. These findings were in line with a previous study (27), which demonstrated that 5α-DHT accelerates the growth rate of MC3T3-E1 cells in a time- and dose-dependent manner during the differentiation phases. They further demonstrated that increased cell growth during differentiation was due to signaling through androgen receptors (AR) and PI3-kinase/AKT pathway (27, 28). Androgen action in osteoblasts occurs through multiple pathways. Among them, PI3K/AKT pathway and its mechanism are increasingly appreciated in that it plays important role in the bone cell formation of androgen actions, and manipulation of these pathways could therapeutically modulate the metabolism of androgens in the bone microenviron-ment (27, 28).
ALP is one of the key players which exhibit a prime role in promoting osteogenesis, ECM mineralization and bone tissue formation (29). The physiologic expression of ALP is essential to induce and promote mineralization in MC3T3-E1 cells after the formation of a confluent monolayer (30, 31). Therefore, in this study, we evaluated the effect of 5α-DHT on the expression of ALP. A time-mannered and dose-dependent ALP activity was observed in MC3T3-E1 cells treated with 5α-DHT. These marked ALP levels observed in 5α-DHT-treated MC3T3-E1 cells were expected to be associated with the enhanced production of collagen in cells during early stages of differentiation and intra-cytoplasmic calcification induced by 5α-DHT (32). The characteristic trend of ALP activity observed in this study suggests that ALP activity is directly correlated with cell differentiation because ALP activity became pronounced after the cells formed a confluent monolayer in both CN and 5α-DHT treated cells (33). Osteoblasts secrete ALP and thereafter reached calcification stage (minera-lization) which means MC3T3-E1 cells changed their status from the proliferation stage to ECM matura-tion and mineralization (33). These findings were also in line with other studies which demonstrated that ALP activity is directly correlated with osteo-blastic differentiation and maturation (34-36).
Collagen synthesis is also a critically important biomarker of osteoblastic differentiation (37).
Therefore, we have also evaluated the effects of 5α-DHT on collagen deposition in MC3T3-E1 cells. Treatment of MC3T3-E1 cells with 5α-DHT markedly enhanced collagen density as evident by dark red clusters of collagen (predominantly type I) integers that were evenly distributed throughout the stimu-lated cellular region. The higher magnitude of collagen deposition observed in 5α-DHT-treated cells demonstrated the ability of 5α-DHT to stimulate maturation and differentiation of osteoblasts and bone matrix formation. These results were consis-tent with previous studies which reported that collagen is predominantly expressed in bone cells during osteoblastic differentiation (38, 39).
Mineralization of bone plays a critical role in improving the hardness and strength of bone tissues. It involves a well-orchestrated process in which crystals of calcium and phosphates are produced by bone-forming cells and laid down in precise amounts within the bone’s fibrous matrix or scaffolding. If this process is not regulated properly, the result can be too little of the mineral or too much which could result in weaker or brittle bones (40). Therefore, we have also evaluated the effects of 5α-DHT on bone matrix mineralization (calcium and phosphate deposition). We observed a time-mannered increase in the deposition of calcium and phosphate crystals in the bone matrices of MC3T3-E1 cells treated with 5α-DHT from days 9 to 21. These results were also in agreement with previous studies which reported that active mineral deposition occurs from day 9 onwards (40, 41). Moreover, a dose-dependent increase in ECM mineralization revealed that the exposure of MC3T3-E1 cells to different doses of 5α-DHT might cause variable development and maturation of osteoblastic cells, which means dose of 5α-DHT significantly influences the differentiation and mineralization of MC3T3-E1 cells.
Conclusion
Our findings demonstrated that 5α-DHT exhibits promising potential of promoting proliferation, differentiation, and mineralization in MC3T3-E1 cells. The efficiency of 5α-DHT to stimulate proliferation and differentiation in MC3T3-E1 cells was more obvious at 0.1 ng/ml. The positive effect of 5α-DHT on osteoblastic differentiation and maturation was evidenced by the enhanced expression of ALP activity and the up-regulated collagen deposition. The pharmacological efficacy of 5α-DHT in promo-ting mineral deposition was confirmed by SEM and EDX microanalyses, which evidence that the minerals foci (large mineral masses) appearing in 5α-DHT trea-ted cells were composed of calcium and phosphate crystals. Based on our findings, we anticipate that 5α-DHT exhibits significant potential for promoting bone formation and maintaining homeostasis in bone tissue formation.
Acknowledgment
Authors would like to acknowledge the Ministry of Agriculture, Malaysia for providing New Application for Herbal Research Grant Scheme (NRGS) (NH1014D040). The results presented in this paper were part of a student thesis.
Conflict of Interest
The authors declare that no conflict of interest exists.
References
- 1.Goto T, Hagiwara K, Shirai N, Yoshida K, Hagiwara H. Apigenin inhibits osteoblastogenesis and osteoclasto-genesis and prevents bone loss in ovariectomized mice. Cytotechnology. 2015;67:357–365. doi: 10.1007/s10616-014-9694-3. [DOI] [PMC free article] [PubMed] [Google Scholar]
- 2.Dennison E, Mohamed MA, Cooper C. Epidemiology of osteoporosis. Rheum Dis Clin North Am. 2006;32:617–629. doi: 10.1016/j.rdc.2006.08.003. [DOI] [PubMed] [Google Scholar]
- 3.Beloti MM, Rosa AL. Osteoblast differentiation of human bone marrow cells under continuous and discontinuous treatment with dexamethasone. Braz Dent J. 2005;16:156–161. doi: 10.1590/s0103-64402005000200013. [DOI] [PubMed] [Google Scholar]
- 4.Lian JB, Javed A, Zaidi SK, Lengner C, Montecino M, van Wijnen AJ, et al. Regulatory controls for osteoblast growth and differentiation:role of Runx/Cbfa/AML factors. Crit Rev Eukaryot Gene Expr. 2004;14:1–41. [PubMed] [Google Scholar]
- 5.Yan XZ, Yang W, Yang F, Kersten-Niessen M, Jansen JA, Both SK. Effects of continuous passaging on mineralization of MC3T3-E1 cells with improved osteogenic culture protocol. Tissue Eng Part C Methods. 2014;20:198–204. doi: 10.1089/ten.tec.2012.0412. [DOI] [PubMed] [Google Scholar]
- 6.Yazid MD, Ariffin SH, Senafi S, Razak MA, Wahab RM. Determination of the differentiation capacities of murines’primary mononucleated cells and MC3T3-E1 cells. Cancer Cell Int. 2010;10:42. doi: 10.1186/1475-2867-10-42. [DOI] [PMC free article] [PubMed] [Google Scholar]
- 7.Wang J, de Boer J, de Groot K. Proliferation and differentiation of MC3T3-E1 cells on calcium phosphate/chitosan coatings. J Dent Res. 2008;87:650–654. doi: 10.1177/154405910808700713. [DOI] [PubMed] [Google Scholar]
- 8.Seo HJ, Cho YE, Kim T, Shin HI, Kwun IS. Zinc may increase bone formation through stimulating cell proliferation, alkaline phosphatase activity and collagen synthesis in osteoblastic MC3T3-E1 cells. Nutr Res Pract. 2010;4:356–361. doi: 10.4162/nrp.2010.4.5.356. [DOI] [PMC free article] [PubMed] [Google Scholar]
- 9.Leder BZ, LeBlanc KM, Schoenfeld DA, Eastell R, Finkelstein JS. Differential effects of androgens and estrogens on bone turnover in normal men. J Clin Endocrinol Metab. 2003;88:204–210. doi: 10.1210/jc.2002-021036. [DOI] [PubMed] [Google Scholar]
- 10.Lips P. Vitamin D physiology. Prog Biophys Mol Biol. 2006;92:4–8. doi: 10.1016/j.pbiomolbio.2006.02.016. [DOI] [PubMed] [Google Scholar]
- 11.Clarke BL, Khosla S. New selective estrogen and androgen receptor modulators. Curr Opin Rheumatol. 2009;21:374–379. doi: 10.1097/BOR.0b013e32832ca447. [DOI] [PMC free article] [PubMed] [Google Scholar]
- 12.Saadiah Abdul Razak H, Shuid AN, Naina Mohamed I. Combined effects of Eurycoma longifolia and testosterone on androgen-deficient osteoporosis in a male rat model. Evid Based Complement Alternat Med. 2012;2012:872406. doi: 10.1155/2012/872406. [DOI] [PMC free article] [PubMed] [Google Scholar]
- 13.Huang CK, Lai KP, Luo J, Tsai MY, Kang HY, Chen Y, et al. Loss of androgen receptor promotes adipogenesis but suppresses osteogenesis in bone marrow stromal cells. Stem Cell Res. 2013;11:938–950. doi: 10.1016/j.scr.2013.06.001. [DOI] [PMC free article] [PubMed] [Google Scholar]
- 14.Cilotti A, Falchetti A. Male osteoporosis and androgenic therapy:from testosterone to SARMs. Clin Cases Miner Bone Metab. 2009;6:229–233. [PMC free article] [PubMed] [Google Scholar]
- 15.Lin IC, Slemp AE, Hwang C, Sena-Esteves M, Nah HD, Kirschner RE. Dihydrotestosterone stimulates proliferation and differentiation of fetal calvarial osteoblasts and dural cells and induces cranial suture fusion. Plast Reconstr Surg. 2007;120:1137–1147. doi: 10.1097/01.prs.0000279527.99734.bf. [DOI] [PubMed] [Google Scholar]
- 16.Clarke BL, Khosla S. Androgens and bone. Steroids. 2009;74:296–305. doi: 10.1016/j.steroids.2008.10.003. [DOI] [PMC free article] [PubMed] [Google Scholar]
- 17.Sinnesael M, Boonen S, Claessens F, Gielen E, Vanderschueren D. Testosterone and the male skeleton:a dual mode of action. J Osteoporos. 2011;2011:240328. doi: 10.4061/2011/240328. [DOI] [PMC free article] [PubMed] [Google Scholar]
- 18.Yarrow JF, Wronski TJ, Borst SE. Testosterone and adult male bone:actions independent of 5α-reductase and aromatase. Exerc Sport Sci Rev. 2015;43:222–230. doi: 10.1249/JES.0000000000000056. [DOI] [PMC free article] [PubMed] [Google Scholar]
- 19.Ho MH, Liao MH, Lin YL, Lai CH, Lin PI, Chen RM. Improving effects of chitosan nanofiber scaffolds on osteoblast proliferation and maturation. Int J Nanomedicine. 2014;9:4293–4304. doi: 10.2147/IJN.S68012. [DOI] [PMC free article] [PubMed] [Google Scholar]
- 20.Yamakawa K, Iwasaki H, Masuda I, Ohjimi Y, Honda I, Saeki K, et al. The utility of alizarin red s staining in calcium pyrophosphate dehydrate crystal deposition disease. J Rheumatol. 2003;30:1032–1035. [PubMed] [Google Scholar]
- 21.Liu J, Lee J, Salazar Hernandez MA, Mazitschek R, Ozcan U. Treatment of obesity with celastrol. Cell. 2015;161:999–1011. doi: 10.1016/j.cell.2015.05.011. [DOI] [PMC free article] [PubMed] [Google Scholar]
- 22.Hofbauer LC, Khosla S. Androgen effects on bone metabolism, recent progress and controversies. Eur J Endocrinol. 1999;140:271–286. doi: 10.1530/eje.0.1400271. [DOI] [PubMed] [Google Scholar]
- 23.Coxam V, Bowman BM, Mecham M, Roth CM, Miller MA, Miller SC. Effects of dihydrotestosterone alone and combined with estrogen on bone mineral density, bone growth, and formation rates in ovariectomized rats. Bone. 1996;19:107–114. doi: 10.1016/8756-3282(96)00135-4. [DOI] [PubMed] [Google Scholar]
- 24.Balkan W, Burnstein KL, Schiller PC, Perez-Stable C, D’Ippolito G, Howard GA, et al. Androgen-induced mineralization by MC3T3-E1 osteoblastic cells reveals a critical window of hormone responsiveness. Biochem Biophys Res Commun. 2005;328:783–789. doi: 10.1016/j.bbrc.2004.12.090. [DOI] [PubMed] [Google Scholar]
- 25.Vanderschueren D, Vandenput L, Boonen S, Lindberg MK, Bouillon R, Ohlsson C. Androgens and bone. Endocr Rev. 2004;25:389–425. doi: 10.1210/er.2003-0003. [DOI] [PubMed] [Google Scholar]
- 26.Lee YS, Choi EM. Costunolide stimulates the function of osteoblastic MC3T3-E1 cells. Int Immunopharmacol. 2011;11:712–718. doi: 10.1016/j.intimp.2011.01.018. [DOI] [PubMed] [Google Scholar]
- 27.Kang HY, Cho CL, Huang KL, Wang JC, Hu YC, Lin HK, et al. Nongenomic androgen activation of phosphatidylinositol 3-kinase/Akt signaling pathway in MC3T3-E1 osteoblasts. J Bone Miner Res. 2004;19:1181–1190. doi: 10.1359/JBMR.040306. [DOI] [PubMed] [Google Scholar]
- 28.Krum SA. Direct transcriptional targets of sex steroid hormones in bone. J Cell Biochem. 2011;112:401–408. doi: 10.1002/jcb.22970. [DOI] [PMC free article] [PubMed] [Google Scholar]
- 29.Orimo H. The mechanism of mineralization and the role of alkaline phosphatase in health and disease. J Nippon Med Sch. 2010;77:4–12. doi: 10.1272/jnms.77.4. [DOI] [PubMed] [Google Scholar]
- 30.Nakano Y, Addison WN, Kaartinen MT. ATP induced mineralization of MC3T3-E1 osteoblast cultures. Bone. 2007;41:549–561. doi: 10.1016/j.bone.2007.06.011. [DOI] [PubMed] [Google Scholar]
- 31.Bonewald LF, Harris SE, Rosser J, Dallas MR, Dallas SL, Camacho NP, et al. Von Kossa staining alone is not sufficient to confirm that mineralization in vitro represents bone formation. Calcif Tissue Int. 2003;72:537–547. doi: 10.1007/s00223-002-1057-y. [DOI] [PubMed] [Google Scholar]
- 32.Tsutsumi K, Saito N, Kawazoe Y, Ooi HK, Shiba T. Morphogenetic study on the maturation of osteoblastic cells as induced by inorganic polyphosphate. PLoS One. 2014;9:e86834. doi: 10.1371/journal.pone.0086834. [DOI] [PMC free article] [PubMed] [Google Scholar]
- 33.Ali MM, Yoshizawa T, Ishibashi O, Matsuda A, Shimomura J, Mera H, et al. PIASx beta is a key regulator of osterix transcriptional activity and matrix mineralization in osteoblasts. J Cell Sci. 2007;120:2565–2573. doi: 10.1242/jcs.005090. [DOI] [PubMed] [Google Scholar]
- 34.McKee MD, Addison WN, Kaartinen MT. Heirarchies of extracellular matrix and mineral organization in bone of the craniofacial complex and skeleton. Cells Tissues Organs. 2005;181:176–188. doi: 10.1159/000091379. [DOI] [PubMed] [Google Scholar]
- 35.Chen P, Satterwhite JH, Licata AA, Lewiecki EM, Sipos AA, Misurski DM, et al. Early changes in biochemical markers of bone formation predict BMD response to teriparatide in postmenopausal women with osteoporosis. J Bone Miner Res. 2005;20:962–970. doi: 10.1359/JBMR.050105. [DOI] [PubMed] [Google Scholar]
- 36.Bu SY, Hunt TS, Smith BJ. Dried plum polyphenols attenuate the detrimental effects of TNF-alpha on osteoblast function coincident with up-regulation of Runx2, Osterix and IGF-I. J Nutr Biochem. 2009;20:35–44. doi: 10.1016/j.jnutbio.2007.11.012. [DOI] [PubMed] [Google Scholar]
- 37.Salasznyk RM, Williams WA, Boskey A, Batorsky A, Plopper GE. Adhesion to vitronectin and collagen I promotes osteogenic differentiation of human mesenchymal stem cells. J Biomed Biotechnol. 2004;2004:24–34. doi: 10.1155/S1110724304306017. [DOI] [PMC free article] [PubMed] [Google Scholar]
- 38.Wang W, Olson D, Liang G, Franceschi RT, Li C, Wang B, et al. Collagen XXIV (Col24α1) promotes osteoblastic differentiation and mineralization through TGF-β/Smads signaling pathway. Int J Biol Sci. 2012;8:1310–1322. doi: 10.7150/ijbs.5136. [DOI] [PMC free article] [PubMed] [Google Scholar]
- 39.Siddiqui S, Arshad M. Osteogenic potential of punica granatum through matrix mineralization, cell cycle progression and runx2 gene expression in primary rat osteoblasts. Daru. 2014;20:72. doi: 10.1186/s40199-014-0072-7. [DOI] [PMC free article] [PubMed] [Google Scholar]
- 40.Hoemann CD, El-Gabalawy H, McKee MD. In vitro osteogenesis assays:influence of the primary cell source on alkaline phosphatase activity and mineralization. Pathol Biol. 2009;57:318–323. doi: 10.1016/j.patbio.2008.06.004. [DOI] [PubMed] [Google Scholar]
- 41.Zhi J, Sommerfeldt DW, Rubin CT, Hadjiargyrou M. Differential expression of neuroleukin in osseous tissues and its involvement in mineralization during osteoblast differentiation. J Bone Miner Res. 2001;16:1994–2004. doi: 10.1359/jbmr.2001.16.11.1994. [DOI] [PubMed] [Google Scholar]