Abstract
Objective(s):
Long term consumption of ethanol may induce damage to many organs. Ethanol induces its noxious effects through reactive oxygen species production, and lipid peroxidation and apoptosis induction in different tissues and cell types. Previous experiments have indicated the antioxidant characteristics of thymoquinone, the active constituent of Nigella sativa fixed oil, against biologically dangerous reactive oxygen species. This experiment was planned to evaluate the protective effect of thymoquinone against subchronic ethanol toxicity in rats.
Materials and Methods:
Experiments were performed on six groups. Each group consisted of six animals, including control group (saline, gavage), ethanol-receiving group (3 g/kg/day, gavage), thymoquinone (2.5, 5, 10 mg/Kg/day, intraperitoneally (IP)) plus ethanol and thymoquinone (10 mg/Kg/day, IP) groups. Treatments were carried out in four weeks.
Results:
Thymoquinone reduced the ethanol-induced increase in the lipid peroxidation and severity of histopathological alteration in liver and kidney tissues. In addition it improved the levels of proinflammatory cytokines in liver tissue. Furthermore, thymoquinone corrected the liver enzymes level including alanine transaminase, aspartate transaminase and alkaline phosphatase in serum and glutathione content in liver and kidney tissues. Other experiments such as Western blot analysis and quantitative real-time RT-PCR revealed that thymoquinone suppressed the expression of Bax/Bcl-2 ratio (both protein and mRNA level), and caspases activation pursuant to ethanol toxicity.
Conclusion:
This study indicates that thymoquinone may have preventive effects against ethanol toxicity in the liver and kidney tissue through reduction in lipid peroxidation and inflammation, and also interrupting apoptosis.
Keywords: Apoptosis, Ethanol toxicity, GSH content, Lipid peroxidation, Nigella sativa, Thymoquinone
Introduction
Ethanol has played an important role in medical practice and alcoholic beverages include wines, beers and spirits (1). Hence ethanol is a widely consumed organic solvent with toxic properties both systemically and to the central nervous system (CNS(. Its toxic properties can be expressed following an acute over-dose or after extended chronic consumption. A relative-ly high LD50 value of ethanol, suggests that this agent acts relatively non-specifically on a widespread range of cellular targets rather than at a single critical site. Therefor, the noxious effects of ethanol toxicity perhaps represent a summation of a series of adverse meta bolic modulations (2). Ethanol toxicity in different tissues subsequent to acute and chronic consumption has been proved in human and animals. Ethanol changes fat and carbohydrate metabolism. Hepatic lipoprotein release is decreased, while hepatic de novo lipogenesis, mobilization of fat stores for use by peripheral tissues, and hepatic absorption of circulating lipids are increased. The changes in NADH/NAD+ ratio prevent the function of the Krebs cycle and decelerate fatty acid oxidation. These effects increase serum triglycerides and cause steatosis (fatty liver), a condition in which triglycerides accumulate in hepatocytes (3). Liver disorders such as adipose infiltration, alcoholic hepatitis, and fibrosis are associated with ethanol consumption (4). Ethanol can cause hepatotoxicity and nephrotoxicity as indicated by histopatological changes in addition to increased levels of liver enzyme like alanine transaminase (ALT), aspartate transaminase (AST) and alkaline phosphatase (ALP). Some investigation demonstrated that the levels of malondialdehyde (MDA) and inflammatory media-tors such as tumor necrosis factor-α (TNF-α) and interleukin-6 (IL-6) were significantly increased in the liver and kidney of ethanol treated rats. In addition glutathione (GSH) content reduction in such tissues was reported (5, 6).
It was shown that ethanol causes toxic effects by production of reactive oxygen species (ROS) and lipid peroxidation induction in different tissues and cells. It was indicated that excess microsomal ROS production has been started during ethanol metabolism. By means of spin-trapping techniques, it was shown that the hydroxyl ethyl radical, an active and relatively short-lived oxidant species, is the main deleterious species. This radical is not as reactive as the hydroxyl and therefor can diffuse toward, and impair more distant cells and target molecules. In addition, ROS activity could be monitored via an intracellular fluorescent probe produced by the oxidation of a non-fluorescent precursor. Using this probe (2’,7’-dichlorodihydrofluorescein), the evidence of ethanol-induced hepatic and cerebral ROS production was found (2). Besides to oxidative stress, ethanol can stimulate apoptosis by initiation of both intrinsic and extrinsic signaling pathway (5, 6). It is pointed that oxidative stress and subsequent depletion of antioxi-dant defense of cells and tissues may lead to apoptotic cell death. So that this procedure can be blocked by antioxidant agents (7).
Antioxidants have a fundamental role in preventing free radical induced damage through scavenging them. Thymoquinone (TQ) (2-isopropyl-5-methyl-1,4-benzo-quinone) is the foremost component of the volatile oil of Nigella sativa seeds. The black seed of N. sativa L., family Ranunculaceae, comprises a fixed oil (>30%) and a volatile oil (0.40%-0.45%), which contains of 18.4% to 24% TQ. Previous studies suggest that TQ or N. sativa oil might have different pharmacological actions including protective effects in metabolic syndrome, chronic neuropathic pain, ischemia-reperfusion induced kidney and skeletal muscle damage, and epileptic seizures (8-15). In previous studies, it was found that N. sativa fixed oil (NOS) has neuroprotective, antimicrobial, antibacterial, antitussive, anticonvulsant, analgesic and anti-inflammatory effect, and also has protective effects against ethanol induced toxicity in liver and kidney through lessening the oxidative degradation of lipids (lipid peroxidation), increasing antioxidant capacity (glutathione levels), reducing some liver enzyme levels like ALT, AST, and ALP, and some inflammatory cytokine levels (IL-6), attenuating histopathological changes, and also inhibiting apoptosis(16-23). In 1960 after the first extraction of TQ, the active constituent of NOS, it was investigated for its antioxidant, anti-inflammatory and anticancer activities in both in vitro and in vivo models. Its antioxidant/anti-inflammatory effects have been described in numerous disease models, including encephalomyelitis, diabetes, asthma, carcinogenesis, and other conditions such as acetaminophen induced hepatotoxicity or paraquat herbicide induced lung fibrosis (24-26). According to the Ismail et al. results (27), thymoquinone rich fraction (TQRF) and TQ at dosages ranging from 0.5 to 1.5 g/kg and 20 to 100 mg/kg body weight, respectively, for 8 weeks demonstrated considerable inhibitory activity against the OH° development in comparison to untreated rats. In line with that, Kanter et al. (28) have reported that TQ could partially protect gastric mucosa against mucosal injury induced by acute ethanol exposure, and these gastroprotective effects may be due to their antiperoxidative and antioxidant effects. A few studies have also shown that TQ may have protective effects against lipid peroxidation process (7). El Mezayen et al (29) implied that TQ may have an anti-inflammatory effect during the allergic response in the lung by inhibition of prostaglandin D2 synthesis and Th2-driven immune response. Recent investigation demonstrated the protective effect of metformin and TQ against ethanol-induced neuronal apoptosis in primary rat cortical neurons, and also against acrylamide-induced neurotoxicity in Wistar rats (30, 31).
Hence, this study was designed to evaluate the protective effect of TQ, the active constituent of N. sativa, against toxic effects of ethanol in rats.
Materials and Methods
Chemicals
Thymoquinone (2-isopropyl-5-methyl-1,4-benzo-quinone) purchased from Sigma, St Louis, Mo, absolute ethanol, malondialdehyde, thiobarbituric acid (TBA), sodium dodecyl sulphate (SDS),β-Mercaptoethanol (β-ME), and N,N,N,N-Tetramethyl-ethylenediamine (TEMED) were purchased from Merck. Complete protease inhibitor cocktail, Phenyl-methanesulfonyl fluoride (PMSF), and reduced glutathione were provided by Sigma-Aldrich Chemical Company. Rabbit monoclonal antibody for detection of caspase-3, caspase-8, caspase-9, Bcl-2, and Bax protein, and also mouse monoclonal β-actin antibody, anti-rabbit secondary antibody, and anti-mouse secondary antibody were obtained from Cell Signaling. Coomassie (Bradford) Protein Assay Kit and polyvinylidene difluoride (PVDF) membrane were provided by Bio-Rad. Enhanced chemiluminescence Western Blo-tting Substrate (ECL) and BCA protein assay kit were purchased from Pierce. Express one-step SYBR R Green ER™kit and Rat ELISA Kit for IL-6 and TNF-α detection were obtained from Invitrogen.
Animals
Thirty six adult male Wistar rats (weight 200-250 g) were provided by Animal Center of School of Pharmacy, Mashhad University of Medical Sciences. Rats were housed in plastic cages, on a 12 hr light/dark cycle and kept in a conditioned atmosphere at 25 °C and fed standard laboratory pellets with tap water ad libitum throughout the experimental period. All experimental procedures were carried out in accordance with Mashhad University of Medical Sciences, Ethical Committee Acts.
Experimental design
The rats were randomly assigned into six groups each consisted of six rats. The first group received normal saline orally by gavage once a day for four weeks, the second group was administered ethanol 3 g/kg/day, the third, fourth, and fifth groups were treated with ethanol 3 g/kg/day plus TQ at 2.5, 5 and 10 mg/kg/day doses respectively, the sixth group received TQ 10 mg/kg/day. Ethanol was diluted in normal saline to a final concentration of 40% (v/v) and was administered orally by gavage for four weeks. TQ was dissolved in 0.8% Tween 80 (in normal saline) and the solution was prepared fresh just before intraperitoneally administration. The ethanol and TQ doses were determined according to the results of pilot test (the data are not shown).
After four weeks, fasting rats were killed by decapitation. Immediately after decapitation, blood samples were collected in dry tubes and allowed to coagulate. Clotted blood samples were subjected to centrifuge at 2000×g for 15 min to segregate the serum that were stored at -80 °C for biochemical analysis. The liver and kidney tissues were immediately dissected out and washed in normal saline. Quadrate lobe of liver and left kidney preserved in 10% neutral buffered formalin for histopathology examination. Three other lobes of liver and right kidney were kept at -80 °C for several other analyses.
Biochemical blood tests
Serum levels of some liver enzyme like AST, ALT and ALP were assessed employing commercial colorimetric kits.
Inflammatory biomarker measurment
The inflammatory biomarkers like αTNF-α and IL-6 were evaluated in the liver tissue employing Invitrogen Elisa kits.
Assessment of lipid peroxidation in the liver and kidney tissues
The extent of oxidative stress was evaluated by measuring malondialdehyde (lipid peroxidation biomarker) concentration using spectrophotometry. For this purpose the liver and kidney tissues from different groups were homogenized for 2 min at 4 °C in 1.15% KCl in order to provide a 10% homogenate (w/v). Homogenates were subjected to centrifuge (Hettich, Germany) at 3000 g for 10 min to acquire supernatants. MDA levels were determined in accordance with the method of Niehaus and Samuelsson (32). Briefly, 0.5 ml of the sample was mixed with 3 ml of 1% phosphoric acid and 1 ml of 0.6% TBA solution and the mixture was incubated for 45 min in a boiling water bath. The tested tubes were cooled at room temperature. Then, 4 ml of n-butanol was added, and vortex-mixed for 1 min followed by centrifugation at 3000 g for 10 min. Butanol phase (supernatant) was transferred to a fresh tube and its absorbance measured at 532 nm. Tissue MDA content was expressed as nmol/g tissue.
Measurement of reduced glutathione (GSH) content in the liver and kidney tissues
Hepatic and nephrotic antioxidant capacity were assessed through GSH content measurement in accordance with the method of Moron et al (33). To obtain 10% homogenate (w/v), the liver and kidney tissues were homogenized in ice cold phosphate buffered saline (PBS, pH 7.4). Homogenates were centrifuged at 3000 g for 10 min. reduced glutathione content was measured in supernatants employing 5,5´-dithiobis (2-nitrobenzoic acid) (DTNB) which produced a yellow-colored 5-thio-2-nitrobenzoic acid (TNB). Briefly, homogenates were immediately precipitated with the equal amount of 10% TCA and the precipitate was removed after centrifugation at 3000 g for 5 min. Then 0.5 ml of 0.04% DTNB reagent was added to 0.5 ml of supernatants plus 2 ml sodium phosphate buffer (0.1 M, pH 8.0). Finally, the absorbance of yellow colored TNB was read at 412 nm using a UV–VIS spectrophotometer. Tissue GSH contents were expressed as nmol/g tissue.
Histopathological evaluation
For histopathological examination specimens from liver and kidney were taken from all rat groups after scarification. The tissues were fixed in 10% buffered formalin for at least 24 hr and then embedded in paraffin; sectioned at 6 μm and finally stained with hematoxylin and eosin stain (H.& E. stain) for microscopical assay by a standard protocol. Histopathological criteria such as severe congestion were determined semi-quantitatively as mild (+), moderate (++) and severe (+++).
Western blot analysis
For Western blot analysis, liver and kidney tissues were homogenized in the homogenization buffer containing 50 mM Tris pH 7.4, 10 mM NaF, 2 mM EDTA, 10 mM β-glycerol phosphate, 1 mM Na3VO4, 0.2% W/V sodium deoxycholate, 1 mM phenylmethylsulfonyl fluoride (PMSF), and complete protease inhibitor cocktail (Sigma, P8340) employ-ing polytron homogenizer (POLYTRON_ PT 10–35, Kinematica, Switzerland) in ice. The lysates were clarified by centrifugation at 4 °C for 15 min at 10,000 g. Protein concentration of the supernatants was determined using the Bradford protein assay kit (Bio-Rad). Levels of Bax, Bcl-2, caspase-3, caspase-8, caspase-9 and β-actin were measured by immune blotting analysis. Briefly, prepared samples were mixed with loading buffer and heated for 8 min at 95 °C, separated by sodium dodecyl sulfate-polyacrylamide gel electrophoresis on a 12% gel, and then transferred to polyvinylidene fluoride (PVDF) membrane. The blots were incubated in blocking buffer TBS-T (5% nonfat milk and 0.1% Tween-20 in Tris-buffered saline) for 2 hr at room temperature. The primary antibodies were rabbit monoclonal anti-serum against Bcl-2 (Cell Signaling, #2870), caspase-3 (Cell Signaling, #9665), caspase-8 (Cell Signaling, #4790), caspase-9 (Cell Signaling, #9506) and rabbit polyclonal anti-serum against Bax (Cell Signaling, #2772), and mouse monoclonal anti-serum against β-actin (Cell Signaling, # 3700). All antibodies were used at a dilution of 1:1000. Anti-rabbit IgG labeled with horseradish peroxidase (Cell Signaling, #7074) and anti-mouse IgG labeled with horseradish peroxidase (Cell Signaling, #7076) were used as secondary antibodies. The blots were incubated with the primary antibodies at 4 °C overnight and then washed three times for 10 min each in TSB with 0.1% Tween-20. Finally, the membranes were incubated with the corresponding secondary antibody and washed as described above. Protein bands were visualized using an enhanced chemiluminescence (Pierce ECL Western blotting substrate) and Alliance gel doc (Alliance 4.7 Gel doc, UK). UV Tec software (UK) was used to semi-quantify protein bands. All protein bands were normalized against β-actin protein.
Extraction of RNA and real-time quantitative polymerase chain reaction
Total RNAs were extracted from frozen liver and kidney tissues using High pure RNA tissue kit (Roche, #12033674001) in accordance with the manufacturer instruction. Nanodrop (NanoDrop™ 2000, USA) was employed to determine the quality (260/280 and 260/230 ratios) and quantity of isolated RNAs and samples were stored at -80 °C until use. Quantitative RT-PCR was performed with step one thermal cycler (ABI) and Express one-step SYBR R Green ER™kit (Invitrogen, #11780–200). Primer pairs to measure Bax, Bcl-2 and β-actin mRNA expression, were chosen according to previous Design® software (BioSoft) (Table 1).
Table 1.
Sequences of different primers used for real-time PCR reactions
| Gene | Primer | Sequence |
|---|---|---|
| Bcl-2 | Forward | 5’-GGTGGAGGAACTCTTCAGGGA-3’ |
| Reversed | 5’- GGTTCAGGTACTCAGTCATCCA-3’ | |
| Bax | Forward | 5’-TGCTGATGGCAACTTCAACT-3’ |
| Reversed | 5’-ATGATGGTTCTGATCAGCTCG-3’ | |
| β-actin | Forward | 5’- GGGAAATCGTGCGTGACATT-3’ |
| Reversed | 5’- GCGGCAGTGGCCATCTC-3’ |
Melting curve analysis was done to analyze quality of primers and products. The relative quantitation values of considered genes were normalized against β-actin. Delta-delta CT procedure was used to determine fold increase of genes in compare to control group.
Statistical analysis
Data are expressed as mean ± SEM. All statistical comparisons were made by one-way analysis of variance (ANOVA) followed by Tukey–Kramer test. Statistical analysis was performed using GraphPad InStat v. 6.07 (GraphPad Software, Inc., La Jolla, CA, USA). P-values less than 0.05 were considered significant.
Results
Biochemical blood tests
ALT, AST and ALP were increased significantly in the ethanol treated group in comparison to the control group. TQ prevented ethanol induced increase in ALT, AST and ALP levels (P<0.001) (Figures 1A, 1B and 1C, respectively).
Figure 1.
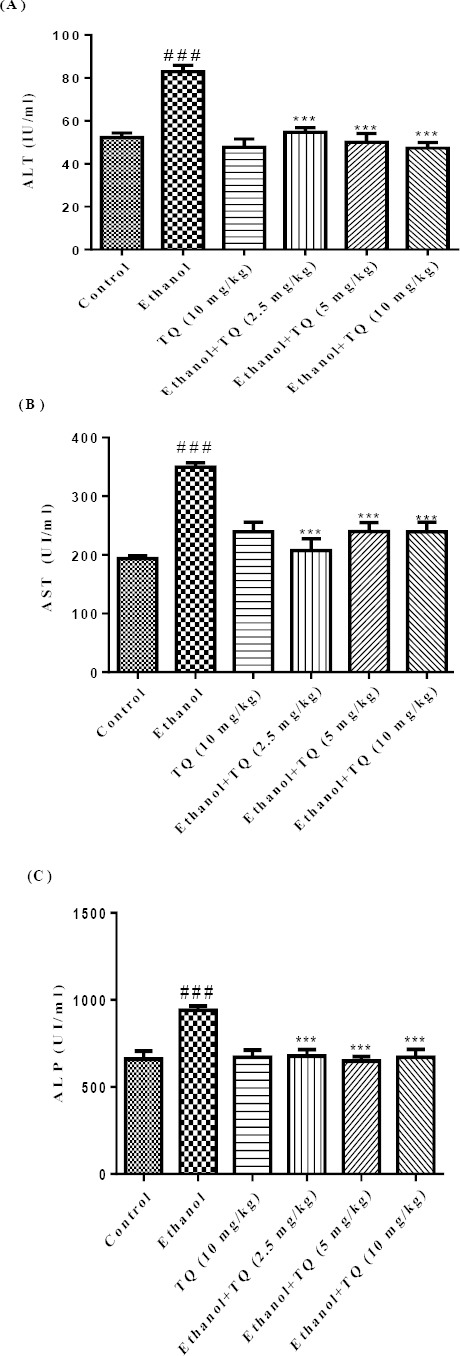
Effects of ethanol and TQ treatment (4 weeks) on serum levels of ALT (A), AST (B) and ALP (C) in rats. TQ was administered intraperitoneally, once a day. Ethanol was administered via gavage to rats once a day. Data showed as mean±SEM, # Comparison with control, * Comparison with ethanol treated group. *** or ### P<0.001, Tukey-Kramer test, n=6
Inflammatory biomarker measurement
The ethanol treated group showed significant increase in hepatic levels of IL-6 and TNF-α, when compared with the control group (P<0.001 and P<0.01, respectively). The augmentation of IL-6 and TNF-α levels by ethanol was significantly decreased by TQ (10 mg/kg) (P<0.01 and P<0.05, respectively) (Figures 2A and 2B).
Figure 2.
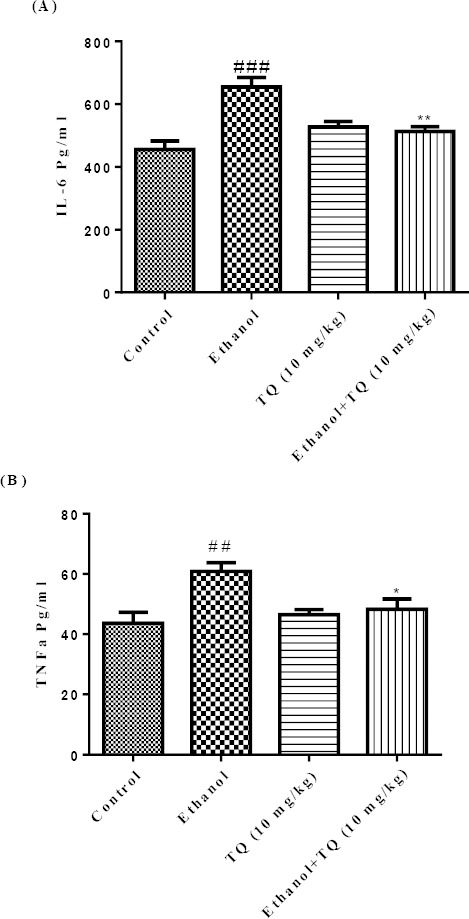
Effects of ethanol and TQ treatment (4 weeks) on IL-6 (A) and TNF-α (B) levels in the liver. TQ was administered intraperitoneally, once a day. Ethanol was administered via gavage to rats once a day. Data showed as mean±SEM, # Comparison with control, * Comparison with ethanol-treated group. * P<0.05, ** P<0.01 or ##P<0.01 and ###P< 0.001, Tukey-Kramer test, n=6
Assessment of lipid peroxidation and reduced GSH content in the liver and kidney tissues
Results demonstrated that ethanol increased lipid peroxidation (MDA level) but reduced the antioxidant capacity (GSH content) in the liver and kidney of rats (P<0.001), which could be reversed by TQ treatment. MDA levels were significantly decreased in TQ plus ethanol (group 3, 4 and 5) in the liver and kidney (P<0.001) (Figures 3A and 3B, respectively) in comparison to ethanol group (group 2). TQ plus ethanol also significantly augmented the GSH content compared to ethanol treated rats in the liver and kidney (P<0.001) (Figures 4A and 4B, respectively).
Figure 3.
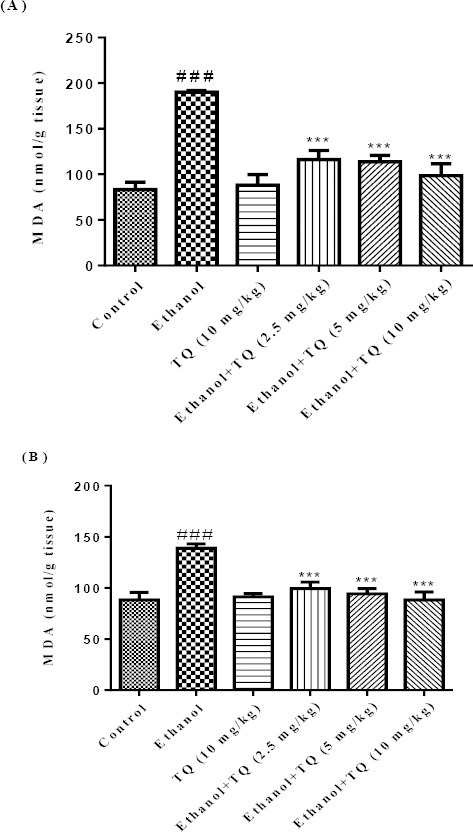
Effects of ethanol and TQ treatment (4 weeks) on MDA level in the liver (A) and kidney (B) in rats. TQ was administered intraperitoneally, once a day. Ethanol was administered via gavage to rats once a day. Data showed as mean ± SEM, # Comparison with control, * Comparison with ethanol-treated group. *** or ### P<0.001, Tukey-Kramer test, n = 6
Figure 4.
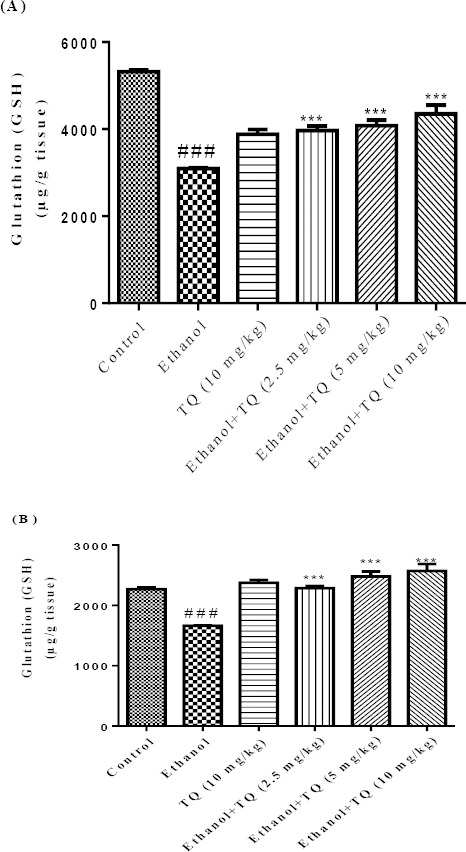
Effects of ethanol and TQ treatment (4 weeks) on GSH content in the liver (A) and kidney (B) in rats. TQ was administered intraperitoneally, once a day. Ethanol was administered via gavage to rats once a day. Data showed as mean ± SEM, # Comparison with control, * Comparison with ethanol-treated group. *** or ### P<0.001, Tukey-Kramer test, n = 6
Histopathological evaluation
Histopathological alteration of liver and kidney tissues are presented in Table 2, Figure 5 and Figure 6. The control and TQ (10 mg/kg) treated groups (group 1 and group 6 respectively) presented livers with Table normal architecture (Figures 5A and 5G). Histological changes were observed in ethanol treated group (group 2) in the liver. Liver damage caused by ethanol exposure included severe congestion (+++), steatosis (++) and infiltration of inflammatory focal portal space (++) (Table 2 and Figures 5B, 5C). Although these outcomes were also observed in the ethanol plus TQ groups (group 3, 4 and 5), the incidence and severity of histopathological lesions were less than those in the ethanol group (group 2) (Table 2 and Figures 5D, 5E and 5F).
Table 2.
Effect of thymoquinone (TQ) and ethanol (Et) on histopathological changes in liver and kidney tissues of rat after 4 weeks treatment. Histopathological criteria were determined semi-quantitatively from mild (+) to moderate (++) and sever (+++), n=6
| Groups | Liver | Kidney |
|---|---|---|
| Control | normal | normal |
| Ethanol | severe congestion (+++), steatosis (++) and infiltration of inflammatory focal portal space (++) | severe congestion (+++), hematuria (++) and infiltration of inflammatory focal adjacent glomerular (++) |
| TQ (10 mg/kg) | normal | normal |
| Et + TQ (2.5 mg/kg) | moderate congestion (++) | moderate congestion (++) |
| Et + (5 mg/kg) | mild congestion (+) | mild congestion (+) |
| Et + TQ (10 mg/kg) | normal | normal |
Figure 5.
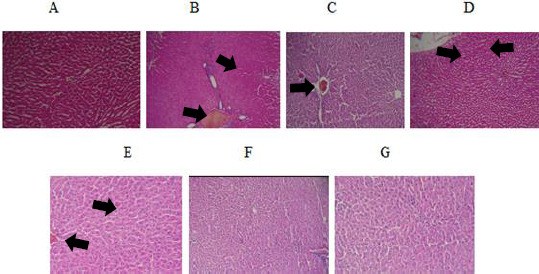
(A) Normal liver of control rats. Hematoxylin and eosin, ×100. (B) and (C) Ethanol treated rats show severe congestion, steatosis and infiltration of inflammatory focal portal space. Hematoxylin and eosin, ×100. (D) Liver sections of rats received TQ 2.5 mg/kg plus ethanol showing moderate congestion. Hematoxylin and eosin, ×100. (E) Mild congestion was observed in rats received TQ 5 mg/kg plus ethanol. Hematoxylin and eosin, ×100. (F) and (G) Liver tissues of rats received TQ 10 mg/kg plus ethanol and TQ alone at dose 10 mg/kg were normal. Hematoxylin and eosin, ×100
Figure 6.
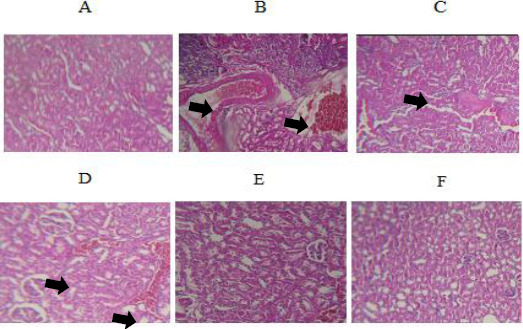
(A) Normal kidney of control rats. Hematoxylin and eosin, ×100. (B) Ethanol treated rats show severe congestion and hematuria. Hematoxylin and eosin, ×100. (C) Kidney sections of rats received TQ 2.5 mg/kg plus ethanol showing mild congestion. Hematoxylin and eosin, ×100. (D) Mild congestion was observed in rats received TQ 5 mg/kg plus ethanol. Hematoxylin and eosin, ×100. (E) and (F) Kidney tissues of rats received TQ 10 mg/kg plus ethanol and TQ alone at dose 10 mg/kg were normal. Hematoxylin and eosin, ×100
Similarly, all histological features were normal in the control group (group 1) and TQ alone at dose (10 mg/kg) (group 6) in the kidney (Figures 6A and 6G). Kidney tissues from all rats treated with ethanol (group 2) showed extensive histopathological changes, characterized by moderate or severe congestion (+++), hematuria (++) and infiltration of inflammatory focal adjacent glomerular (++) (Table 2 and Figures 6B and 6C). The kidney lesions were attenuated in all ethanol plus TQ groups in comparison to ethanol treated group (Table 2 and Figure 6D, 6E and 6F).
Western blot analysis
To determine whether TQ exerts its effects by inhibiting apoptosis, we investigated BAX, BCL-2, caspase-3, caspase-8 and caspase-9 protein levels by Western blot analysis. Results showed that ethanol treatment may up-regulated the expression of Bax/Bcl-2 in the liver and kidney (P<0.001) (Figures 7 and 8 respectively). Similarly, expression of caspase-3, caspase-8 and caspase-9 were up-regulated by ethanol in the liver (Figures 9, 11 and 13 respectively) and kidney (Figures 10, 12 and 14 respectively) tissues. In contrast, co-treatment of ethanol with TQ (10 mg/kg) (group 5) significantly reduced the ratio of Bax/Bcl-2 in liver and kidney (P<0.01 and P<0.001, respectively) (Figures 7 and 8 respectively). Furthermore, TQ (10 mg/kg) reduced the ethanol induced activation of caspase-3 (19 KDa), and subsequently decreased the protein level of cleaved caspase-3 (17 KDa) in the liver and kidney (P<0.001 and P<0.05, respectively) (Figures 9 and 10 respectively). Administration of TQ (10 mg/kg) to animals significantly attenuated the ratio of cleaved caspase-8 and cleaved caspase-9 in the liver (P<0.001) (Figures 11 and 13 respectively) and kidney (P<0.05) (Figures 12 and 14 respectively).
Figure 7.
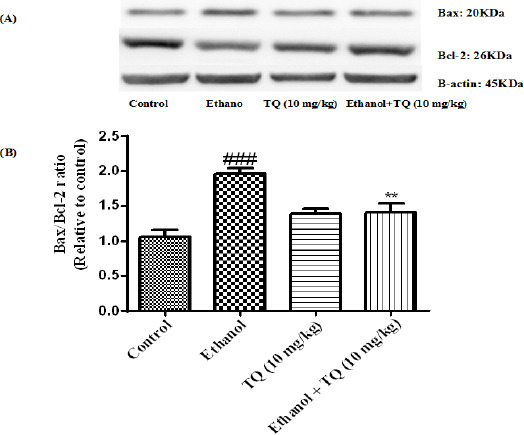
Effect of TQ (10 mg/kg) and ethanol on the protein levels of Bax and Bcl-2 in the rat liver tissue. (A) Representative Western blots showing specific bands for Bax, Bcl-2 and β-actin as an internal control. Equal amounts of protein sample (50 μg) obtained from whole liver homogenate were applied in each lane. (B) Densitometric data of protein analysis. Data are expressed as the mean ± SEM. ** P<0.01 vs ethanol treated group, ### P<0.001 vs control group
Figure 8.
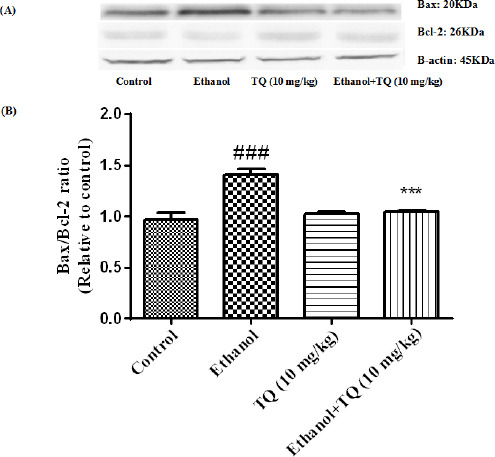
Effect of TQ (10 mg/kg) and ethanol on the protein levels of Bax and Bcl-2 in the rat kidney tissue. (A) Representative Western blots showing specific bands for Bax, Bcl-2 and β-actin as an internal control. Equal amounts of protein sample (50 μg) obtained from whole kidney homogenate were applied in each lane. (B) Densitometric data of protein analysis. Data are expressed as the mean±SEM. *** P<0.001 vs ethanol treated group, ### P<0.001 vs control group
Figure 9.
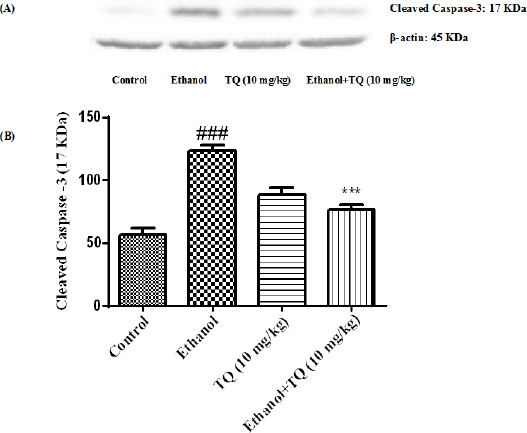
Effect of TQ (10 mg/kg) and ethanol on the protein level of caspase-3 (cleaved caspase-3) in the rat liver tissue. (A) Representative Western blots showing specific bands for cleaved caspase-3 (17 KDa) and β-actin as an internal control. Equal amounts of protein sample (50 μg) obtained from whole liver homogenate were applied in each lane. (B) Densitometric data of protein analysis. Data are expressed as the mean±SEM. *** P< 0.001 vs ethanol treated group, ### P<0.001 vs control group
Figure 11.
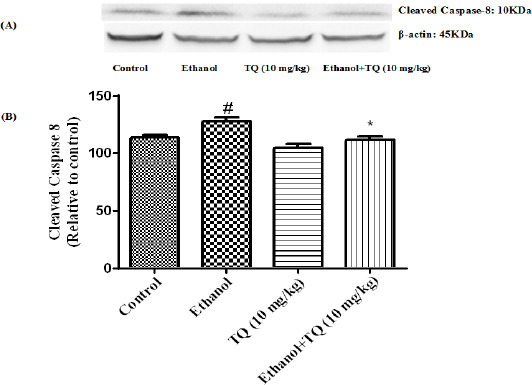
Effect of TQ (10 mg/kg) and ethanol on the protein level of caspase-8 (cleaved caspase-8) in the rat liver tissue. (A) Representative Western blots showing specific bands for cleaved caspase-8 (10 KDa) and β-actin as an internal control. Equal amounts of protein sample (50 μg) obtained from whole liver homogenate were applied in each lane. (B) Densitometric data of protein analysis. Data are expressed as the mean±SEM. * P< 0.05 vs ethanol treated group, # P<0.05 vs control group
Figure 13.
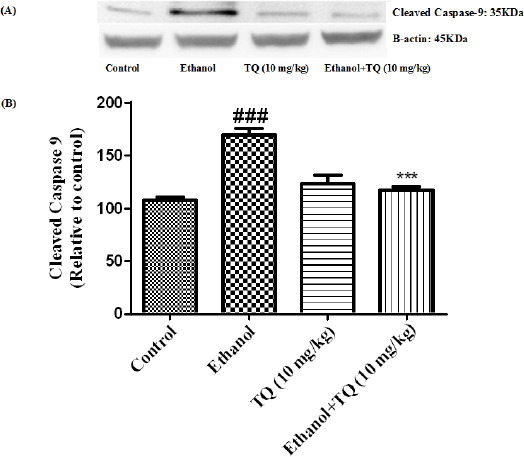
Effect of TQ (10 mg/kg) and ethanol on the protein level of caspase-9 (cleaved caspase-9) in the rat liver tissue. (A) Representative Western blots showing specific bands for cleaved caspase-9 (35 KDa) and β-actin as an internal control. Equal amounts of protein sample (50 μg) obtained from whole liver homogenate were applied in each lane. (B) Densitometric data of protein analysis. Data are expressed as the mean±SEM. *** P< 0.001 vs ethanol treated group, ### P<0.001 vs control group
Figure 10.
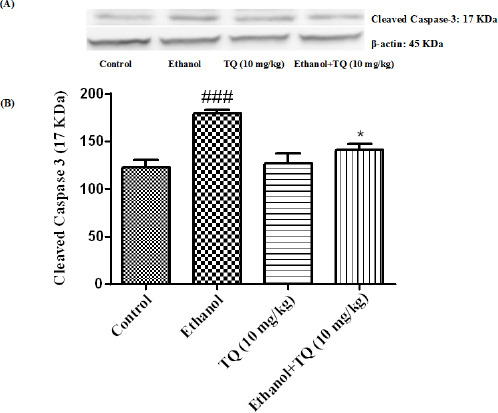
Effect of TQ (10 mg/kg) and ethanol on the protein level of caspase-3 (cleaved caspase-3) in the rat kidney tissue. (A) Representative Western blots showing specific bands for cleaved caspase-3 (17 KDa) and β-actin as an internal control. Equal amounts of protein sample (50 μg) obtained from whole kidney homogenate were applied in each lane. (B) Densitometric data of protein analysis. Data are expressed as the mean±SEM. * P<0.05 vs ethanol treated group, ### P<0.001 vs control group
Figure 12.
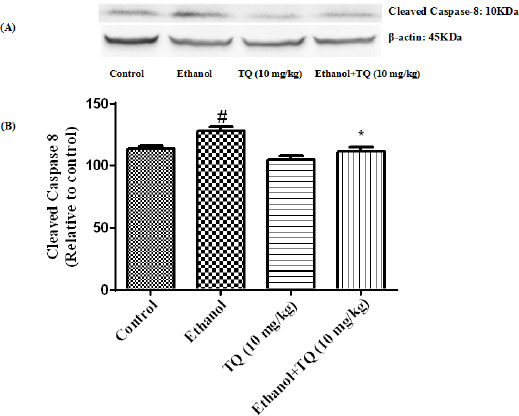
Effect of TQ (10 mg/kg) and ethanol on the protein level of caspase-8 (cleaved caspase-8) in the rat kidney tissue. (A) Representative Western blots showing specific bands for cleaved caspase-8 (10 KDa) and β-actin as an internal control. Equal amounts of protein sample (50 μg) obtained from whole kidney homogenate were applied in each lane. (B) Densitometric data of protein analysis. Data are expressed as the mean±SEM. * P<0.05 vs ethanol treated group, # P<0.05 vs control group
Figure 14.
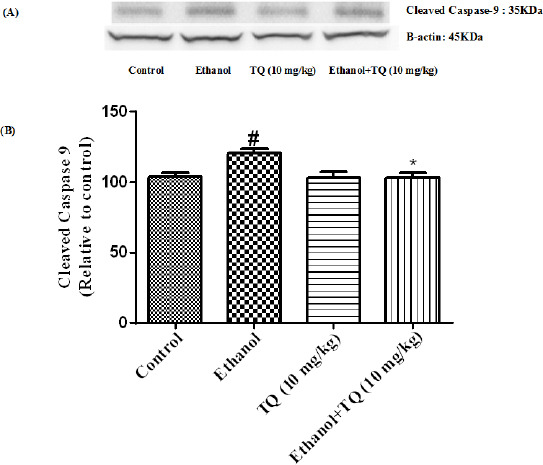
Effect of TQ (10 mg/kg) and ethanol on the protein level of caspase-9 (cleaved caspase-9) in the rat kidney tissue. (A) Representative Western blots showing specific bands for cleaved caspase-9 (35 KDa) and β-actin as an internal control. Equal amounts of protein sample (50 μg) obtained from whole kidney homogenate were applied in each lane. (B) Densitometric data of protein analysis. Data are expressed as the mean±SEM. * P<0.05 vs ethanol treated group, # P<0.05 vs control group
Effects of TQ on BAX/BCL-2 related gene expression in the liver and kidney tissues
To further confirm whether BAX/BCL-2 related genes are induced by ethanol, we inspected the mRNA levels of these genes by quantitative RT-PCR. Our results demonstrated that ethanol may up-regulate Bax/Bcl-2 mRNA expression ratio in the liver and kidney. Bax/Bcl-2 mRNA expression ratio was diminished in simultaneous administration of ethanol and TQ (10 mg/kg) in the liver and kidney (P<0.05) (Figures 15A and 15B respectively).
Figure 15.
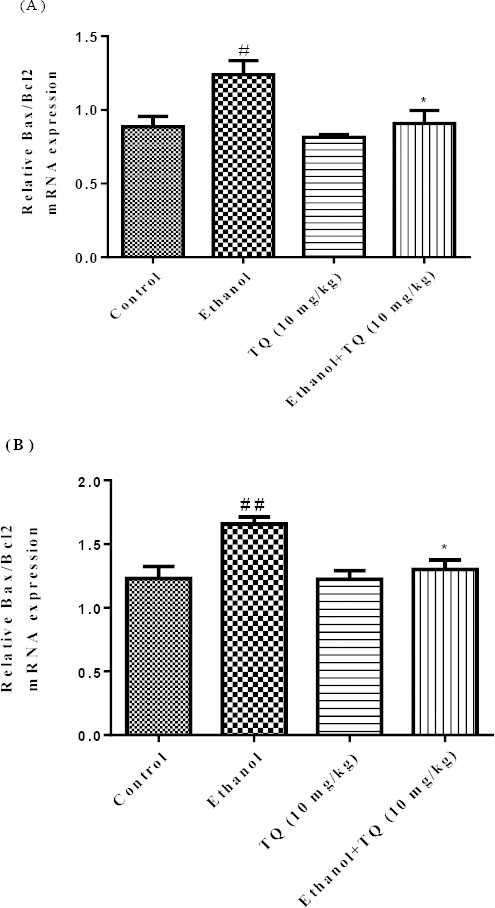
Effect of ethanol and TQ (10 mg/kg) on Bax/Bcl-2 mRNA expression in the rat liver (A) and kidney (B) after 4 weeks treatment by real time PCR. The transcript level of each sample was normalized against β-actin transcript level. Data are expressed as the mean±SEM. * P<0.05 vs ethanol treated group and ## P< 0.01 or # P< 0.05 vs control group
Discussion
Alcohol ingestion is linked with a number of alteration in cell function and the oxidant–antioxidant system (35). Chronic ethanol exposure is associated with constant presence of its byproducts such as acetaldehyde and acetate in the body that cause direct and indirect toxic effects to mammals and humans (35) and induces its toxic effects by generation of reactive oxygen species (ROS) and lipid peroxidation in different tissues and cell types. Further-more, ethanol can stimulates apoptosis initiation in various cells and tissues (5, 6).
Chronic ingestion of ethanol significantly increased MDA levels (an end-product of lipid peroxidation) in liver and kidney tissues (36). Lipid peroxidation is due to oxidative stress, in which the reciprocal action between free radicals of varied origin and cell membrane unsaturated fatty acids occurs. This process
proceeds by a free radical chain reaction mechanism and leads to production of some reactive aldehydes, like malondialdehyde (MDA). Thus, the level of MDA is considered as lipid peroxidation biomarker (37). Also chronic ingestion of ethanol significantly decreased glutathione peroxidase activity and GSH content in liver and kidney. It is suggested that reduced GSH, as an antioxidant defense, can protect liver and kidney tissues against oxidative stress through scavenging free radicals, so that oxidative damage decrease the reduced GSH content in tissues (38). Our data indicated that following ethanol administration, hepatic and nephrotic levels of MDA were significantly increased, while hepatic and nephrotic content of reduced GSH was significantly decreased (Figures 3 and 4 respectively). It has been shown that subchronic ethanol exposure provokes oxidative stress damages through free radicals generation and subsequent lipid peroxidation in various tissues like liver and kidney (3). These findings are congruent with other studies showing that ethanol significantly increases MDA and decreases reduced GSH in some tissues (6, 8, 39-41).
The histopathological findings revealed that subchronic ethanol exposure caused severe steatosis, central vein congestion, and infiltration of inflamma-tory factors in focal portal space in the liver (Figures 5B and 5C). Also, ethanol caused severe congestion, infiltration of inflammatory factors in focal adjacent glomerular, and hematuria in the kidney (Figures 6B and 6C). It has been indicated that ethanol induced fatty liver, necrosis, inflammation, and accumulation of collagenous fibers (6, 7).
Biochemical blood tests like serum AST, ALT and ALP activities measurement are mainly monitored for the assessment of liver damage. Although these biochemical blood tests are not essentially specific, rise in such enzyme activities are associated with active liver damage. It is suggested that ethanol ingestion may induce increase in AST, ALT and ALP activities (6, 7). Subsequent to hepatocyte plasma membrane destruction due to lipid peroxidation caused by ethanol exposure, the cytosolic enzymes released into the circulatory system. As a result of liver injury, ALP generally is excreted through the bile which results in increased levels of ALP in serum (42). Our data indicate that ethanol induced a considerable increase in AST, ALT and ALP activity in rats (Figure 1). These findings imply that increased activity of these enzymes reflects hepatic deteriora-tion and it is likely that ethanol caused such biochemical alterations in liver (43).
TNF-α, a pivotal cytokine involved in inflammation, is produced primarily by Kupffer cells in the liver. The main event in the process of alcohol-induced liver damage is activation of Kupffer cells by gut-derived endotoxin. Activated Kupffer cells yield various mediators, including cytokines, eicosanoids, proteases and oxygen radicals that participate in inflammation, immune responses, and modulation of hepatocyte metabolism. Plasma levels of TNF-α, IL-1 and IL-6 were raised in patients with severe alcoholic hepatitis (44). Inflammatory cytokines such as IL-6, IL-1 and TNF-α together, induce the acute phase response. The acute phase response is a rapid inflammatory response that provides protection against infection, tissue injury (e.g. due to ethanol toxicity), trauma etc. Typically, it is associated with an increase in inflammatory factors (such as pro-inflammatory cytokines like TNF-α and IL-6) (45). Our data implicate that ethanol treated group shows an increase in IL-6 and TNF- α levels compared to control group (Figure 2). These results were in agreement with other experiments that demonstrated increased levels of TNF-α and IL-6 due to ethanol exposure in some tissues of rats (6, 7).
Intracellular reactive oxygen species and increased levels of lipid peroxidation products have been signified as being associated with apoptosis (46). Various experiments indicated that ethanol toxicity could be result in apoptosis (39). Subsequent to cell exposure to programmed cell death (apoptosis) stimulator, cytochrome c release, from mitochondria into the cyto-plasm, occurred. Cytochrome c in cytoplasm activates proteolytic molecules known as caspases that specifically cleave the amino acid sequence Asp-Glu-Val-Asp (DEVD), and are crucial for the execution of apoptosis. The protein Bcl-2 prevents the cytochrome c release and therefor inhibits the activation of caspases, oppositely the protein Bax induces the cytochrome c release, caspase-3 activation, membrane blebbing, nuclear fragmentation, and cell death (47). Once cytochrome c release occurred, it activates caspase-9, and then active caspase-9 cleaves and activates the effector caspase-3 (48). The initiator caspase-8 may be stimulated by cell membrane death receptors. These apoptotic pathway key factors were inves-tigated in this study, to comprehend whether subchronic exposure to ethanol can trigger apoptosis in liver and kidney tissues. Our data demonstrated that subacute ethanol toxicity may increase the both mRNA and protein ratio of Bax and Bcl-2 (Bax/Bcl-2) in the liver and kidney tissues (Figures 7, 8 and 15). Rise in Bax/Bcl-2 ratio leads to apoptosis in the liver and kidney tissues. To investigate the activation mechanism of apoptosis by ethanol, the levels of caspase-3, caspase-8, and caspase-9 were also estimated. Our finding implied that ethanol exposure induced caspase-3, caspase-8 and caspase-9 activa-tion and elevated the level of cleaved caspase-3, caspase-8 and caspase-9 in the liver and kidney tissues (Figures 9-14 respectively). Thus it is likely that both intrinsic and extrinsic pathways of apoptosis have a major effect in the hepatic and nephrotic toxicity of ethanol.
N. sativa L. (family Ranunculaceae), generally identified as black seed or black cumin, is an annual plant that has been conventionally used in the Indian subcontinent (49), Arabian countries (50) and Europe (51) for culinary and medical purposes as a natural therapy for several diseases and disorders like asthma, hypertension, diabetes, cough, infla-mmation, bronchitis, eczema, headache, fever, influ-enza and dizziness (52). N. sativa seeds include 36%–38% fixed oils, proteins, alkaloids, saponin and 0.4%–2.5% essential oil (51). Unsaturated fatty acids are the main component of N. sativa fixed oil. Many components were described, but the foremost one was thymoquinone (52). Thymoquinone (TQ) was intensively studied and ascribed to possess antioxidant and anti-inflammatory properties (29, 53-55), and to decrease the nephrotoxicity of some chemotherapeutic agents (56). Furthermore the anticonvulsant (57), antinociceptive (58), anticancer, antiproliferative (24), antiapoptotic (48) and antibac-terial (59) activity of TQ has been investigated.
According to our results, simultaneous administra-tion of TQ and ethanol reduced the severity of lipid peroxidation (MDA levels) and increased antioxidant capacity (reduced GSH content) in the liver and kidney tissues in rats (Figures 3 and 4 respectively). In addition, the protective effect of TQ against ethanol-induced hepatotoxicity indicated by the significant reduction of liver enzyme (AST, ALT and ALP) activity (Figure 1), along with considerable decrease in inflammatory cytokine (IL-6 and TNF-α) in liver tissue (Figure 2). Also, TQ through antioxidative (60) and anti-inflammatory effects (53, 61) may defend the liver (Figures 5D, 5E, 5F) and kidney (Figures 6D, 6E, 6F) tissues from histological change stimulated by ethanol. So, in this experiment it was indicated that the lipid peroxidation inhibition characteristic of TQ could be ascribed to the protective effect which prevents plasma membranes destruction and hepatic enzymes release.
It was reported that antioxidants are involved in gene expression and signal transduction pathways, and can impede the incidence of apoptosis. TQ exerts an antiapoptotic effect through attenuating oxidative stress and inhibiting TNF-α induced NF-κB activation. Furthermore, it regulates the Bax/Bcl-2 ratio and inhibits downstream caspases (48). Our results revealed that administration of TQ clearly reduced the both protein and mRNA ratio of Bax and Bcl-2 (Bax/Bcl-2) in the liver and kidney of ethanol treated groups. Furthermore, TQ diminished the activation of caspase-3, caspase-8 and caspase-9 triggered by ethanol in liver and kidney tissues.
Conclusion
In summary, our findings indicated that ethanol-induced hepatotoxicity and nephrotoxicity could be prevented by TQ administration. TQ exerts its protective effect through reducing lipid peroxidation, increasing antioxidant defense (reduced GSH content), reducing liver enzyme (AST, ALT and ALP) and specific inflammatory cytokine release, attenuat-ing histopathological changes, and reducing the severity of apoptosis by decreasing Bax/Bcl-2 ratio and inhibition of caspase-3, caspase-8 and caspase-9 activation.
Acknowledgment
The authors are thankful to the Vice Chancellor of Research, Mashhad University of Medical Sciences, Mashhad, Iran for financial support. The results described in this paper were part of a Master of Science degree thesis.
Conflict of interest
The authors declare that there are no conflicts of interest.
References
- 1.Ghosh S, Guria S, Das M. Alcohol as a risk factor for cancer burden:a review. Proc Zool Soc. 2015;69:32–37. [Google Scholar]
- 2.Bondy SC. Ethanol toxicity and oxidative stress. Toxicol Lett. 1992;63:231–241. doi: 10.1016/0378-4274(92)90086-y. [DOI] [PubMed] [Google Scholar]
- 3.Lieber CS. Hepatic and metabolic effects of ethanol:pathogenesis and prevention. Ann Med. 1994;26:325–330. doi: 10.3109/07853899409148346. [DOI] [PubMed] [Google Scholar]
- 4.Flier JS, Underhill LH, Lieber CS. Medical disorders of alcoholism. N Engl J Med. 1995;333:1058–1065. doi: 10.1056/NEJM199510193331607. [DOI] [PubMed] [Google Scholar]
- 5.Yang H-Y, Lin H-S, Chao JC, Chien Y-W, Peng H-C, Chen J-R. Effects of soy protein on alcoholic liver disease in rats undergoing ethanol withdrawal. J Nutr Biochem. 2012;23:679–684. doi: 10.1016/j.jnutbio.2011.03.016. [DOI] [PubMed] [Google Scholar]
- 6.Darwish HA, Raboh NRA, Mahdy A. Camel’s milk alleviates alcohol-induced liver injury in rats. Food Chem Toxicol. 2012;50:1377–1383. doi: 10.1016/j.fct.2012.01.016. [DOI] [PubMed] [Google Scholar]
- 7.Hosseinzadeh H, Parvardeh S, Asl MN, Sadeghnia HR, Ziaee T. Effect of thymoquinone and Nigella sativa seeds oil on lipid peroxidation level during global cerebral ischemia-reperfusion injury in rat hippocampus. Phytomedicine. 2007;14:621–627. doi: 10.1016/j.phymed.2006.12.005. [DOI] [PubMed] [Google Scholar]
- 8.Arslan SO, Gelir E, Armutcu F, Coskun O, Gurel A, Sayan H, et al. The protective effect of thymoquinone on ethanol-induced acute gastric damage in the rat. Nutr Res. 2005;25:673–680. [Google Scholar]
- 9.Darakhshan S, Pour AB, Colagar AH, Sisakhtnezhad S. Thymoquinone and its therapeutic potentials. Pharmacol Res. 2015;95:138–158. doi: 10.1016/j.phrs.2015.03.011. [DOI] [PubMed] [Google Scholar]
- 10.Mollazadeh H, Hosseinzadeh H. The protective effect of Nigella sativa against liver injury:a review. Iran J Basic Med Sci. 2014;17:958–966. [PMC free article] [PubMed] [Google Scholar]
- 11.Razavi B, Hosseinzadeh H. A review of the effects of Nigella sativa L. and its constituent, thymoquinone, in metabolic syndrome. J Endocrinol Invest. 2014;37:1031–1040. doi: 10.1007/s40618-014-0150-1. [DOI] [PubMed] [Google Scholar]
- 12.Amin B, Taheri M, Hosseinzadeh H. Effects of intraperitoneal thymoquinone on chronic neuropathic pain in rats. Planta Med. 2014;80:1269–1277. doi: 10.1055/s-0034-1383062. [DOI] [PubMed] [Google Scholar]
- 13.Havakhah S, Sadeghnia HR, Mosa-Al-Reza Hajzadeh NM, Roshan SS, Hosseinzadeh H, Mohareri N, et al. Effect of Nigella sativa on ischemia-reperfusion induced rat kidney damage. Iran J Basic Med Sci. 2014;17:986–992. [PMC free article] [PubMed] [Google Scholar]
- 14.Hosseinzadeh H, Taiari S, Nassiri-Asl M. Effect of thymoquinone, a constituent of Nigella sativa L., on ischemia–reperfusion in rat skeletal muscle. Naunyn Schmiedebergs Arch Pharmacol. 2012;385:503–508. doi: 10.1007/s00210-012-0726-2. [DOI] [PubMed] [Google Scholar]
- 15.Hosseinzadeh H, Parvardeh S, Nassiri-Asl M, Mansouri M-T. Intracerebroventricular administration of thymoquinone, the major constituent of Nigella sativa seeds, suppresses epileptic seizures in rats. Med Sci Monit Basic Res. 2005;11:BR106–BR110. [PubMed] [Google Scholar]
- 16.Pourbakhsh H, Taghiabadi E, Abnous K, Hariri AT, Hosseini SM, Hosseinzadeh H. Effect of Nigella sativa fixed oil on ethanol toxicity in rats. Iran J Basic Med Sci. 2014;17:1020–1031. [PMC free article] [PubMed] [Google Scholar]
- 17.Amin B, Hosseinzadeh H. Black cumin (Nigella sativa) and its active constituent, thymoquinone:an overview on the analgesic and anti-inflammatory effects. Planta Med. 2016;82:8–16. doi: 10.1055/s-0035-1557838. [DOI] [PubMed] [Google Scholar]
- 18.Javidi S, Razavi BM, Hosseinzadeh H. A review of neuropharmacology effects of Nigella sativa and its main component, thymoquinone. Phytother Res. 2016;30:1219–1229. doi: 10.1002/ptr.5634. [DOI] [PubMed] [Google Scholar]
- 19.Forouzanfar F, Bazzaz BSF, Hosseinzadeh H. Black cumin (Nigella sativa) and its constituent (thymoquinone):a review on antimicrobial effects. Iran J Basic Med Sci. 2014;17:929–938. [PMC free article] [PubMed] [Google Scholar]
- 20.Ziaee T, Moharreri N, Hosseinzadeh H. Review of pharmacological and toxicological effects of Nigella sativa and its active constituents. J Med Plant Res. 2012;2:16–42. [Google Scholar]
- 21.Hosseinzadeh H, Fazly Bazzaz B, Haghi MM. Antibacterial activity of total extracts and essential oil of Nigella sativa L. seeds in mice. Pharmacologyonline. 2007;2:429–435. [Google Scholar]
- 22.Parvardeh S, Nassiri-Asl M, Mansouri M, Hosseinzadeh H. Study on the anti-convulsant activity of thymoquinone, the major constituent of Nigella sativa L. seeds, through intracerebroventricular injection. J Med Plant Res. 2005;2:45–52. [Google Scholar]
- 23.Hosseinzadeh H, Eskandari M, Ziaee T. Anti-tussive effect of thymoquinone, a constituent of Nigella sativa seeds, in guinea pigs. Pharmacologyonline. 2008;2:480–484. [Google Scholar]
- 24.Woo CC, Kumar AP, Sethi G, Tan KHB. Thymoquinone:potential cure for inflammatory disorders and cancer. Biochem Pharmacol. 2012;83:443–451. doi: 10.1016/j.bcp.2011.09.029. [DOI] [PubMed] [Google Scholar]
- 25.Pourgholamhossein F, Sharififar F, Rasooli R, Pourgholi L, Nakhaeipour F, Samareh-Fekri H, et al. Thymoquinone effectively alleviates lung fibrosis induced by paraquat herbicide through down-regulation of pro-fibrotic genes and inhibition of oxidative stress. Environ Toxicol Pharmacol. 2016;45:340–345. doi: 10.1016/j.etap.2016.06.019. [DOI] [PubMed] [Google Scholar]
- 26.Aycan İÖ, Tüfek A, Tokgöz O, Evliyaoğlu O, Fırat U, Kavak GÖ, et al. Thymoquinone treatment against acetaminophen-induced hepatotoxicity in rats. Int J Surg. 2014;12:213–218. doi: 10.1016/j.ijsu.2013.12.013. [DOI] [PubMed] [Google Scholar]
- 27.Ismail M, Al-Naqeep G, Chan KW. Nigella sativa thymoquinone-rich fraction greatly improves plasma antioxidant capacity and expression of antioxidant genes in hypercholesterolemic rats. Free Radic Biol Med. 2010;48:664–672. doi: 10.1016/j.freeradbiomed.2009.12.002. [DOI] [PubMed] [Google Scholar]
- 28.Kanter M, Coskun O, Uysal H. The antioxidative and antihistaminic effect of Nigella sativa and its major constituent, thymoquinone on ethanol-induced gastric mucosal damage. Arch Toxicol. 2006;80:217–224. doi: 10.1007/s00204-005-0037-1. [DOI] [PubMed] [Google Scholar]
- 29.El Mezayen R, El Gazzar M, Nicolls MR, Marecki JC, Dreskin SC, Nomiyama H. Effect of thymoquinone on cyclooxygenase expression and prostaglandin production in a mouse model of allergic airway inflammation. Immunol Lett. 2006;106:72–81. doi: 10.1016/j.imlet.2006.04.012. [DOI] [PubMed] [Google Scholar]
- 30.Tavakkoli A, Ahmadi A, Razavi BM, Hosseinzadeh H. Black seed (Nigella sativa) and its constituent thymoquinone as an antidote or a protective agent against natural or chemical toxicities. Iran J Pharmac Res. 2017;16:2–23. [PMC free article] [PubMed] [Google Scholar]
- 31.Mehri S, Shahi M, Razavi BM, Hassani FV, Hosseinzadeh H. Neuroprotective effect of thymoquinone in acrylamide-induced neurotoxicity in Wistar rats. IJBMS. 2014;17:1007–1011. [PMC free article] [PubMed] [Google Scholar]
- 32.Niehaus W, Samuelsson B. Formation of malonaldehyde from phospholipid arachidonate during microsomal lipid peroxidation. Eur J Biochem. 1968;6:126–130. doi: 10.1111/j.1432-1033.1968.tb00428.x. [DOI] [PubMed] [Google Scholar]
- 33.Moron MS, Depierre JW, Mannervik B. Levels of glutathione, glutathione reductase and glutathione S-transferase activities in rat lung and liver. Biochim Biophys Acta. 1979;582:67–78. doi: 10.1016/0304-4165(79)90289-7. [DOI] [PubMed] [Google Scholar]
- 34.Hosseinzadeh L, Behravan J, Mosaffa F, Bahrami G, Bahrami A, Karimi G. Curcumin potentiates doxorubicin-induced apoptosis in H9c2 cardiac muscle cells through generation of reactive oxygen species. Food Chem Toxicol. 2011;49:1102–1109. doi: 10.1016/j.fct.2011.01.021. [DOI] [PubMed] [Google Scholar]
- 35.Mallikarjuna K, Chetan PS, Reddy KS, Rajendra W. Ethanol toxicity:Rehabilitation of hepatic antioxidant defense system with dietary ginger. Fitoterapia. 2008;79:174–178. doi: 10.1016/j.fitote.2007.11.007. [DOI] [PubMed] [Google Scholar]
- 36.Husain K, Scott BR, Reddy SK, Somani SM. Chronic ethanol and nicotine interaction on rat tissue antioxidant defense system. Alcohol. 2001;25:89–97. doi: 10.1016/s0741-8329(01)00176-8. [DOI] [PubMed] [Google Scholar]
- 37.Jurczuk M, Brzóska MM, Moniuszko-Jakoniuk J, Gałażyn-Sidorczuk M, Kulikowska-Karpińska E. Antioxidant enzymes activity and lipid peroxidation in liver and kidney of rats exposed to cadmium and ethanol. Food Chem Toxicol. 2004;42:429–438. doi: 10.1016/j.fct.2003.10.005. [DOI] [PubMed] [Google Scholar]
- 38.Scott R, Reddy K, Husain K, Schlorff E, Rybak L, Somani S. Dose response of ethanol on antioxidant defense system of liver, lung, and kidney in rat. Pathophysiology. 2000;7:25–32. doi: 10.1016/s0928-4680(99)00034-6. [DOI] [PubMed] [Google Scholar]
- 39.Hoek JB, Pastorino JG. Ethanol, oxidative stress, and cytokine-induced liver cell injury. Alcohol. 2002;27:63–68. doi: 10.1016/s0741-8329(02)00215-x. [DOI] [PubMed] [Google Scholar]
- 40.Yoon S-J, Koh E-J, Kim C-S, Zee O-P, Kwak J-H, Jeong W-J, et al. Agrimonia eupatoria protects against chronic ethanol-induced liver injury in rats. Food Chem Toxicol. 2012;50:2335–2341. doi: 10.1016/j.fct.2012.04.005. [DOI] [PubMed] [Google Scholar]
- 41.El-Dakhakhny M, Barakat M, El-Halim MA, Aly S. Effects of Nigella sativa oil on gastric secretion and ethanol induced ulcer in rats. J Ethnopharmacol. 2000;72:299–304. doi: 10.1016/s0378-8741(00)00235-x. [DOI] [PubMed] [Google Scholar]
- 42.Girish C, Koner BC, Jayanthi S, Ramachandra Rao K, Rajesh B, Pradhan SC. Hepatoprotective activity of picroliv, curcumin and ellagic acid compared to silymarin on paracetamol induced liver toxicity in mice. Fundam Clin Pharmacol. 2009;23:735–745. doi: 10.1111/j.1472-8206.2009.00722.x. [DOI] [PubMed] [Google Scholar]
- 43.Lu Z-M, Tao W-Y, Zou X-L, Fu H-Z, Ao Z-H. Protective effects of mycelia of Antrodia camphorata and Armillariella tabescens in submerged culture against ethanol-induced hepatic toxicity in rats. J Ethnopharmacol. 2007;110:160–164. doi: 10.1016/j.jep.2006.09.029. [DOI] [PubMed] [Google Scholar]
- 44.Iimuro Y, Gallucci RM, Luster MI, Kono H, Thurman RG. Antibodies to tumor necrosis factor alfa attenuate hepatic necrosis and inflammation caused by chronic exposure to ethanol in the rat. Hepatology. 1997;26:1530–1537. doi: 10.1002/hep.510260621. [DOI] [PubMed] [Google Scholar]
- 45.Esposito E, Cuzzocrea S. TNF-alpha as a therapeutic target in inflammatory diseases, ischemia-reperfusion injury and trauma. Curr Med Chem. 2009;16:3152–3167. doi: 10.2174/092986709788803024. [DOI] [PubMed] [Google Scholar]
- 46.Wu D, Cederbaum AI. Ethanol induced apoptosis to stable HepG2 cell lines expressing human cytochrome P4502E1. Alcohol Clin Exp Res. 1999;23:67–76. [PubMed] [Google Scholar]
- 47.RosséT Olivier R, Monney L, Rager M, Conus S, Fellay I, et al. Bcl-2 prolongs cell survival after Bax-induced release of cytochrome c. Nature. 1998;391:496–499. doi: 10.1038/35160. [DOI] [PubMed] [Google Scholar]
- 48.El-Ghany R, Sharaf N, Kassem L, Mahran L, Heikal O. Thymoquinone triggers anti-apoptotic signaling targeting death ligand and apoptotic regulators in a model of hepatic ischemia reperfusion injury. Drug Discov Ther. 2009;3:296–306. [PubMed] [Google Scholar]
- 49.Nadkarni K, Nadkarni A. Indian Materia Medica. Vol. 1. Bombay, India: Popular Prakashan; 1976. pp. 615–616. [Google Scholar]
- 50.Sayed MD. Traditional medicine in health care. J Ethnopharmacol. 1980;2:19–22. doi: 10.1016/0378-8741(80)90023-9. [DOI] [PubMed] [Google Scholar]
- 51.Lautenbacher L-M. Schwarzkummelol:eine neue quelle ungesattigter fettsauren. Dtsch Apoth Ztg. 1997;137:68–69. [Google Scholar]
- 52.Ali B, Blunden G. Pharmacological and toxicological properties of Nigella sativa. Phytother Res. 2003;17:299–305. doi: 10.1002/ptr.1309. [DOI] [PubMed] [Google Scholar]
- 53.Houghton PJ, Zarka R, de las Heras B, Hoult J. Fixed oil of Nigella sativa and derived thymoquinone inhibit eicosanoid generation in leukocytes and membrane lipid peroxidation. Planta Med. 1995;61:33–36. doi: 10.1055/s-2006-957994. [DOI] [PubMed] [Google Scholar]
- 54.Marsik P, Kokoska L, Landa P, Nepovim A, Soudek P, Vanek T. In vitro inhibitory effects of thymol and quinones of Nigella sativa seeds on cyclooxygenase-1-and-2-catalyzed prostaglandin E2 biosyntheses. Planta Med. 2005;71:739–742. doi: 10.1055/s-2005-871288. [DOI] [PubMed] [Google Scholar]
- 55.El Gazzar M, El Mezayen R, Marecki JC, Nicolls MR, Canastar A, Dreskin SC. Anti-inflammatory effect of thymoquinone in a mouse model of allergic lung inflammation. Int Immunopharmacol. 2006;6:1135–1142. doi: 10.1016/j.intimp.2006.02.004. [DOI] [PubMed] [Google Scholar]
- 56.Badary OA. Thymoquinone attenuates ifosfamide-induced Fanconi syndrome in rats and enhances its anti-tumor activity in mice. J Ethnopharmacol. 1999;67:135–142. doi: 10.1016/s0378-8741(98)00242-6. [DOI] [PubMed] [Google Scholar]
- 57.Hosseinzadeh H, Parvardeh S. Anti-convulsant effects of thymoquinone, the major constituent of Nigella sativa seeds, in mice. Phytomedicine. 2004;11:56–64. doi: 10.1078/0944-7113-00376. [DOI] [PubMed] [Google Scholar]
- 58.Abdel-Fattah A-FM, Matsumoto K, Watanabe H. Anti-nociceptive effects of Nigella sativa oil and its major component, thymoquinone, in mice. Eur J Pharmacol. 2000;400:89–97. doi: 10.1016/s0014-2999(00)00340-x. [DOI] [PubMed] [Google Scholar]
- 59.Halawani E. Anti-bacterial activity of thymoquinone and thymohydroquinone of Nigella sativa L. and their interaction with some anti-biotics. Adv Biol Res. 2009;3:148–52. [Google Scholar]
- 60.Burits M, Bucar F. Antioxidant activity of Nigella sativa essential oil. Phytother Res. 2000;14:323–28. doi: 10.1002/1099-1573(200008)14:5<323::aid-ptr621>3.0.co;2-q. [DOI] [PubMed] [Google Scholar]
- 61.Al-Ghamdi M. The anti-inflammatory, analgesic and antipyretic activity of Nigella sativa. J Ethnopharmacol. 2001;76:45–48. doi: 10.1016/s0378-8741(01)00216-1. [DOI] [PubMed] [Google Scholar]


