

Abstract
Aim
Objective of present study is to determine optimum value of DLG and its validation prior to being incorporated in TPS for Varian TrueBeam™ millennium 120 leaves MLC.
Background
Partial transmission through the rounded leaf ends of the Multi Leaf Collimator (MLC) causes a conflict between the edges of the light field and radiation field. Parameter account for this partial transmission is called Dosimetric Leaf Gap (DLG). The complex high precession technique, such as Intensity Modulated Radiation Therapy (IMRT), entails the modeling of optimum value of DLG inside Eclipse Treatment Planning System (TPS) for precise dose calculation.
Materials and methods
Distinct synchronized uniformed extension of sweeping dynamic MLC leaf gap fields created by Varian MLC shaper software were use to determine DLG. DLG measurements performed with both 0.13 cc semi-flex ionization chamber and 2D-Array I-Matrix were used to validate the DLG; similarly, values of DLG from TPS were estimated from predicted dose. Similar mathematical approaches were employed to determine DLG from delivered and TPS predicted dose. DLG determined from delivered dose measured with both ionization chamber (DLGIon) and I-Matrix (DLGI-Matrix) compared with DLG estimate from TPS predicted dose (DLGTPS). Measurements were carried out for all available 6MV, 10MV, 15MV, 6MVFFF and 10MVFFF beam energies.
Results
Maximum and minimum DLG deviation between measured and TPS calculated DLG was found to be 0.2 mm and 0.1 mm, respectively. Both of the measured DLGs (DLGIon and DLGI-Matrix) were found to be in a very good agreement with estimated DLG from TPS (DLGTPS).
Conclusions
Proposed method proved to be helpful in verifying and validating the DLG value prior to its clinical implementation in TPS.
Keywords: Validation, Dosimetric Leaf Gap, Treatment Planning System, I-Matrix, MLC transmission
1. Background
Varian TrueBeam™ (Varian Medical Systems, Inc., USA) Medical Linear Accelerator highly equipped with self-calibrated and self-controlled dynamic millennium 120 leaf Multi Leaf Collimator (MLC) Chang et al.1 It has Flattening Filter (FF) and Flattening Filter Free (FFF) beam delivery capabilities along with KV/MV and CBCT imaging technique Chan et al. and Kielar et al.1, 2 TrueBeam™ has a rounded end Millennium 120 leaf MLC. MLCs are designed with the inner 5 mm of leaf thickness projected at isocenter covered over the central 20 cm of the field size and the outer 1 cm of leaf thickness covered over the 10 cm on each side of the field size. Since MLC allows the maximum field dimension of 40 cm along the direction of gun to target. MLC types play a major significant role in delivering highly precise conformal external beam radiotherapy. Resolutions of MLC define the quality of the treatment plan Park et al.3 Smaller width of MLC yields target conformity and rapid dose fall outside the target. Dosimetric impact of the rounded end design of MLC on high precession radiation technique such as static, dynamic Intensity Modulated Radiation Therapy (IMRT) and Volumetric Modulated Arc Therapy (VMAT) need to be taken into account. For that dosimetric parameter of MLC such as Leaf Transmission, Leaf Position Offset (LPO), Radiation Field Offset (RFO) and its properties must be considered and fed into the TPS. Such kind of high precision radiation therapy technique relies on the ability of MLC. Increase in the use of these high precession techniques enhanced delivery of high dose per fraction. This leads to concerns in leakage evaluation, which may be due either to interleaf, intraleaf leakage or partial transmission through the round end of the leaf. Parameter account for partial transmission through the end of rounded leaf MLC called Dosimetric Leaf Gap (DLG) Kielar et al. and Szpala et al.2, 4 DLG is also referred to as radiation field offset (RFO) Vial et al.5 It is designed for patients treated with rounded end MLC to improve the accuracy of dose calculation in advanced high precision technique of radiotherapy. Evaluation and verification of various MLC parameters need to be performed while incorporating the high-end technique as IMRT/VMAT in Treatment Planning System (TPS); DLG is one of those parameters. Increase in radiation field size due to transmission through the rounded end of leaf. Fig. 1 provides the pictorial illustration of DLG. That describes how the radiation field cut off at the edge of MLC leaf; however, the partial transmission through the end of MLC leaves remain there. Also, Fig. 1 shows intensity spectra descend rapidly at the edge of MLC leaf and partial intensity liable for DLG decreasing exponentially. Effective radiation field size can be defined mathematically as follows:
Fig. 1.

Pictorial representation of transmission through the rounded end of MLC leaf illustrating that both the optical field size and DLG constitute a radiation field.
IMRT is a complex treatment delivery technique involving numerous objective function & optimization parameters. IMRT first optimizes the objective fluence, and then with the help of leaf motion calculator (LMC) it creates the multiple sequential beamlets and generates segments to convert the objective fluence to the deliverable fluence. The dose delivered through the segment is under the influence of DLG Lee et al.6 In order to commission the techniques like IMRT and VMAT values of DLG inevitable to measure, verify and its optimum values should be incorporate in TPS. Literature shows several theoretical and experimental methods to investigate DLG. It has been proved that, theoretically, the DLG based on a physical leaf position and DLG based on the integral dose method produce different results. DLG value was adjusted in the TPS until agreement was achieved between the measured and predicted dose for IMRT. However, this method was found to be very cumbersome and involved trial and error. Another way to achieve exact value of optimum DLG is from TPS calculated dose and verified by determining DLG based on integral dose measurement. Several studies have been published to determine the DLG, but none of them provides the validation of DLG inside the TPS. We performed this study in the context to determine optimum DLG and validate them with TPS. In order to minimize the dose variation between measured dose and predicted dose in the IMRT/VMAT technique, optimum values of DLG for all available energies were studied and incorporated in TPS.
2. Materials and methods
We divided this study into two sections. First, measurement of DLG with Ionization Chamber as well as Two-Dimensional (2D) Array I-Matrix (IBA Dosimetry, Germany) and second, validation of DLG in Eclipse Treatment Planning System (TPS). Measurement and validation of DLG was performed for Varian TrueBeam™ millennium 120 leaves MLC. Primarily, DLG measurements were independently performed with 0.13cc Semi-flex ionization chamber (IBA Dosimetry, Germany) in water equivalent Acrylic RW3 – 30 × 30 cm3 slab phantom and with 2D array I-Matrix. Source to Chamber Distance (SCD) was kept at 100 cm at depth of measurement 5 cm deeper than the depth of electron contamination on the central axis of the beam in the center of the chamber for slab phantom geometry. Similar geometry was reproduced for 2D-array I-Matrix. Sufficient backscatters were provided below the chamber as well as 2D array I-Matrix. Fig. 2 shows the pictorial representation of measurement setup geometry with a slab phantom and 2D-array I-Matrix.
Fig. 2.

Pictorial representation of measurement geometry. (A, B) Show setup geometry with Ionization chamber in a slab phantom. (C, D) Show setup geometry with 2D array I-Matrix.
2D Array I-Matrix can be used as a secondary verification system for measurement and validation of DLG for TPS Kumaraswamy et al.7 2D Array I-Matrix consists of 1020 air vented ionization chamber with sensitive volume of 0.08 cm3 at water equivalent depth of 3 mm (effective point of measurement) arranged in 32 × 32 grids over the active area of 24.4 × 24.4 cm2. Minimum separation, i.e. spatial resolution, between the center of two neighboring detectors is 7.62 mm. Similar setup geometry was reproduced in both ionization chamber and I-Matrix measurement. DLG are commonly measured with distinct uniformed extension of synchronized dynamic MLC leaf gap sweeping fields. Varian MLC shaper software was used to create such a dynamic MLC sweeping gap field. MLC gap widths of 2 mm, 4 mm, 6 mm, 10 mm, 14 mm, 16 mm, and 20 mm were formed by both opposite leaves and uniformly extended over 10 × 10 cm2 Yao et al. and Timothy Peace Balasingh et al.8, 9 The sweeping gap field moves from -60 mm to +60 mm at a constant speed with respect to MU to deliver dose. To define position of MLC, total number of 10 control points were created spaced one cm apart. The leaves position was defined every 10 mm by a control point. The resulting fluence is uniform within the field size of 10x10 cm2. Uniform extension of MLC leaves produced the uniform dose distribution Yao et al.8 This uniform dose is the function of primary dose, secondary scatter, interleaf, and transmission through the round leaf end of MLC. MLC transmission and dose for all dynamic MLC sweeping gap fields were measured with both ionization chamber and 2D-array I-Matrix. All data measured with I-matrix were analyzed with the help of OmniPro IMRT software (IBA Dosimetry, Germany) version 1.7. Average transmission (RT) for both the bank and meter reading for moving gap field (Rg) was measured. Contribution of average MLC leaf transmission to the gap (RgT) was calculated from given formula Shende et al.10 Methodology described by LoSasso et al.11 was used to determine DLG by fitting a linear function of gap size (g) versus corrected gap reading (Rg′).
| (1) |
Corrected gap reading was calculated from each gap. Corrected gap reading (Rg′) is defined as
The graph was drawn for gap (g) is a linear function of (Rg′). Hence, fit a linear function as
| (2) |
Downward extrapolation of the line intersects at the negative x-axis, value at the point of intersection defined as leaf gap. Fig. 3 shows the movement of dynamic MLC leaf gap width. That describes the MLC leaf maintaining the gap width during the travel.
Fig. 3.

Pictorial representation of the motion of dynamic MLC with leaf gap of 10 mm from right to left.
In order to study verification and validation of DLG and its implementation inside the TPS, initially I-Matrix was scanned under sufficient build-up and backscatter. After that, these computed tomography (CT) series were imported to Eclipse13.5 TPS. Separate single field individual plan for each of the sweeping dynamic MLC gap field was created on those imported CT images to deliver 100 MU retaining constant planned dose rate of 400 MU/mit. Each plan had identical setup geometry, which was analogous to actual plan delivered on the machine. Isocenter was chosen as a point of normalization at fixed depth of 5 cm in the center of the detector plane. Dose calculation was performed with Anisotropic Analytical Algorithm (AAA) and predicted dose at isocenter was recorded for all of the distinct plans made for the distinct dynamic MLC sweeping gap field. Predicted dose at isocenter for each sweeping gap field is a function of DLG. DLG values determined from predicted dose in TPS, where predicted dose was corrected for inter and intra leaf MLC transmission using the above Eqs. (1), (2). Whereas, the transmission was defined as ratio of dose with block MLC field to open MLC field. Similar mathematical approach was used while estimating DLG with measured dose and TPS calculated dose. Fig. 4 is shown in a transverse, frontal, sagittal and beam eye view of 2D array I-Matrix setup geometry of the plan created in TPS.
Fig. 4.

Pictorial representation of Transverse, Frontal, Sagittal planes and beam eye view of 2D array I-Matrix phantom geometry created in TPS.
Values of DLG obtained from TPS predicted dose were compared with actual value of DLG estimated from dose measured with ionization chamber and 2D array I-Matrix. DLG measurement and its validation were accomplished for 6MV, 10MV, 15MV flattened beam and 6MVFFF, 10MVFFF non-flattened beam energies.
3. Results
Table 1 summarizes the results of DLG measurements with ionization chamber DLGIon and 2D array I-Matrix DLGI-Matrix that were compared with calculated DLGTPS from Eclipse TPS for Varian TrueBeamTB millennium 120 leaves MLC along the line that includes the beam central axis and is perpendicular to the direction of leaf travel. To support the objective of the present study, both measurement and validation of DLG were carried out using an identical approach during the whole measurement process, such as measurement setup geometry, generation of dynamic MLC leaf gap width plans and mathematical formulation for calculating DLG. Discrete values of DLG for distinct energies were expected on the basis of fundamental principle of higher energy beam results in higher penetrating power which consequently yield a greater transmission Mullins et al.12 Magnitude of DLGs was found to increase with the increase in beam energy that was analogous to the increase in transmission through the leaf end of MLC. This increase in a measured value of DLG from 6MV low energy to 15MV high-energy beam differed by order of 0.4 mm for FF beam. On the other hand, this difference was found substantially larger between 6MVFFF and 10MVFFF FFF beam by order of 0.7 mm. These differences were found to correspond exactly to calculated DLGTPS obtained from TPS. Fig. 5, Fig. 6 illustrate the variation of DLGs and MLC transmission with respect to beam energy measured with three different techniques, respectively. DLG measured with I-Matrix DLGI-Matrix were found to be slightly larger than that measured with the ionization chamber DLGIon. This overall maximum to minimum DLG variation was found to be 0.2 mm and 0.1 mm, respectively. DLG measured with ionization chamber DLGion were found to closely resemble and be in a relatively good agreement with TPS calculated DLGTPS as compared with DLG measured with 2D array I-Matrix DLGI-Matrix.
Table 1.
Summary of Dosimetric Leaf Gap (DLG) and % MLC transmission measured with 0.3 cc Ion Chamber, 2D array I-Matrix and calculated from TPS, respectively.
| Energy | Measured with 0.13 cc Ion Chamber |
Measured With 2D Array I-Matrix |
Calculated with Eclipse TPS |
|||
|---|---|---|---|---|---|---|
| DLGIon Chamber (mm) | % of MLC transmission | DLGI-Matrix (mm) | % of MLC transmission | DLGTPS (mm) | % of MLC transmission | |
| 6 MV | 2.10 | 2.45 | 2.30 | 1.56 | 2.20 | 1.79 |
| 6 MVFFF | 1.50 | 1.84 | 1.65 | 1.34 | 1.50 | 0.65 |
| 10 MV | 2.40 | 2.85 | 2.50 | 1.84 | 2.40 | 1.98 |
| 10 MVFFF | 2.20 | 2.05 | 2.30 | 1.64 | 2.20 | 0.91 |
| 15 MV | 2.50 | 3.01 | 2.70 | 2.00 | 2.60 | 2.10 |
Fig. 5.

Graphical representation of variation of DLG versus beam energy measured with various methods.
Fig. 6.

Graphical representation of variation of % of MLC transmission versus beam energy measured with various methods.
We observed that the ionization chamber slightly underestimated the value of DLG, whereas 2D array I-Matrix yielded DLGs a bit larger in magnitude. Both ionization chamber and 2D array I-Matrix exhibit a variation of measured DLG values between (±0.2 mm). This difference was caused by variation in MLC transmission measured with the ion chamber and 2D array I-Matrix was part of our study. MLC transmission is quotient of dose with MLC closed field to the without MLC open field. MLC transmission is composed of inter, intra leaf leakage and collimator scatter component. Significant deviation was found between measured MLC transmission and calculated MLC transmission in TPS. This measured MLC transmission was found the largest with the ion chamber, then progressively reduced while the I-Marix measurement was found to be the lowest in TPS. In addition, MLC transmission was found lower in FFF beam than in FF beam. We compared dose distribution measured with I-Matrix and calculated dose distribution from TPS for moving dynamic MLC leaf gap that was processed in Omni-Pro IMRT software. Global gamma value for all the measurements was passed under agreement criteria of 1% Dose Difference (DD) and 1 mm Distance to Agreement (DTA) Gloria & Depuydt.13, 14 Fig. 7 shows the global gamma evaluation between measured dose distribution with 2D array I-Matrix and predicted dose distribution obtained from TPS of 6 MV beam for some of moving dynamic MLC gap of 2 mm, 10 mm and 20 mm gap fields.
Fig. 7.

Representation of global gamma evaluation between fluence measured with 2D array I-Matrix and TPS calculated predicted fluence distribution of 6 MV beam for moving MLC gap of 2 mm, 10 mm and 20 mm (acceptance criteria were defined at 1% DD and 1 mm DTA).
4. Discussion
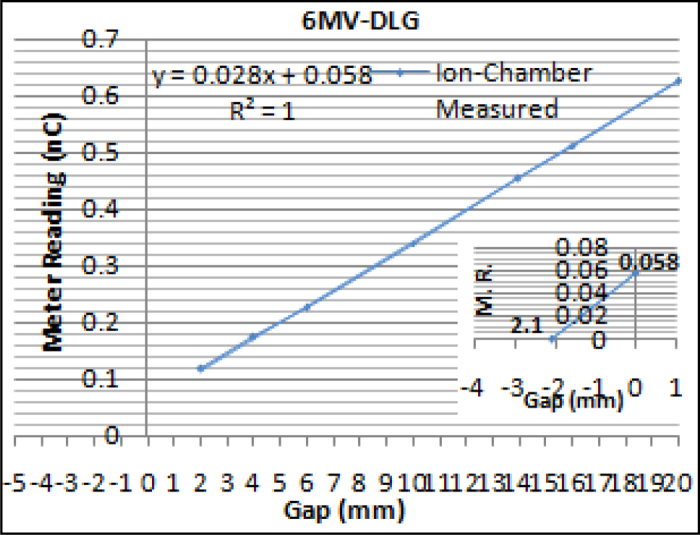
Different techniques for measurement of DLG have been published in many articles LoSasso et al,11 Vial et al.15 and Mei et al.16 It is very essential to validate DLG before implementing in the TPS in order to minimize the variation between planned predicted dose and delivered dose. There are very limited studies available for validation of DLG. Correct modeling of MLC characteristics, such as MLC transmission and DLG, are very crucial to final dose delivery. Due to the complexity of dynamic MLC, a simply measured value of DLG does not provide fair agreement between predicted planned dose and delivered dose. Optimal value of DLG improved dose agreement between predicted and delivered dose by compensating the effect of transmission at the rounded end of MLC leaf and tongue and groove (T&G). This study mainly focused on the validation of DLG in TPS. Therefore, our efforts were aimed at investigating elements that influence optimal values of DLG and factors that minimize the difference in predicted and delivered dose. Fig. 8, Fig. 9, Fig. 10, Fig. 11, Fig. 12, Fig. 13, Fig. 14, Fig. 15, Fig. 16, Fig. 17 demonstrate the graphical representation of linear regression of dose as the function of MLC gap for various energies. Extrapolation of line intersects at the negative X-axis corresponds to non-zero dose and provides the values of DLG Kumaraswamy et al. and Ravindra Shende et al.7, 10 DLG was characterized by its dependence on many measurement parameters such as MLC model, source to surface distance (SSD), Measurement depth, Beam energy, Type of chamber and off-axis distance of MLC Kung et al. and M. R. Arnfield et al.17, 18
Fig. 8.

(A) Graphical representation of linear regression of TPS calculated and I-Matrix measured dose (Rg′) statistic as function of MLC leaf gap for 6 MV. (B) Extrapolation of data shows a nonzero gap width corresponding to nonzero TPS calculated dose defined as DLG. (c) Extrapolation of data shows a nonzero gap width corresponding to nonzero measured I-Matrix dose defined as DLG.
Fig. 9.

(A) Graphical representation of linear regression of TPS calculated and I-Matrix measured dose (Rg’) statistic as function of MLC leaf gap for 6MVFFF. (B) Extrapolation of data shows a nonzero gap width corresponding to nonzero TPS calculated dose defined as DLG. (C) Extrapolation of data shows a nonzero gap width corresponding to nonzero measured I-Matrix dose defined as DLG.
Fig. 10.
(A) Graphical representation of linear regression of ion-chamber measured charge (nC) statistic as function of MLC leaf gap for 6 MV.
Fig. 11.

Graphical representation of linear regression of ion-chamber measured charge (nC) statistic as function of MLC leaf gap for 6 FFFMV.
Fig. 12.

(A) Graphical representation of linear regression of TPS calculated and I-Matrix measured dose (Rg′) statistic as function of MLC leaf gap for 10 MV. (B) Extrapolation of data shows a nonzero gap width corresponding to nonzero TPS calculated dose defined as DLG. (C) Extrapolation of data shows a nonzero gap width corresponding to nonzero measured I-Matrix dose defined as DLG.
Fig. 13.

(A) Graphical representation of linear regression of TPS calculated and I-Matrix measured dose (Rg′) statistic as function of MLC leaf gap for 10 MVFFF. (B) Extrapolation of data shows a nonzero gap width corresponding to nonzero TPS calculated dose defined as DLG. (C) Extrapolation of data shows a nonzero gap width corresponding to nonzero measured I-Matrix dose defined as DLG.
Fig. 14.

Graphical representation of linear regression of ion-chamber measured charge (nC) statistic as function of MLC leaf gap for 10 MV.
Fig. 15.

Graphical representation of linear regression of ion-chamber measured charge (nC) statistic as function of MLC leaf gap for 10 MVFFF.
Fig. 16.

(A) Graphical representation of linear regression of TPS calculated and I-Matrix measured dose (Rg′) statistic as function of MLC leaf gap for 15 MV. (B) Extrapolation of data shows a nonzero gap width corresponding to nonzero TPS calculated dose defined as DLG. (C) Extrapolation of data shows a nonzero gap width corresponding to nonzero measured I-Matrix dose defined as DLG.
Fig. 17.

Graphical representation of linear regression of ion-chamber measured charge (nC) statistic as function of MLC leaf gap for 15 MV.
Leakage transmission through the end of leaf increases with the increase in the beam energy causing an increase in DLG LoSasso et al.11 We measured the MLC transmission as part of our study to determinine DLG by the ionization chamber and 2D array I-Matrix perpendicular to the direction motion of MLC at the center of the field width. MLC transmission consist of several components such as intraleaf, interleaf leakage, effect of beam hardening, head scatter and phantom scatter photon component with both open and closed field. Both MLC transmission and DLG have their own off axis properties, they were greatly affected by intraleaf, interleaf transmission and effect of beam hardening at different locations along the field perpendicular to the direction of moion. Arnfield et al. and Lorenz et al.18, 19 and several other studies shown that MLC transmission vary with off axis distance from the central axis (CAX). This variation is caused by a distinct factor. For example, a path length of a beam through the MLC motion direction increases as off axis distance increases. This causes the variation of the beam spectrum at off-axis distance and by the motion of individual MLC leaf pairs. This effect has a greater influence on FFF beam compared to the respective FF beam. We observerd this effect between FF and FFF beam with the help of 2D-array I-Matrix. Also, the variation in the beam hardening effect was observed along the off-axis with respect to CAX due to the shape of flattening filter in the FF beam. This consquantly results in variation of DLG along the off axis. Removal of the flattening filter causes the softening of beam spectrum Chang et al. and Chang et al.1, 20 in the FFF beam and, consequantly, a drop in MLC transmission results decreases thevalue of DLG for the FFF beam. Also, the FFF beam spectrum are more forward directed at the peak than the lateral side. These effects were observed to be highely prononced in lower energy 6 MVFFF beam compared to 10 MVFFF beam. Hence, variation of DLG was found lower at higher energy FFF beam than lower energy FFF beam with respect to the FF beam. Variability in obtaining the DLG between the ionization chamber and 2D array I-Matrix was due to several factors. Ionization chamber on the central axis does not account for off-axis dose at large distance, whereas, 2D array I-Matrix has multiple detectors with small volume and greater resolution that provides batter response to off-axis dose. Dose impart due to the MLC leaf gap travel, interleaf and intraleaf transmission decreases at faster rate at off-axis distance than at the center Kumaraswamy et al. and Arnfield et al.7, 21 This effect is strongly marked in FFF beam as compared to FF beam. 2D array I-Matrix accounts for this rapid decreases in dose and MLC transmission compared to ionization chamber along the off-axis. Hence, the above results demostrate the DLG obtained with 2D array I-Matrix is slightly higher than with the ionization chamber.
Validation of DLG furnished by employing DLG measured with both the ionization chamber and 2D-array I-Martrix in TPS. Result shows that these values of DLG match very well with TPS calculated DLGTPS within ±0.1 mm. By utilizing these DLG in TPS we found minimal variation between predicted and delivered dose.
5. Conclusions
Author introduced new ways of validating DLG prior to incorporating it inside the TPS. This is the easiest method to investigate and verify optimum DLG that provides very good agreement with IMRT delivered and TPS predicted dose. Our study found that 2D array I-Matrix is a more reliable tool to determine DLG than an ion chamber. I-Matrix takes into account the off-axis transmission as well as tongue and groove effect more precisely than the ion chamber Alfredo.22 2D array I-Matrix can be used as a primary device for DLG measurement. DLG values were found to be dominant in nature and influential for IMRT planning. This provides a practical way to improve agreement between the planned and delivered dose for IMRT planning. User should verify the value of DLG through the process of validation before entering it in TPS. Accurate and optimum DLG minimizes the uncertainty in dose calculation and provides additional confidence for clinical implementation of DLG.
Conflict of interest
None declared.
Financial disclosure
None declared.
Acknowledgement
The author would like to thank to Capitol Hospital, Jalandhar, India and people for their assistance, continuous encouragement and making this work possible.
References
- 1.Chang Z., Wu Q., Adamson J. Commissioning and dosimetric characteristics of TrueBeam system: composite data of three TrueBeam machines. Med Phys. 2012;39:6981. doi: 10.1118/1.4762682. [DOI] [PubMed] [Google Scholar]
- 2.Kielar K.N., Mok E., Hsu A. Verification of dosimetric accuracy on the TrueBeam STx: rounded leaf effect of the high definition MLC. Med Phys. 2012;39:6360. doi: 10.1118/1.4752444. [DOI] [PubMed] [Google Scholar]
- 3.Park J.M., Park S.Y., Kim J.H. The effect of extremely narrow MLC leaf width on the plan quality of VMAT for prostate cancer. Radiat Oncol. 2016;11:85. doi: 10.1186/s13014-016-0664-0. [DOI] [PMC free article] [PubMed] [Google Scholar]
- 4.Szpala S., Cao F., Kohli K. On using the dosimetric leaf gap to model the rounded leaf ends in VMAT/RapidArc plans. J Appl Clin Med Phys. 2014;15:2. doi: 10.1120/jacmp.v15i2.4484. [DOI] [PMC free article] [PubMed] [Google Scholar]
- 5.Vial P., Oliver L., Greer P.B. An experimental investigation into the radiation field. offset of a dynamic multileaf collimator. Phys Med Biol. 2006;51:5517–5538. doi: 10.1088/0031-9155/51/21/009. [DOI] [PubMed] [Google Scholar]
- 6.Lee J.-W., Choi K.-S., Hong Semie. Effects of static dosimetric leaf gap on MLC-based small beam dose distribution for intensity-modulated radiosurgery. J Appl Clin Med Phys. 2007;8:4. doi: 10.1120/jacmp.v8i4.2397. [DOI] [PMC free article] [PubMed] [Google Scholar]
- 7.Kumaraswamy L.K., Schmitt J.D., Daniel W. Spatial variation of dosimetric leaf gap and its impact on dose delivery. Med Phys. 2014;41:111711. doi: 10.1118/1.4897572. [DOI] [PubMed] [Google Scholar]
- 8.Yao W., Farr J.B. Determining the optimal dosimetric leaf gap setting for rounded leaf-end multileaf collimator systems by simple test fields. J Appl Clin Med Phys. 2015;16:4. doi: 10.1120/jacmp.v16i4.5321. [DOI] [PMC free article] [PubMed] [Google Scholar]
- 9.Timothy Peace Balasingh S., Rabi Raja Singh I., Mohamathu Rafic K. Determination of dosimetric leaf gap using amorphous silicon electronic portal imaging device and its influence on intensity modulated radiotherapy dose delivery. J Med Phys. 2015;40:128–135. doi: 10.4103/0971-6203.165072. [DOI] [PMC free article] [PubMed] [Google Scholar]
- 10.Shende R., Gupta G., Patel G. Commissioning of TrueBeam™ medical linear accelerator: quantitative and qualitative dosimetric analysis and comparison of flattening filter (FF) and FLATTENING FILTER FRee (FFF) beam. Int J Med Phys Clin Engi Radiat Oncol. 2016;5:1. [Google Scholar]
- 11.LoSasso T., Chui C.S., Ling C.C. Physical and dosimetric aspects of a multileaf collimator system used in the dynamic mode for implementing intensity modulated radiotherapy. Med Phys. 1998;25:1919–1927. doi: 10.1118/1.598381. [DOI] [PubMed] [Google Scholar]
- 12.Mullins J., DeBlois F., Syme A. Experimental characterization of the dosimetric leaf gap. Biomed Phys Eng Expr. 2016;2(December (6)):065013. [Google Scholar]
- 13.Gloria P. Commissioning measurements for photon beam data on three truebeam linear accelerators, and comparison with trilogy and clinac 2100 linear accelerators. J Appl Clin Med Phys. 2013;14:4077. doi: 10.1120/jacmp.v14i1.4077. [DOI] [PMC free article] [PubMed] [Google Scholar]
- 14.Depuydt T., Van Esch A., Huyskens D.P. A quantitative evaluation of IMRT dose distributions: refinement and clinical assessment of the gamma evaluation. Radiother Oncol. 2002;62:309–319. doi: 10.1016/s0167-8140(01)00497-2. [DOI] [PubMed] [Google Scholar]
- 15.Vial P., Oliver L., Greer P.B. An experimental investigation into the radiation field offset of a dynamic multileaf collimator. Phys Med Biol. 2006;51:5517. doi: 10.1088/0031-9155/51/21/009. [DOI] [PubMed] [Google Scholar]
- 16.Mei X., Nygren I., Villarreal-Barajas J.E. On the use of the MLC dosimetric leaf gap as a quality control tool for accurate dynamic IMRT delivery. Med Phys. 2011;38:2246. doi: 10.1118/1.3567148. [DOI] [PubMed] [Google Scholar]
- 17.Kung J.H., Chen G.T.Y. Intensity modulated radiotherapy dose delivery error from radiation field offset inaccuracy. Med Phys. 2000;27:1617. doi: 10.1118/1.599028. [DOI] [PubMed] [Google Scholar]
- 18.Arnfield M.R., Otto K., Aroumougame V.R. The use of film dosimetry of the penumbra region to improve the accuracy of intensity modulated radiotherapy. Med Phys. 2005;32:12. doi: 10.1118/1.1829246. [DOI] [PubMed] [Google Scholar]
- 19.Lorenz F., Nalichowski A., Rosca F.J. Spatial dependence of MLC transmission in IMRT delivery. Phys Med Biol. 2007;52:5985. doi: 10.1088/0031-9155/52/19/018. [DOI] [PubMed] [Google Scholar]
- 20.Chang Z., Wu Q., Adamson J. Commissioning and dosimetric characteristics of TrueBeam system: composite data of three TrueBeam machines. Med Phys. 2012;39:6981–7018. doi: 10.1118/1.4762682. [DOI] [PubMed] [Google Scholar]
- 21.Arnfield M.R., Siebers J.V., Kim J.O. A method for determining multileaf collimator transmission and scatter for dynamic intensity modulated radiotherapy. Med Phys. 2000;27:2231–2241. doi: 10.1118/1.1312190. [DOI] [PubMed] [Google Scholar]
- 22.Alfredo C.S.R. Optimized removal of the tongue-and-groove underdose via constrained partial synchronization and variable depth recursion. Phys Med Biol. 2009;54:1369–1381. doi: 10.1088/0031-9155/54/5/017. [DOI] [PubMed] [Google Scholar]