Significance
The interactions between ecological and evolutionary processes on the same timescale have been suggested as an important driver for the maintenance of diversity within populations. Nothing is, however, known about how this interaction alters coexistence of species and how coexistence, in return, affects diversity within populations. Here we report an experiment directly testing how and when eco-evolutionary dynamics alter coexistence of competing consumers (predator and parasite) and how coexistence, in return, changes diversity within the shared resource population. We found a switch from diversity at the within-population level to diversity at the species level. Stunningly, these dynamics were mostly driven by indirect interactions and effects that continued for many generations, even after the initial causal process had stopped.
Keywords: eco-evolutionary dynamics, evolving community, rotifer, virus, Chlorella
Abstract
Ecosystems are complex food webs in which multiple species interact and ecological and evolutionary processes continuously shape populations and communities. Previous studies on eco-evolutionary dynamics have shown that the presence of intraspecific diversity affects community structure and function, and that eco-evolutionary feedback dynamics can be an important driver for its maintenance. Within communities, feedbacks are, however, often indirect, and they can feed back over many generations. Here, we studied eco-evolutionary feedbacks in evolving communities over many generations and compared two-species systems (virus–host and prey–predator) with a more complex three-species system (virus–host–predator). Both indirect density- and trait-mediated effects drove the dynamics in the complex system, where host–virus coevolution facilitated coexistence of predator and virus, and where coexistence, in return, lowered intraspecific diversity of the host population. Furthermore, ecological and evolutionary dynamics were significantly altered in the three-species system compared with the two-species systems. We found that the predator slowed host–virus coevolution in the complex system and that the virus’ effect on the overall population dynamics was negligible when the three species coexisted. Overall, we show that a detailed understanding of the mechanism driving eco-evolutionary feedback dynamics is necessary for explaining trait and species diversity in communities, even in communities with only three species.
The entanglement of ecology and evolution has been emphasized in numerous studies (1–6). Controlled laboratory studies showed that ecological and evolutionary processes are often intertwined on one timescale, resulting in feedbacks in which ecology affects evolution and evolution affects ecology (eco-evolutionary feedback). Experimental studies using simple systems with two interacting species showed, for example, that eco-evolutionary dynamics can control the ecological stability and maintenance of phenotypic and genetic diversity within populations (2, 7). With only two interacting species, feedback loops are necessarily immediate and direct. There are, however, more possibilities for eco-evolutionary effects with increasingly more interacting species and populations by changing the potential for rapid adaptive evolutionary responses (8–11) and for direct and indirect species interactions (12).
Indirect feedbacks can occur through density and trait-related changes of the members within the community (13). Density-mediated indirect effects occur when the ecological or evolutionary dynamics of one or more species are driven by a change in the density of other organisms that are not directly interacting (14). In contrast, trait-mediated indirect effects result from evolutionary changes in a heritable trait. Trait-mediated indirect effects occur when the presence of a second species drives evolutionary changes of such a trait, which affects other members of the community as well as their interactions (13, 15). Within the context of eco-evolutionary dynamics, such indirect effects can be key processes, as they can result in cascading effects across trophic levels, resulting in feedbacks between ecology and evolution, often with delays over many generations (12, 16).
Studies on eco-evolutionary dynamics in multispecies and natural communities showed that differentially (locally) adapted genotypes or ecotypes can lead to cascading effects throughout the whole community, eventually altering the functioning and structure of communities (17–19). Whereas these studies clearly show an effect from evolution onto the ecology of the community, they rarely test for a feedback resulting from the altered community to the evolutionary processes. The few studies allowing for such feedback dynamics represent (19), however, only a snapshot of potentially continuous feedback between ecology and evolution, as they consider short timescales of mostly two generations of the focal species. In this regard, potential consequences for ecological and evolutionary processes lasting multiple generations are, so far, overlooked (e.g., apparent competition, extinction or changes in rates or patterns of evolution). Therefore, the underlying mechanisms of eco-evolutionary feedback dynamics and their effects on species interactions in complex systems remain unclear. In addition to studies manipulating natural populations, experimental tests accounting for these multigenerational effects in communities with direct and indirect species interactions are thus critical to understand eco-evolutionary dynamics.
In this study, we have the advantage of using simple laboratory experiments, with which we can measure eco-evolutionary dynamics in a controlled way. Our set-up enabled us to identify and distinguish direct and indirect effects on species interactions over many generations (>100). Specifically, we asked whether and how direct and indirect effects control feedbacks between ecology and evolution, and whether these effects are important for coexistence of multiple species and the pattern and rates of coevolution. We manipulated food web composition in a factorial design with three experimental set-ups: predator–prey or host–virus communities and communities in which predator and virus competed for the same resource (prey = host), with possible indirect effects through apparent competition. For each experimental community, three replicated continuous cultures (chemostats) were started from the same isogenic clone of the asexually reproducing algae Chlorella variabilis (Materials and Methods). After an initial growth period of the algae of 12 days, an asexually reproducing rotifer clone (Brachionus calyciflorus) was added as a predator (predator–prey system), an isogenic strain of a double-stranded DNA virus (Chlorovirus PBCV-1) was added as viral parasite (host–virus system), or both the rotifer and virus were added as competing consumers at the same time (complex system).
We followed the population densities and the evolution of an antipredator defense trait in the prey populations for 90 days (∼100 host generations) and measured coevolution between host and virus at 11 time points (20, 21). Our measures of evolutionary change are based on the notion that evolutionary change in the host or virus population is the result of selection of individuals through variation in fitness associated with a phenotype. The evolutionary change results, then, from differences in birth and death rates of different phenotypes, depending on the prevailing selection, although the underlying genotype of similar phenotypes might differ. Overall, applying a comparative experimental evolution approach allowed us to study all direct and indirect effects of eco-evolutionary dynamics.
Results and Discussion
Predator–Prey System.
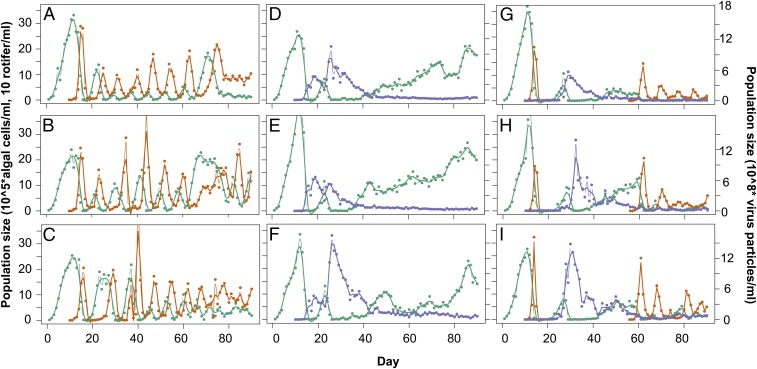
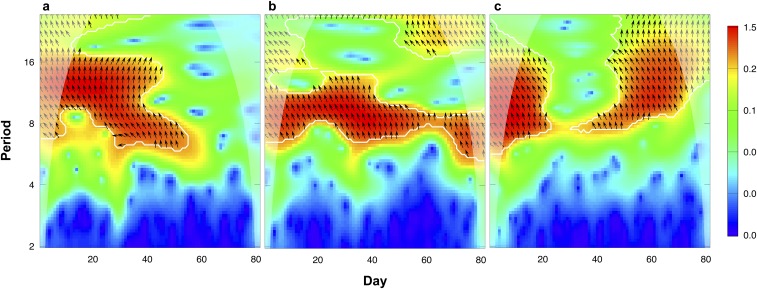
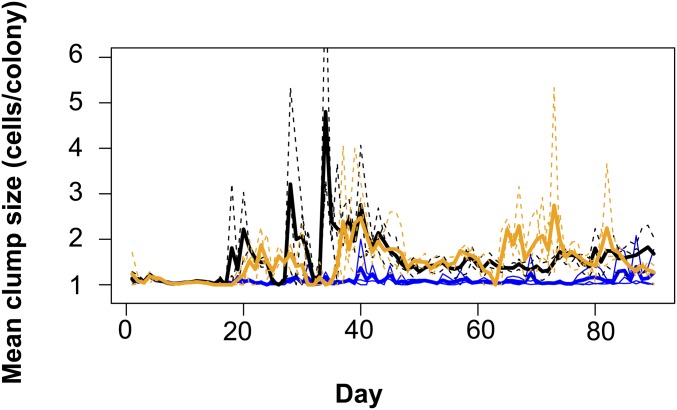
When exploring the population dynamics in the predator–prey systems over time (Fig. 1 A–C), we observed continuous one-quarter-phase lags (0.28 ± 0.1; Methods and Fig. S1) between predator and prey population densities. We tracked the evolution of prey in the predator–prey system by following the evolution of growth in colonies from the ancestral single-celled algae, a key morphological trait in the algal population over time. The evolution of colonies in response to zooplankton grazing has been shown previously in different algal species (7, 22, 23), but we found no notable changes in average colony sizes over time (Fig. S2). It is, however, possible that the algae evolved a different defense against predation by rotifers; for example, by alterations in the cell wall (24). Previous work showed that evolution in the prey population can lead to significant changes in the predator–prey dynamics over time, resulting in a change of phase shifts of predator and prey cycles (2, 25) or in a shift from cyclic to steady-state dynamics (7). When the effect of evolutionary change in the prey would be important in our experiment, we would expect to find consistent and significant deviations from one-quarter-phase shifts between predator and prey densities over time. We used time series analysis of the predator and prey dynamics and observed such a change in only one replicate of the predator–prey dynamics toward the end of the experiment (Fig. 1A and Fig. S1A). For all other time points and for the whole time series of the other two replicates, we observed no deviations from the one-quarter-phase lags (Fig. S1A). Therefore, we conclude that the dynamics were mainly driven by ecology, and evolution played no or only a minor role toward the end of the experiment (25).
Fig. 1.
Population dynamics of predator–prey (A–C), host–virus (D–F), and complex system with host, virus, and predator (G–I). Green, algae; blue, virus; orange, rotifer. (A–C) Predator (rotifer) and prey (algae) show classic predator–prey cycles in which the predatory rotifer lags behind the prey with lag of 0.28 ± 0.1 of a period. (D–F) Host (algae) and virus show initial damped oscillations followed by a more stable period (∼day 45), with algae increasing to high densities and virus decreasing to low densities. (G–I) Predators showed one initial cycle (∼day 15) and went extinct thereafter. The remaining host–virus dynamics oscillated, followed by stabilization (∼day 45). The predator was added again at day 57, and both predator and virus coexisted with the algae and showed cycling population densities with a phase-shift of 0.19 ± 0.1.
Fig. S1.
Phase relations of algae and rotifer populations in predator–prey system. Phase relations were analyzed using cross wavelet analysis to determine coherences in increase and decrease of the interacting populations. Results are shown as counter plots (ordinate: time in days; abscissa: common periodicities in the fluctuations of the populations in days), with low wavelet-power indicated by blue and high wavelet-power by red colors. White contour lines enclose significant regions in the cross wavelet spectrum, and arrows indicate the phase angels between the fluctuations of the driver and response communities. Arrows pointing to the right represent in-phase oscillations (0°), arrows pointing to the top represent phase shifts of a 1/4 of a period, and arrows pointing to the left represent antiphase oscillations (180°). The shaded areas on both sides of the contour plots represent the cone of influence, where edge effects might distort the signal. A–C correspond to Fig. 1 A–C.
Fig. S2.
Mean clump size of algae over time for predator–prey (blue), host–virus (black), and complex (orange) system. Average number of cells per colony was calculated from daily algal population counts. Dashed lines show replicates (n = 3), solid lines show average across replicates. Mean colony size was significantly different between the different food webs (day > 11 after the introduction of the consumers; Kruskal Wallis rank sum test: χ2 = 205; df = 1; P < 2.2 × 10⁻¹⁶), with significant larger colonies in the host–virus and complex system compared with the predator–prey system.
Host–Virus System.
In contrast, the initial damped cycling of populations in the host–virus systems changed to more stable dynamics without cycling (∼day 45). Such change in dynamics suggests evolution was important in the system. Indeed, the population dynamics here were driven by both ecological and evolutionary changes (details discussed in ref. 21). We used time-shift experiments to track coevolution between host and virus by isolating individual host clones from different time points during the experiments and exposing them to virus populations isolated from their relative past and future. This enabled us to estimate when hosts evolved resistance to a particular virus population and when virus evolved to infect previously resistant hosts again. These assays were performed after keeping isolated host clones for multiple generations without the virus, confirming resistance was a heritable trait. We used these data to estimate host resistance range (i.e., the number of virus populations a host is resistant to, calculated for 10 host clones per time point). Further, as host resistance is a heritable phenotype, we used host resistance range to estimate phenotypic diversity in the host population over time. Our diversity estimate is likely an underestimation because different genotypes might produce the same phenotypes, and we only consider 11 time points here.
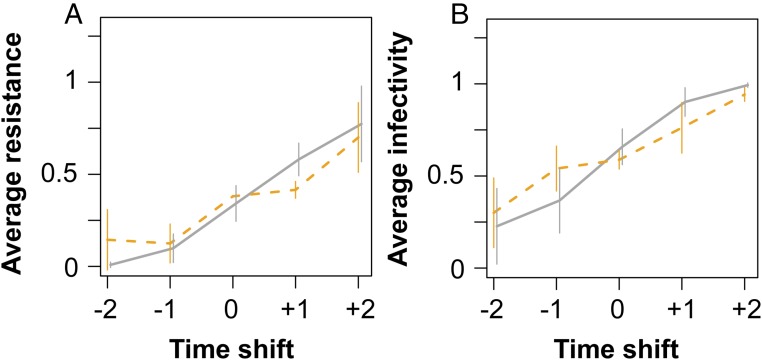
Initial damped population oscillations (Fig. 1 D–F; ∼day 12–45) were the result of rapid coevolution between host and virus. Host and virus coevolved through arms race dynamics (ARD) with increasing resistance and infectivity ranges during this period. Testing resistance of algal host clones against virus revealed the typical pattern for ARD; average resistance against the virus is low for hosts isolated from time points before the virus and high for hosts isolated from future time points relative to the virus (Fig. 2A; linear model, time shift: F1,13 = 103; P = 1.5 × 10⁻⁷). The same pattern was found when examining virus population infectivity evolution (Fig. 2B; linear model, time shift: F1,13 = 79; P = 6.7 × 10⁻⁷).
Fig. 2.
Algae–virus coevolution dynamics in host–virus (black) and complex system (orange). (A) Host resistance evolution for host–virus and complex system showing directional selection for increasing host resistance until the evolution of a general resistance host. Contemporary hosts (0), hosts from one or two time points in the future (+1, +2) and past (−1, −2) were exposed to contemporary virus populations (10 host clones were used from up to seven time points depending when the general resistant host evolved (host–virus systems: days 0, 13, 17, 27, 33, 45 for Fig. 1D; 0, 14, 22, 29, 32 for Fig. 1E; 0, 14, 20, 27, 37, 45, 51 for Fig. 1F; and complex systems: days 0, 17, 25, 31, 37, 45 for Fig. 1G; 0, 14, 27, 39, 45 for Fig. 1H; 0, 14, 25, 31, 39, 45 for Fig. 1I); shown are averages for all time points from three replicate chemostats + SD). (B) Virus evolution shows directional selection for increasing infectivity for host–virus (black) and complex system (orange). Contemporary virus (0), virus populations from one or two time points in the future (+1, +2) and past (−1, −2) were exposed to host clones (10 host clones were used from the same time points as Fig. 1A; shown are averages for all times from three replicate chemostats + SDs).
The host–virus population oscillations stabilized (Fig. 1 D–F; ∼day 45) after several rounds of coevolution through the evolution of a general resistant host. This host could not be infected by any virus coming from past, contemporary, or future time points (Fig. 3A; average host resistance range approaches maximum). A trade-off between host resistance and per capita growth rate (Fig. 3B) maintained diversity in the host population for the rest of the experiment (Fig. 3C), where general resistant hosts coexisted with less resistant hosts (Fig. 3A). A population of virus remained in the chemostats at low numbers, indicating the virus is a stable member of the community consuming the less resistant hosts.
Fig. 3.
Evolution of host resistance range (A), growth-resistance trade-off (B), and host diversity (C) in host–virus (gray/black) and complex system (orange). (A) Average host resistance range (from 10 clones per chemostat and time points) increased over time from susceptible (0 = nonresistant) to maximum (1 = general resistant host), but did not reach 1 as general resistant hosts coexisted together with less resistant host clones. Host resistance range increased significantly different between two systems. Orange boxes represent periods in which predator was present in the complex system. (B) Host per capita growth rate (±SEM) decreased with increasing host resistance range. The trade-off observed in the host–virus (gray) and complex system (orange) was not significantly different (only hosts from days 0–58 for the host–virus and complex system). (C) Average diversity of host resistance ranges over time. Dashed horizontal lines show averages for the period when general resistant host was first detected until day 57 and for the period after the predator was added to the complex system. Host diversity was high in both the host–virus and complex system period before the predator was added, but was significantly reduced after the predator was added to the complex system (n = 3). All error bars show SDs.
Complex System.
In the complex systems in which both consumers were added initially, the predator population went extinct after one initial cycle in all replicates (∼day 16; Fig. 1 G–I) because of a complete niche overlap with the virus. The virus had a fitness advantage, as they could survive at low algal densities (below detection limit), whereas rotifers went extinct as they starved and could not reproduce at the low algae densities. The following host–virus dynamics were relatively similar to the host–virus system, with initial population oscillations resulting from ARD (Figs. 2 and 3A; linear model infectivity: F1,13 = 53, P = 6.1 × 10⁻⁶; linear model resistance: F1,13 = 35, P = 5.7 × 10⁻⁵) followed by stabilization and the evolution of a general resistant host.
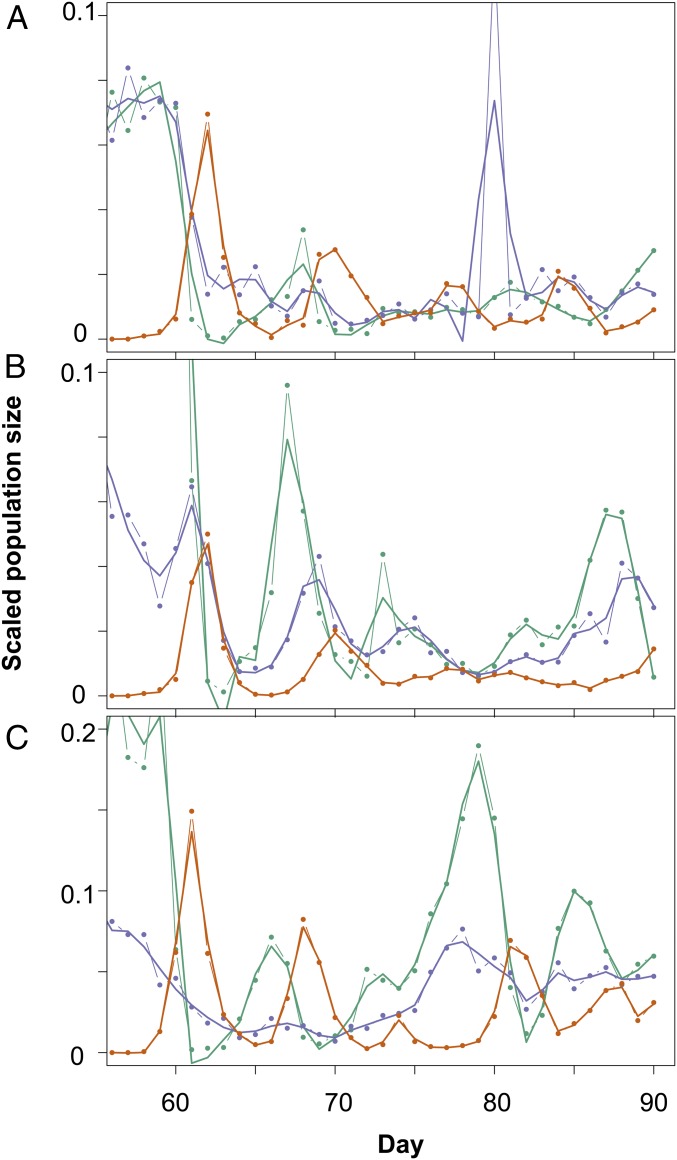
When the population dynamics stabilized after the evolution of the general resistance host, we tested whether the predator would go extinct again or could coexist with the virus and algae. Therefore, we added the predator again to the complex system at day 57 (Figs. 1 G–I and 4). We found that all three species could now coexist, which is unlikely to be attributed to differences in the prey population size at times of inoculation but, rather, to an indirect evolutionary effect. With a population size effect, we would have seen predator extinction in the predator–prey system as well, as prey densities were similar in all chemostats before the addition of the consumers at the start of the experiment.
Fig. 4.
Population dynamics of complex system when host, virus, and predator coexist (day > 57). Population densities are scaled to their maximum; green, algae; blue, virus; orange, rotifers. A–C correspond to Fig. 1 G–I.
Indirect Effects.
During the period when the predator was extinct, a general resistant host evolved and decreased the effect of the virus on the host population size. When reintroducing the predator to the system, the host population could support both consumers. Hence, previous coevolution between host and virus (coevolution-past) indirectly affected coexistence and community structure by reducing the niche overlap between rotifer and virus in accordance with the current theory on coexistence (26).
Although the predators went extinct after one cycle, they affected the ecology of algae and virus until after their extinction. We found that the algal densities in the complex system were reduced to lower densities (below detection limit) compared with those of the host–virus system (∼1,250 cells/mL), which was a direct effect of the presence of predators. Furthermore, even though the predator was extinct, subsequent virus densities reached significantly lower densities in the complex system compared with the host–virus system (t test: comparing maximum virus densities before algal population growth >0 after virus addition, t = 7.75; df = 2; P = 0.016). Thus, the predator had an indirect density-mediated effect on the virus population by reducing its resource.
In addition to direct and indirect effects on ecology, the initial presence of predators also affected the coevolutionary dynamics between algae and virus in the complex system. We found that algal populations in the complex system recovered significantly slower (t test: number of days till algal populations growth >0 after virus addition, t = 4.16; df = 4; P = 0.014). Algal population recovery was only possible because of the evolution of host resistance as all initial hosts from the start of the experiment were susceptible.
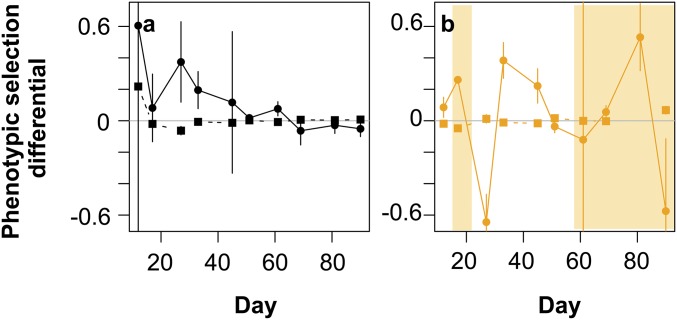
When comparing the evolution of host resistance range in the complex system with that of the host–virus system, we found that host resistance range increased in both the host–virus and complex systems (Fig. 3A; linear model: test host resistance range over time, F1,642 = 484.18; P < 0.001), but was significantly different and delayed in the complex system (Fig. 3A; linear model: F3,642 = 22.059; P < 0.001). The sole past presence of the predator affected the evolutionary dynamics between host and virus indirectly by delaying them in two ways. First, predation-past reduced the host population size. As population size directly determines mutation supply in a population, and resistance evolution was de novo, the slower emergence of potential new adaptive mutations slowed down coevolution, consistent with general theory on evolutionary rescue (27). In addition, resistance mutations that occurred before the addition of the consumer might have been lost or reduced to very low numbers in the complex system as the predator consumed algae irrespectively, whether they are resistant or sensitive to the virus. Second, predation-past decreased the population densities of the virus. As both host and virus densities were decreased, encounter rates between the antagonists were lower and changed selection for resistance (Fig. 2A). This difference was, in particular, apparent at low population sizes of host and virus as selection reversed, favoring lower resistance ranges of the host (for estimates and comparisons of selection strength, see Fig. S3 and Table S1). Overall predation-past slowed down coevolution and caused an indirect eco-evolutionary feedback by altering future population and coevolutionary dynamics lasting multiple generations. Interestingly, the differences in selection over time did not change the overall ARD [Fig. 2; ANOVA for interaction timeshift × treatment (complex or host–virus system) resistance: F1,26 = 3.86, P = 0.06; ANOVA for interaction timeshift × treatment infectivity: F1,26 = 3.27, P = 0.08.
Fig. S3.
Linear (solid lines and circles) and quadratic (dashed lines and squares) selection differentials for host resistance range in host–virus (A) and complex system (B). We estimated phenotypic selection by relating fitness (growth rates in the presence of the contemporary virus population) to host resistance range; that is, we directly measured the fitness advantage or disadvantage of a particular phenotype in the presence of the virus. Thus, estimates of selection are not based on changes in allele frequencies, but they represent the selection pressure posed by the virus upon a particular phenotype. Linear and quadratic selection differentials were estimated from regressions with algal relative fitness measurements from the time shift experiments (algal clone growth in the presence of the contemporary virus) against the clones host-resistance range (1–11). We pooled the three replicates for regression analyses and estimated regression coefficients for each time separately. We then standardized the linear and quadratic regression coefficients by units of phenotypic SDs. We used here all selection differentials independently, whether they were significant or not (Table S1 shows P values and regression coefficients), as we are interested in the time course of these. We compared selection differentials for the period of the ARD dynamics (time points 2–6) and after the evolution of the generalist (time points 7–11), using Student’s t tests or Mann–Whitney Wilcoxon tests, depending on equality of variances within the two systems [complex system: equal variance test, linear F4,4 = 1.06 (P = 0.96); quadratic F4,4 = 0.43 (P = 0.43); host–virus: equal variance test, linear F4,4 = 14.4 (P = 0.02); quadratic F4,4 = 324 (P = 5.6 × 10⁻⁵)]. Negative (positive) linear selection differentials indicate selection for reduced (increased) host resistance range. Negative (positive) quadratic selection differentials indicate selection for reduced (increased) trait variance in host-resistance range. Error bars show SEs for regression coefficients. (A) Host–virus system: We found that selection favored increased host resistance range. Selection coefficients for increased host resistance ranges were, on average, smaller after the evolution of the generalist [Mann–Whitney Wilcoxon test: linear W = 25 (P = 0.008); quadratic: W = 6 (P = 0.22)], and selection was thus on average weaker. (B) Complex system: During the ARD period, selection initially also favored increased resistance, but changed to favoring lower host resistance ranges after the extinction of the predator (day ∼ 17). Only when host and virus population sizes increased after predator extinction (Fig. 1 G–I) did selection shift back to favoring greater host resistance. When all three species coexisted, selection fluctuated between favoring lower and higher host resistance ranges without differences in selection coefficients before and after the evolution of the generalist [Student’s t test: linear: t = 0.35 (P = 0.73); quadratic: t = −1.92 (P = 0.11)].
Table S1.
Results from regression analyses for selection coefficients
| Time point | System | Linear coeffecient and P value | Quadratic coefficient and P value |
| 1 | AV | β = 0.61, t2,27 = 1.02, P = 0.32 | λ = 0.22, t2,27 = 1.02, P = 0.32 |
| 2 | AV | β = 0.08, t2,27 = 0.38, P = 0.71 | λ = −0.02, t2,27 = −0.48, P = 0.64 |
| 3 | AV | β = 0.37, t2,27 = 1.45, P = 0.16 | λ = −0.63, t2,27 = −1.17, P = 0.25 |
| 4 | AV | β = 0.20, t2,27 = 1.66, P = 0.11 | λ = −0.01, t2,27 = −0.36, P = 0.72 |
| 5 | AV | β = 0.12, t2,27 = 2.76, P = 0.01 | λ = −0.01, t2,27 = 2.23, P = 0.03 |
| 6 | AV | β = 0.02, t2,27 = 1.18, P = 0.25 | λ = 0.01, t2,27 = 1.08, P = 0.29 |
| 7 | AV | β = 0.07, t2,27 = 1.7, P = 0.10 | λ = −0.01, t2,27 = −1.32, P = 0.20 |
| 8 | AV | β = −0.06, t2,27 = −0.7, P = 0.49 | λ = 0.01, t2,27 = 0.52, P = 0.61 |
| 9 | AV | β = −0.03, t2,27 = −0.55, P = 0.59 | λ = 0.01, t2,27 = 0.57, P = 0.57 |
| 10 | AV | β = −0.05, t2,27 = −1.03, P = 0.31 | λ = 0.01, t2,27 = 1.15, P = 0.26 |
| 1 | AVR | β = 0.09, t2,37 = 1.34, P = 0.19 | λ = −0.01, t2,27 =−1.34, P = 0.19 |
| 2 | AVR | β = 0.26, t2,27 = 12.49, P = 7.6 × 10⁻¹⁵ | λ = −0.05, t2,27 =−9.94, P = 5.5 × 10⁻¹² |
| 3 | AVR | β = −0.64, t2,27 = 3.65, P = 0.0008 | λ = 0.01, t2,27 = 0.23, P = 0.82 |
| 4 | AVR | β = 0.38, t2,27 = 3.38, P = 0.002 | λ = −0.01, t2,27 =−0.47, P = 0.65 |
| 5 | AVR | β = 0.22, t2,27 = 2.03, P = 0.050 | λ = −0.02, t2,27 = 1.17, P = 0.25 |
| 6 | AVR | β = −0.04, t2,27 = −0.91, P = 0.37 | λ = 0.02, t2,27 = 2.51, P = 0.02 |
| 7 | AVR | β = −0.12, t2,27 = −0.03, P = 0.98 | λ = 0, t2,27 =−0.01, P = 0.99 |
| 8 | AVR | β = 0.06, t2,27 = 1.38, P = 0.18 | λ = −0.01, t2,27 = −0.45, P = 0.66 |
| 9 | AVR | β = 0.53, t2,27 = 2.49, P = 0.017 | — |
| 10 | AVR | β = −0.57, t2,27 = −1.25, P = 0.22 | λ = 0.06, t2,27 = 1.34, P = 0.19 |
β (λ) are linear (quadratic) regression coefficients and statistics for host resistance range and fitness (growth of algal clone in the presence of contemporary virus population). Fitness and host resistance range of 30 clones per time point were used for regression (10 clones × 3 replicates) per system. AV, host–virus; AVR, complex system.
Species and Phenotypic Host Diversity.
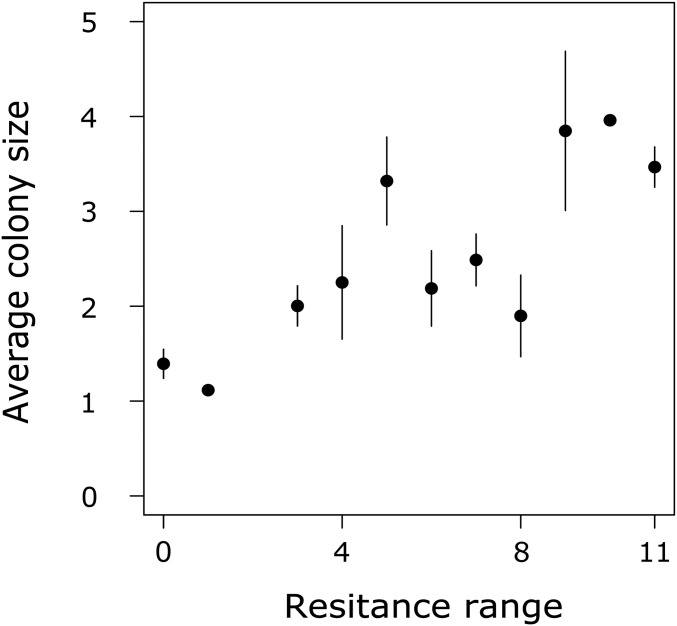
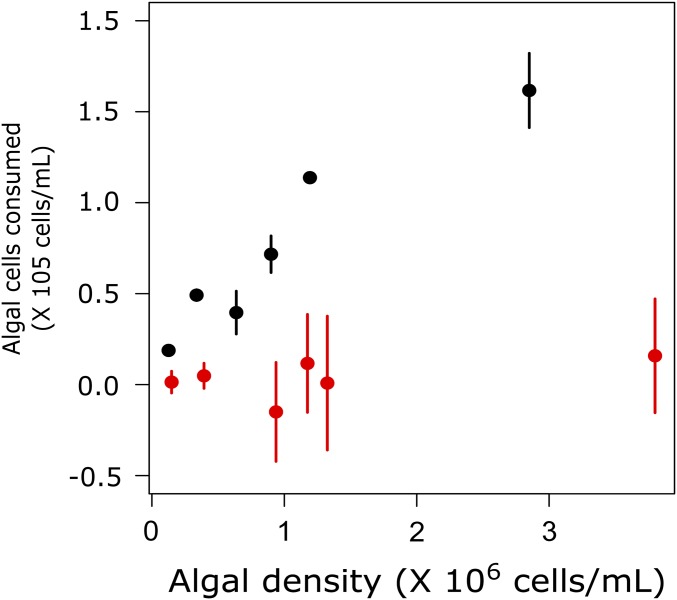
Similar to the host–virus system, a trade-off between host resistance and per capita growth rates evolved in the complex system (not significantly different between the two systems: linear model: F1,346 = 3.56; P = 0.06; Fig. 3B). Here again, the trade-off maintained phenotypic diversity based on host resistance ranges in which the general resistant hosts coexisted with less resistant hosts, but only until the time point at which the predator was added again to the complex system. From this point, host diversity was significantly reduced compared with the host–virus system (Fig. 3C; t test compare host diversity after adding the predator: t = 3.76; df = 21.83; P = 0.001), which resulted from a trait-mediated indirect effect. Specifically, we found that nonresistant hosts grew mainly as single cells, but with increasing resistance ranges, hosts grew in increasingly larger colonies (linear model: F1,68 = 51.5; P < 0.001; Figs. S2 and S4). The filter feeding rotifers consumed general resistant cells (larger colonies) at significantly lower rates than nonresistant host cells (linear model: F1,33 = 45.07; P < 0.001; Fig. S5). Thus, general resistant hosts were simultaneously less vulnerable to predation and the predator selected for the same algal phenotypes as the virus, thereby reducing phenotypic diversity in the host population.
Fig. S4.
Host colony morphology. Average host colony size (of algal hosts used in time-shift experiments between days 0 and 50 coming from one replicate chemostat of host–virus system, number of algal cells per colony ± SEM) increased with increasing host resistance.
Fig. S5.
Predation efficiency on general resistant (colonial) and nonresistant algae (single-celled). Average number of algal cells (±SEM) consumed by rotifers in 24 h. The predator consumed nonresistant algae (black) more efficient then general resistant algae (orange). The number of consumed nonresistant cells increased with increasing algal densities, but almost no general resistant cells were consumed independent of the supplied algal concentration.
Coexistence of the two consumers also had effects on the population dynamics (Figs. 1 G–I and 4). We tested how virus and predator densities and average colony size cycled relative to algal densities (host/prey) by inspecting the time series data when all three species coexisted and by using wavelet-coherence analysis. We found that algae and rotifers cycled with a phase-shift of 0.19 ± 0.1; that is, the maximum in the rotifers occurred ∼1/4 of a period after the maximum in the algae population. Therewith, predator–prey phase-shifts were similar to phase shifts of the predator–prey system (0.28 ± 0.1) and different from the stable dynamics of the host population in the host–virus system after the evolution of the generalist (Fig. 1 D–F). The virus populations’ maxima occurred between the maxima of the algae and the predator in the complex system (algae and virus phase shift: 0.10 ± 0.14) and the maxima of the mean clump size were found just after the maximum in the algae (algae and clump size phase shift: 0.03 ± 0.17); that is, when virus and the rotifer densities started to increase again, the latter increases with a delay.
Conclusions
Our results confirm that eco-evolutionary dynamics can result in cascading effects within food webs (28–30) and that selection of parasitism and predation together shape evolutionary and ecological responses (10, 31–34), which are intertwined on one timescale. Here, however, we go significantly beyond findings of previous studies by disentangling the direct and indirect links between the ecological and evolutionary dynamics. Doing so, we show how direct and indirect effects of predation, predation-past and coevolution-past, have consequences for eco-evolutionary dynamics that only become visible after several generations. Our results support the finding of a recent experimental evolution study, which showed the importance of evolutionary history for invasion success (35). Importantly, we demonstrate that indirect density and trait-mediated effects are crucial for our understanding of the maintenance of diversity, as we observed here a shift from trait diversity maintained within the host population (host resistance phenotypes) to diversity at the species level (coexistence of predator and prey) through complex eco-evolutionary dynamics. Predation-past altered selection on hosts and coevolution between host and virus, and subsequent coevolution affected coexistence of the virus and predator. Thus, the consequences and type of indirect effects (trait- and density mediated) changed over time as a result of the continuous evolving food web, showing that even in a food web with only three interacting species, predicting the eco-evolutionary dynamics and feedbacks represents a major challenge. Interestingly, the virus did not have a major effect on the dynamics of the host and predator when the three species coexisted, as algae and predator were cycling in a similar way as the predator–prey system. Coexistence of multiple consumers was, however, at the cost of phenotypic diversity within the algal population. Thus, understanding eco-evolutionary dynamics through direct and indirect species interactions, and the underlying mechanisms, is essential to understand community structure and diversity.
Materials and Methods
Chemostat Cultures.
Continuous flow-through experimental systems consisted of 500-mL glass bottles containing 400 mL sterile Bold’s basal medium, where nitrate was replaced by ammonium chloride. Sterile air and medium were supplied continuously at a rate of 10% per day. The cultures were maintained at 20 °C with continuous light and were mixed by stirring. One isogenic clone of Chlorella variabilis (strain NC64A) was used to start all chemostat cultures. As such, all evolutionary changes observed in this study are a result of de novo adaptations. For each experimental system, the isogenic consumers (predator, virus or both) were added at day 12 in three replicated chemostat cultures (per treatment). Purified and concentrated virus was used to inoculate the chemostats. Predators were added from a stock culture containing asexual rotifers (Brachionus calyciflorus) with Chlorella variabilis as resource. The rotifers were cleaned from algae before adding to the chemostats by filtering and starving overnight.
Population Dynamics.
Samples for assessing population densities were taken daily using standard sterile methods. Algal and rotifer densities were enumerated in live samples (7, 21). Samples for assessing virus densities were filtered through a 0.45-μm cellulose syringe filter, the filtrate fixed with 1:100 glutaraldehyde and stored at −80 °C after freezing in liquid nitrogen. Virus densities were counted by flow cytometry (21, 36).
Time-Shift Experiments.
Time-shift experiments were performed as described in Frickel et al. (21). Briefly, during experiments, algal and virus samples were stored (algae: agar plates, virus: at 4 °C after filtering through 0.45 μm cellulose filter). From each chemostat, 11 time points were used to perform time-shift experiments (corresponding to the data points in Fig. 2A). Per time point, 10 random algal clones were picked from the agar plates and cultured in batch culture. Each algal clone was diluted to equal densities and challenged to the virus population (virus densities diluted to a MOI of 0.01 particles per algal cell, four technical replicates per combination) from each time point separately [11 time points × 10 algal clones per time point × 11 virus populations = 1,210 combinations per chemostat; note that for one replicate of the complex system, only 10 time points were used for the virus, as virus concentrations were too low for the time shift (time point 2, day 14)] in 96-well plates. Growth rates of algae exposed to the virus were calculated on the basis of OD measurements after 0 and 72 h. Resistant algal clones should have similar growth rates to the controls, where host clones grew without the addition of virus, susceptible algal clones should have zero or negative growth; that is, they could not successfully replicate in the presence of this particular virus. Because the experimental system requires assays in liquid cultures and measuring optical densities and zero growth is difficult to detect (e.g., because the lysed cells still absorb some light), we assessed whether the algal clones were resistant or susceptible to a particular virus population through comparing the mean growth rate plus two SDs of four technical replicates to the mean growth rate minus two SDs of the control. If the virus treatment value was smaller than the control, the algal clone was considered susceptible to this particular virus population. If the virus treatment value was greater or equal to the control, these algae were considered resistant to this particular virus population (Fig. S6 for an example). Growth rates of susceptible clones were on average close to zero or negative [susceptible: 0.035 ± 0.058; resistant: 0.180 ± 0.049 (mean ± SD)]. We further confirmed for a subset of clones that a growth rate close to zero means virus production, whereas the growth rates similar to the control without the virus means virus production (Fig. S6).
Fig. S6.
Growth rates and virus production of susceptible and resistant algal clones. (A) Growth rates (±two SDs of four technical replicates) of three susceptible (gray) and resistant algal clones (blue) in the absence (−) and presence (+) of contemporary virus populations (see Time-Shift Experiments for details). (B) Virus concentrations at the end of the time shift experiment (72 h) and the initial virus concentration that was used to start the time-shift experiments (light blue). The number of virus particles increased when virus was exposed to susceptible algal clones (gray, clones a–c; Wilcoxon rank sum test: W = 63.5; P value = 0.03704). The number of virus particles decreased significantly when virus was exposed to resistant clones (blue, clones d–f; Wilcoxon rank sum test: W = 0; P value = 0.005099) presumably as a result of adsorption of virus to the algal host without successful infections. Horizontal lines represent mean, points technical replicates.
Data Analysis.
Data analyses were performed in Rstudio (37) and R (38), using the lme4 package (39). Algal population recovery was compared between systems by assessing the number of days until first positive growth of algae after virus addition and performing Student’s t test after verifying equality of variances (F2,2 = 0.75; P = 0.86). Maximum virus densities during this period were compared between algae–virus and complex system after testing equality of variances (F2,2 = 7.74; P = 0.0029), and performing a Student t test corrected for unequal variances. Differences in average infectivity (resistance) of virus (host) when exposed to hosts (virus) from past, the same, and future time points were tested using linear models with time point (−2, −1, 0, 1, 2) and treatment (host–virus or complex system) as factors. Host resistance range was calculated as to how many virus populations (0–11) the host was resistant to and was calculated for each host clone used in the time-shift experiment (10 host clones per time point). The average host resistance range (of 10 clones and three replicates) was then normalized to a maximum of 1 (1 = all host clones are resistant to all 11 virus populations; general resistant host). A linear model was used to investigate host resistance range evolution over time in the host–virus and complex system. Average host resistance range (of three chemostats for the host–virus and complex system) was used as response, with three polynomial terms fitted for time point (continuous) and experimental system as a factor (host–virus or complex system).
Previous work showed a trade-off between host resistance range and growth rates in the host–virus system (21). We tested for a similar trade-off between growth and host resistance in the complex system and looked for significant differences in trade-off between the two systems. The analysis was limited to hosts from time points before the predator was added for a second time in the complex system. We used a linear model with host growth rate as a response and tested for a correlation with host resistance range (continuous variable) and tested for a different trade-off between experimental systems (factor: host–virus or complex system).
Shannon index was calculated as a measure of diversity for the same time points used in the time-shift experiment (based on the host resistance range of 10 host clones per time point). Diversity (after the evolution of a general resistant host) between the two systems was compared before and after the predator was added a second time after testing and verifying equality of variance [equality of variance, before predator: F5,5 = 1.92 (P = 0.49); after predator, F11,11 = 1.19 (P = 0.78)].
We assessed the average colony size of each host clone by counting average colony size (number of cells per colony) of host clones used in the time-shift experiments until the general resistant host evolved (in one host–virus chemostat replicate, 10 host-clones per time point). We tested for a correlation between host resistance and average colony size, using a linear model. To test for morphological differences of algae in the predator–prey system, the average colony size of algae was calculated from daily population-density counts and compared among the predator–prey, host–virus, and complex systems. We used Kruskal-Wallis rank sum tests, as variances across treatments were unequal.
We used wavelet coherence analysis (40) to determine phase shifts of algae, virus, and rotifer populations, as well as mean colony size within one chemostat, using the R package WaveletComp (41). Following standard time-series analysis practices, we used detrended [pracma package (42)] and smoothed time-series data [spline function in R (38), see Figs. S7 and S8 for time-series]. This method allows measuring the local correlation between two nonstationary time series over a specific period. Significances of phase-shifts were assessed by testing the null hypothesis that phase relations are not relevant at a certain time of the time-series by using a simulation algorithm representing white noise [default methods in the WaveletComp package (40)]. We used this method to detect significant phase shifts between the algae and rotifers in the predator–prey system (days 9–90) and between algae, rotifers, virus, and mean clump size in the algae-virus system (days 57–90). We extracted all phase angles located within significant regions of the cross-wavelet spectra but outside the cone of influence.
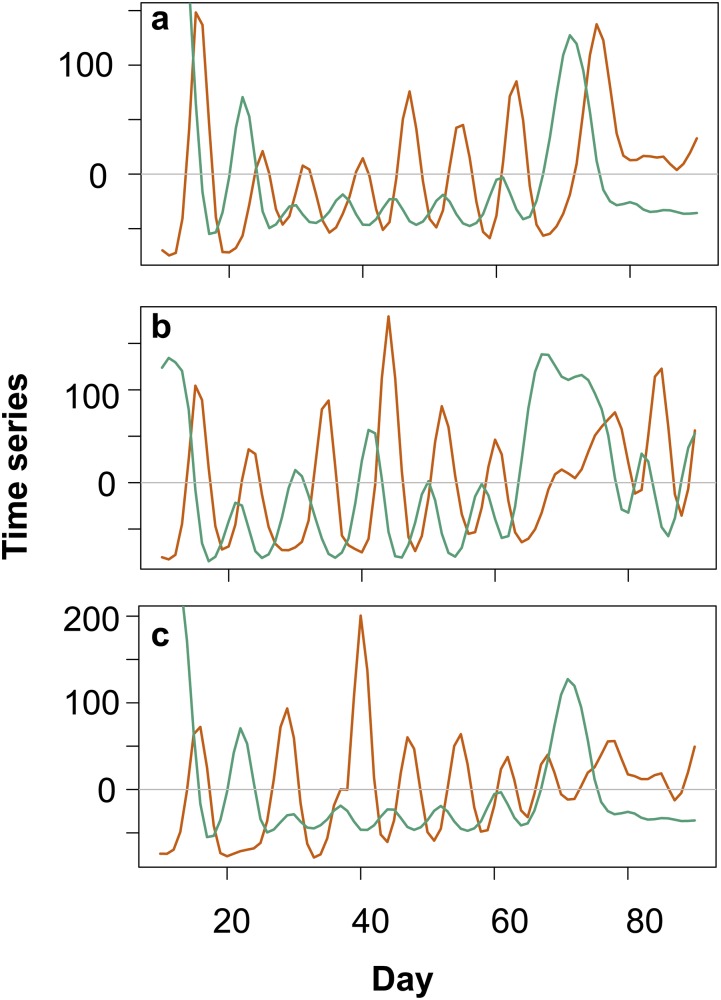
Fig. S7.
Detrended and smoothed time-series data used for wavelet coherence analyses for predator–prey system. Green, algae; orange, rotifers. Scales are arbitrarily for presentation purposes. For population sizes, see Fig. 1 A–C.
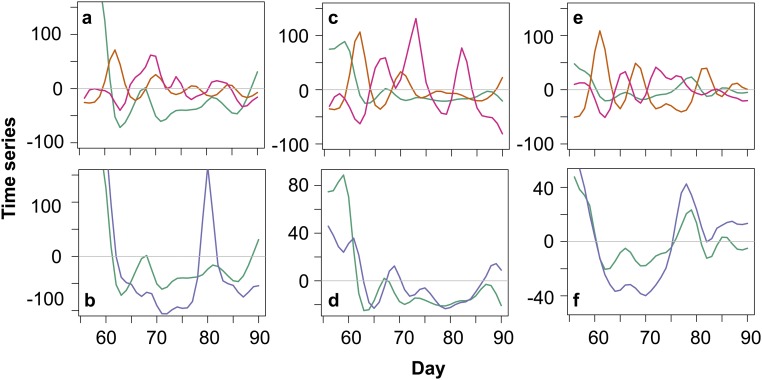
Fig. S8.
Detrended and smoothed time series data used for wavelet coherence analyses for complex system when algae, virus, and predator coexist (day > 57). Green, algae; orange, rotifers; blue, virus; pink, mean colony size. (A and B) Correspond to Fig. 1G; (C and D) correspond to Fig. 1H; (E and F) correspond to Fig. 1I. Time series from one replicate are split into two panels for representation purposes.
Rotifer Ingestion Rates.
To test the efficiency by which rotifers consumed the general resistant and nonresistant host cells, the number of cells consumed by predators was assessed over six concentrations of algal cells (from 1.3 to 3.8 ×10⁶ cells/mL). For each concentration, five rotifers were added to 1 mL algae in 24-well plates (three replicates per algal concentrations), and three replicates of the same concentration served as control (no rotifers added). We then calculated the number of cells consumed after 24 h by comparing algal densities of controls with algal densities in the rotifer containing wells. For all tests, algae were diluted in BBM without ammonium chloride to minimize algal growth over the course of 24 h. A linear model was used to test differences in number of algae consumed over the different concentrations between general resistant and nonresistant hosts.
Acknowledgments
We thank James Van Etten for providing us with the algal and virus cultures, J. Haafke for helping with the data collection, and C. Eizaguirre, P. Feulner, and T. Hiltunen for commenting on an earlier version of the manuscript. This work was supported by an Emmy Noether Grant from the German Research Foundation (Grant BE 4135/3-1 to L.B.).
Footnotes
The authors declare no conflict of interest.
This article is a PNAS Direct Submission. D.E.D. is a guest editor invited by the Editorial Board.
This article contains supporting information online at www.pnas.org/lookup/suppl/doi:10.1073/pnas.1701845114/-/DCSupplemental.
References
- 1.Thompson JN. Rapid evolution as an ecological process. Trends Ecol Evol. 1998;13:329–332. doi: 10.1016/s0169-5347(98)01378-0. [DOI] [PubMed] [Google Scholar]
- 2.Yoshida T, Jones LE, Ellner SP, Fussmann GF, Hairston NG., Jr Rapid evolution drives ecological dynamics in a predator-prey system. Nature. 2003;424:303–306. doi: 10.1038/nature01767. [DOI] [PubMed] [Google Scholar]
- 3.Fussmann GF, Loreau M, Abrams PA. Eco-evolutionary dynamics of communities and ecosystems. Funct Ecol. 2007;21:465–477. [Google Scholar]
- 4.Schoener TW. The newest synthesis: Understanding the interplay of evolutionary and ecological dynamics. Science. 2011;331:426–429. doi: 10.1126/science.1193954. [DOI] [PubMed] [Google Scholar]
- 5.Pelletier F, Garant D, Hendry AP. Eco-evolutionary dynamics. Phil Trans R Soc B. 2009;364:1483–1489. doi: 10.1098/rstb.2009.0027. [DOI] [PMC free article] [PubMed] [Google Scholar]
- 6.Koch H, Frickel J, Valiadi M, Becks L. Why rapid, adaptive evolution matters for community dynamics. Front Ecol Evol. May 20, 2014 doi: 10.3389/fevo.2014.00017. [DOI] [Google Scholar]
- 7.Becks L, Ellner SP, Jones LE, Hairston NG., Jr Reduction of adaptive genetic diversity radically alters eco-evolutionary community dynamics. Ecol Lett. 2010;13:989–997. doi: 10.1111/j.1461-0248.2010.01490.x. [DOI] [PubMed] [Google Scholar]
- 8.Johnson MTJ, Stinchcombe JR. An emerging synthesis between community ecology and evolutionary biology. Trends Ecol Evol. 2007;22:250–257. doi: 10.1016/j.tree.2007.01.014. [DOI] [PubMed] [Google Scholar]
- 9.Strauss SY, Irwin RE. Ecological and evolutionary consequences of multispecies plant-animal interactions. Annu Rev Ecol Evol Syst. 2004;35:435–466. [Google Scholar]
- 10.Friman VP, Buckling A. Effects of predation on real-time host-parasite coevolutionary dynamics. Ecol Lett. 2013;16:39–46. doi: 10.1111/ele.12010. [DOI] [PubMed] [Google Scholar]
- 11.Ellner SP, Becks L. Rapid prey evolution and the dynamics of two-predator food webs. Theor Ecol. 2011;4:133–152. [Google Scholar]
- 12.Walsh MR, DeLong JP, Hanley TC, Post DM. A cascade of evolutionary change alters consumer-resource dynamics and ecosystem function. Proc R Soc Lond B. 2012;279:3184–3192. doi: 10.1098/rspb.2012.0496. [DOI] [PMC free article] [PubMed] [Google Scholar]
- 13.Walsh MR. The evolutionary consequences of indirect effects. Trends Ecol Evol. 2013;28:23–29. doi: 10.1016/j.tree.2012.08.006. [DOI] [PubMed] [Google Scholar]
- 14.Miller TE, Travis J. The evolutionary role of indirect effects in communities. Ecology. 1996;77:1329–1335. [Google Scholar]
- 15.Wootton JT. The nature and consequences of indirect effects in ecological communities. Annu Rev Ecol Syst. 1994;25:443–466. [Google Scholar]
- 16.Strauss SY. Ecological and evolutionary responses in complex communities: Implications for invasions and eco-evolutionary feedbacks. Oikos. 2014;123:257–266. [Google Scholar]
- 17.Bassar RD, et al. Direct and indirect ecosystem effects of evolutionary adaptation in the Trinidadian guppy (Poecilia reticulata) Am Nat. 2012;180:167–185. doi: 10.1086/666611. [DOI] [PubMed] [Google Scholar]
- 18.Harmon LJ, et al. Evolutionary diversification in stickleback affects ecosystem functioning. Nature. 2009;458:1167–1170. doi: 10.1038/nature07974. [DOI] [PubMed] [Google Scholar]
- 19.Matthews B, Aebischer T, Sullam KE, Lundsgaard-Hansen B, Seehausen O. Experimental evidence of an eco-evolutionary feedback during adaptive divergence. Curr Biol. 2016;26:483–489. doi: 10.1016/j.cub.2015.11.070. [DOI] [PubMed] [Google Scholar]
- 20.Gaba S, Ebert D. Time-shift experiments as a tool to study antagonistic coevolution. Trends Ecol Evol. 2009;24:226–232. doi: 10.1016/j.tree.2008.11.005. [DOI] [PubMed] [Google Scholar]
- 21.Frickel J, Sieber M, Becks L. Eco-evolutionary dynamics in a coevolving host-virus system. Ecol Lett. 2016;19:450–459. doi: 10.1111/ele.12580. [DOI] [PubMed] [Google Scholar]
- 22.Boraas ME, Seale DB, Horton JB. Resource competition between 2 rotifer species (Brachionus rubens and B. calyciflorus)–An experimental test of a mechanistic model. J Plankton Res. 1990;12:77–87. [Google Scholar]
- 23.Fisher RM, Bell T, West SA. Multicellular group formation in response to predators in the alga Chlorella vulgaris. J Evol Biol. 2016;29:551–559. doi: 10.1111/jeb.12804. [DOI] [PubMed] [Google Scholar]
- 24.Yoshida T, Hairston NG, Jr, Ellner SP. Evolutionary trade-off between defence against grazing and competitive ability in a simple unicellular alga, Chlorella vulgaris. Proc Biol Sci. 2004;271:1947–1953. doi: 10.1098/rspb.2004.2818. [DOI] [PMC free article] [PubMed] [Google Scholar]
- 25.Hiltunen T, Hairston NG, Jr, Hooker G, Jones LE, Ellner SP. A newly discovered role of evolution in previously published consumer-resource dynamics. Ecol Lett. 2014;17:915–923. doi: 10.1111/ele.12291. [DOI] [PubMed] [Google Scholar]
- 26.Chesson P. Mechanisms of maintenance of species diversity. Annu Rev Ecol Syst. 2000;31:343–366. [Google Scholar]
- 27.Orr HA, Unckless RL. The population genetics of evolutionary rescue. PLoS Genet. 2014;10:e1004551. doi: 10.1371/journal.pgen.1004551. [DOI] [PMC free article] [PubMed] [Google Scholar]
- 28.Post DM, Palkovacs EP, Schielke EG, Dodson SI. Intraspecific variation in a predator affects community structure and cascading trophic interactions. Ecology. 2008;89:2019–2032. doi: 10.1890/07-1216.1. [DOI] [PubMed] [Google Scholar]
- 29.Urban MC, Skelly DK. Evolving metacommunities: Toward an evolutionary perspective on metacommunities. Ecology. 2006;87:1616–1626. doi: 10.1890/0012-9658(2006)87[1616:emtaep]2.0.co;2. [DOI] [PubMed] [Google Scholar]
- 30.Bolnick DI, et al. Why intraspecific trait variation matters in community ecology. Trends Ecol Evol. 2011;26:183–192. doi: 10.1016/j.tree.2011.01.009. [DOI] [PMC free article] [PubMed] [Google Scholar]
- 31.Gotanda KM, et al. Adding parasites to the guppy-predation story: Insights from field surveys. Oecologia. 2013;172:155–166. doi: 10.1007/s00442-012-2485-7. [DOI] [PubMed] [Google Scholar]
- 32.Jousimo J, et al. Disease ecology. Ecological and evolutionary effects of fragmentation on infectious disease dynamics. Science. 2014;344:1289–1293. doi: 10.1126/science.1253621. [DOI] [PubMed] [Google Scholar]
- 33.Duffy MA, Sivars-Becker L. Rapid evolution and ecological host-parasite dynamics. Ecol Lett. 2007;10:44–53. doi: 10.1111/j.1461-0248.2006.00995.x. [DOI] [PubMed] [Google Scholar]
- 34.Toor J, Best A. Evolution of host defense against multiple enemy populations. Am Nat. 2016;187:308–319. doi: 10.1086/684682. [DOI] [PubMed] [Google Scholar]
- 35.Faillace CA, Morin PJ. Evolution alters the consequences of invasions in experimental communities. Nat Ecol Evol. 2016;1:0013. doi: 10.1038/s41559-016-0013. [DOI] [PubMed] [Google Scholar]
- 36.Brussaard CPD. Optimization of procedures for counting viruses by flow cytometry. Appl Environ Microbiol. 2004;70:1506–1513. doi: 10.1128/AEM.70.3.1506-1513.2004. [DOI] [PMC free article] [PubMed] [Google Scholar]
- 37.Rstudio 2014 R-studio: Integrated Development Environment for R, Version 3.1.2. Available at http://www.rstudio.com/. Accessed October 24, 2014.
- 38.R Core Team 2017 R: A language and environment for statistical computing. Available at https://www.R-project.org/. Accessed March 6, 2017.
- 39.Bates D, Maechler MBB, Walker S. 2014 lme4: Linear Mixed-Effects Models Using Eigen and S4. R package Version 1.1-7. Available at CRAN.project.org/package=lme4%3E. Accessed May 5, 2016.
- 40.Torrence C, Compo GP. A practical guide to wavelet analysis. Bull Am Meteorol Soc. 1998;79:61–78. [Google Scholar]
- 41.Roesch A, Schmidbauer H. 2014 WaveletComp: Computational Wavelet Analysis. R package Version 1.0. Available at https://CRAN.R-project.org/package=WaveletComp. Accessed May 5, 2016.
- 42.Borchers HW. 2017 pracma: Practical Numerical Math Functions. R package Version 1.9.9. Available at https://CRAN.R-project.org/package=pracma. Accessed January 11, 2017.


