Significance
RNA polymerase II (RNAPII) not only transcribes protein coding genes and many noncoding RNA, but also coordinates transcription and RNA processing. This coordination is mediated by a long C-terminal domain (CTD) of the largest RNAPII subunit, which serves as a binding platform for many RNA/protein-binding factors involved in transcription regulation. In this work, we used a hybrid approach to visualize the architecture of the full-length CTD in complex with the transcription termination factor Rtt103. Specifically, we first solved the structures of the isolated subcomplexes at high resolution and then arranged them into the overall envelopes determined at low resolution by small-angle X-ray scattering. The reconstructed overall architecture of the Rtt103–CTD complex reveals how Rtt103 decorates the CTD platform.
Keywords: RNA polymerase II, CTD, structural biology, transcription, Rtt103
Abstract
RNA polymerase II contains a long C-terminal domain (CTD) that regulates interactions at the site of transcription. The CTD architecture remains poorly understood due to its low sequence complexity, dynamic phosphorylation patterns, and structural variability. We used integrative structural biology to visualize the architecture of the CTD in complex with Rtt103, a 3′-end RNA-processing and transcription termination factor. Rtt103 forms homodimers via its long coiled-coil domain and associates densely on the repetitive sequence of the phosphorylated CTD via its N-terminal CTD-interacting domain. The CTD–Rtt103 association opens the compact random coil structure of the CTD, leading to a beads-on-a-string topology in which the long rod-shaped Rtt103 dimers define the topological and mobility restraints of the entire assembly. These findings underpin the importance of the structural plasticity of the CTD, which is templated by a particular set of CTD-binding proteins.
The C-terminal domain (CTD) of the largest subunit of RNA polymerase II (RNAPII) consists of multiple tandem repeats (26 in yeast, 52 in humans) of the heptapeptide consensus Tyr1-Ser2-Pro3-Thr4-Ser5-Pro6-Ser7, which is highly conserved from yeast to human (1–3). The CTD serves as a binding platform for many RNA/protein-binding factors involved in the regulation of the transcription cycle (1, 3). Yeast are inviable if the CTD is trimmed to less than 11 repeats of the heptapeptide consensus (4) or if the periodicity of two repeats is perturbed (5), suggesting the importance of both the CTD length and its repetitiveness.
The CTD interaction network is regulated by posttranslational modifications of the CTD, which yield specific phosphorylation and subsequent factor-binding patterns in coordination with the transcription cycle (the “CTD code”) (1, 6–11). Phosphorylations at Y1, S2, T4, S5, and S7 are the most common and well-studied posttranslational modifications of the CTD (12). Mass spectrometry studies of the CTD showed that the CTD heptads are homogeneously phosphorylated along the entire length of the domain in proliferating yeast and human cells (13, 14). Major phosphorylation sites are S2 and S5, whereas Y1, T4, and S7 are minor phosphorylation sites (13, 14), but all sites are important for transcription regulation and proper functioning of the cell. On average, each CTD heptad is phosphorylated once and the occurrence of two phosphorylations per repeat is a rare event (13, 14). The coimmunoprecipitation of specific CTD phosphoisoforms revealed distinct functional sets of factors (CTD-interactome) related to each CTD phosphoisoform (15).
The CTD has no well-defined 3D structure and, therefore, is not observed in the crystal structures of RNAPII (16–19) and forms fuzzy densities on electron microscopy images (20, 21). Nevertheless, the first structural information of the unbound CTD has recently been reported in the fruit fly (22, 23), where it was shown that the CTD forms a compact random coil and that its phosphorylation induces a modest extension and stiffening of the CTD (22, 23).
Current structural knowledge of interactions between the CTD and its recognition factors is based on short peptides mimicking the CTD bound to given CTD binding factors (1, 19, 24). However, the atomic-level structural architecture of the full-length CTD modulated by associated factors remains unknown. Several studies attempted to propose a structural model for the full-length CTD. For example, in the complex of the CTD peptide with the CTD-interacting domain (CID) of Pcf11, a subunit of cleavage factor IA (25), the CTD heptad was found to adopt a β-turn conformation (26). Therefore, a compact, left-handed, β-spiral model of the CTD was proposed (26). A β-spiral conformation would allow the CTD chain with a length of 100 Å to fold into a compact structure, which corresponds to the observed densities in low-resolution electron microscopy images of RNAPII (20). The heterodimer composed of the human proteins RPRD1A and RPRD1B was found to bind the CTD, thereby stimulating the recruitment and phosphatase activity of RPAP2 (pS5-CTD-phosphatase) (27). These findings led to the proposal of a model in which the CTD and accessory molecules form a high-order arrangement dubbed the “CTDsome” (27).
To probe the CTDsome architecture experimentally, we set out to apply integrative structural biology methods and investigate how the termination factor Rtt103 decorates the sequence of the CTD. First, we independently solved high-resolution structures of stable subunits by solution NMR spectroscopy (NMR) and X-ray crystallography. Then, we corroborated the obtained structural information with small-angle X-ray scattering (SAXS) data to reconstruct the overall architecture of the Rtt103–CTD complex. We show that Rtt103 contains a coiled-coil domain that mediates Rtt103 dimerization and uses its N-terminal CID to read adjacent repetitive phosphorylation marks on the CTD independently of one other. Our reconstruction demonstrates how Rtt103 explores the repetitiveness and length of the CTD sequence while keeping the entire arrangement partially flexible.
Results
Limited Proteolysis of Rtt103 Reveals a Coiled-Coil Domain That Mediates Dimerization.
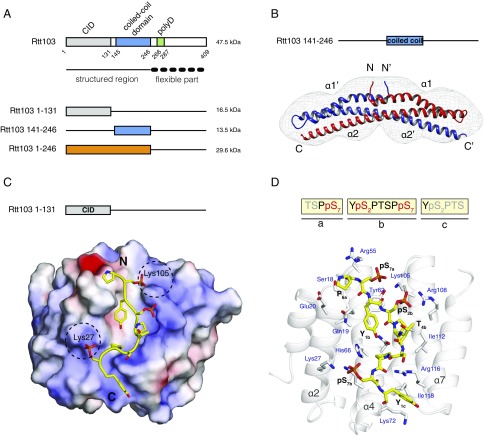
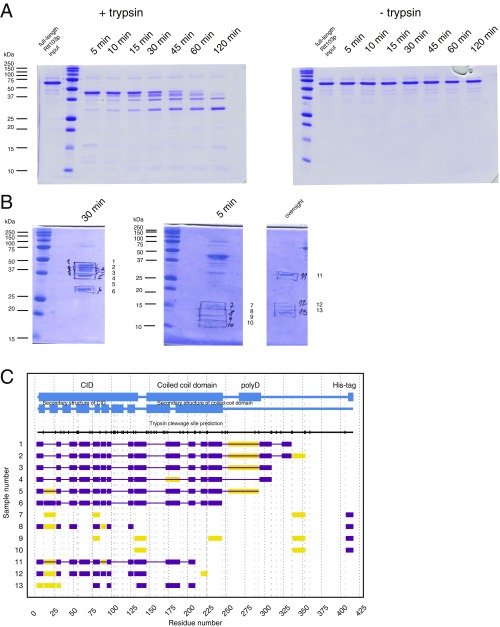
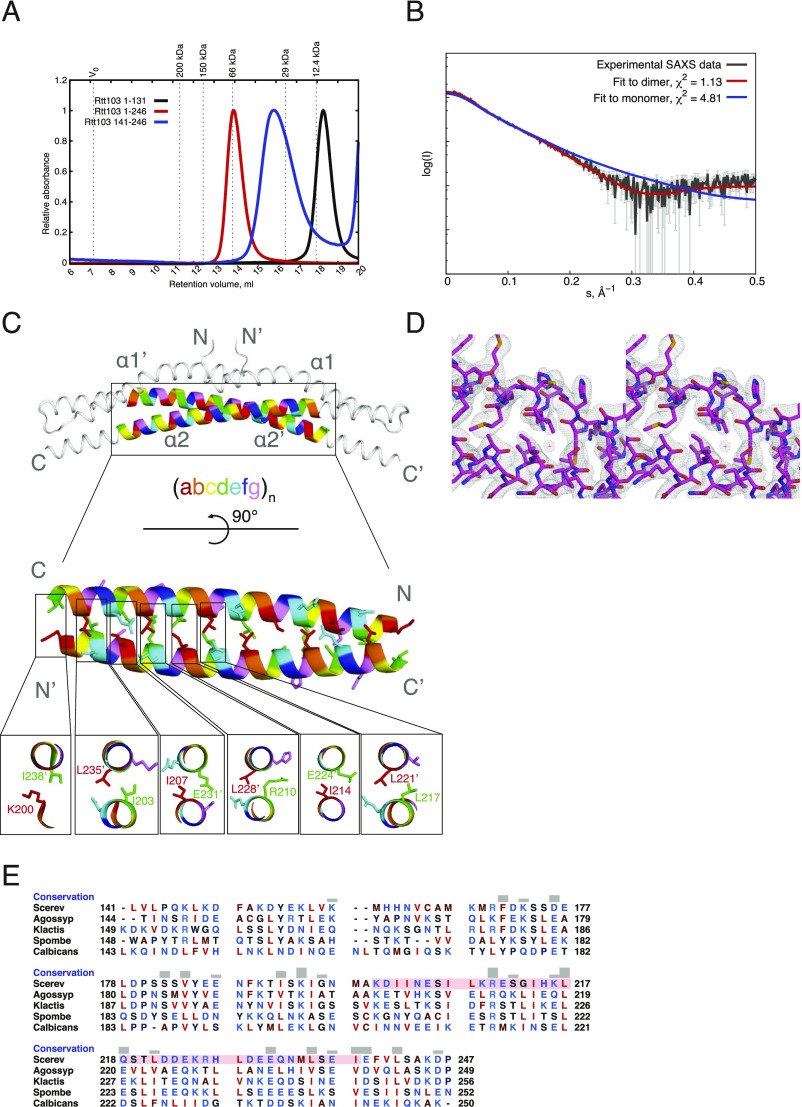
In our divide-and-conquer approach, we first identified the overall domain organization of Rtt103. Trypsin digestion of the full-length Rtt103 coupled with mass spectrometry revealed that the protein fragment harboring amino acid residues 1–246 (Rtt1031–246) is protected from proteolytic cleavage (Fig. 1A and Fig. S1). The remaining C-terminal part of Rtt103 (amino acid residues 247–409) was efficiently digested by trypsin, suggesting the absence of additional structured domains (Fig. 1A and Fig. S1). Subsequent biochemical characterization of the identified stable constructs revealed that Rtt103141–246 and Rtt1031–246 form homodimers (Fig. S2 A and B). Subsequent crystallization screens of the Rtt103141–246 and Rtt1031–246 constructs showed that only the Rtt103141–246 construct formed well-diffracting crystals. The structure of Rtt103141–246 was determined to a resolution of 2.6 Å (Tables S1 and S2). We found that each Rtt103141–246 subunit consists of two α-helices, namely the α1-helix (Gln146-Glu177) with a small bend in the middle and a long α2-helix of ∼105 Å in length (Val184-Asp246) (Fig. 1B). In the crystal, two protein chains form a dimer where the α2-helices are arranged in an antiparallel fashion (Fig. 1B). This architecture of the dimer is in agreement with findings from gel filtration experiments (Fig. S2A) and SAXS data (Fig. S2B). Importantly, the central region of the α2-helix (Lys200-Ile238) contains a coiled-coil signature, which is arranged in trans in the antiparallel dimer assembly of the two Rtt103 molecules. The coiled-coil domain contains a characteristic knobs-into-holes packing with mixed “a” and “d” layers (Fig. S2C), with an average pitch of 172 Å (defined by CCCP; ref. 28). The dimer structure is also stabilized by multiple intermolecular (Asp149-Lys152, Asp153-Lys216, Lys168-Asp172, Asp223-Arg226) and intramolecular (Lys200-Glu239, Glu231-Arg210-Glu224) salt bridges. Altogether, the key findings regarding Rtt103 architecture are as follows: (i) Rtt103 contains a coiled-coil domain that follows the CID and (ii) the C-terminal half of the Rtt103 is disordered.
Fig. 1.
Dimerization and RNAPII CTD recognition by Rtt103. (A) Scheme of Rtt103 domain organization (Upper). The numbers below the scheme represent borders of the amino acid segments. Structured and flexible regions were determined based on the limited proteolysis study (Fig. S1). The recombinant protein constructs used in the study, along with their respective molecular masses, are shown (Lower). CID, CTD-interacting domain; polyD, polyaspartate stretch. (B) Crystal structure of the Rtt103141–246 coiled-coil domain shown superimposed with an ab initio model (gray mesh) derived using DAMMIN (40) from SAXS scattering data. The two different polypeptide chains of the coiled-coil dimer are shown in red and blue; their respective N- and C-termini, as well as α-helices, are indicated. (C) Electrostatic surface representation of the Rtt103 CID (electropositive in blue, electronegative in red, neutral in white) in complex with the pS2pS7-CTD peptide (yellow sticks; PDB ID code: 5M9D). The N- and C-termini of the peptide are indicated. Dashed black circles indicate electropositive areas that accommodate pS7 residues. (D) Detailed view of the Rtt103 CID (gray cartoons) bound to the pS2pS7-CTD peptide (yellow sticks). Highlighted Rtt103 CID residues (gray sticks, blue labels) form hydrophobic contacts and putative hydrogen bonds with the pS2pS7-CTD peptide (yellow sticks, black labels). The sequence of the peptide used for structure determination is indicated above; residues that showed interaction with the Rtt103 CID are shown in black and red.
Fig. S1.
Evaluation of Rtt103 structure by limited proteolysis. Trypsin digestion of Rtt103, which was recombinantly expressed in E. coli and purified to homogeneity, revealed a stable protein fragment of ∼30 kDa. The remaining C-terminal part (amino acids 247–409) was efficiently digested. (A) Limited proteolysis study of the Rtt103 visualized on 18% SDS/PAGE. Sample of Rtt103 with addition of trypsin protease (+trypsin, Right) and the negative control (−trypsin, Left); 5, 10, 15, 30, 45, 60, 120 min time points; molecular mass standards from Precision Plus Protein, Bio-Rad. (B) Image of 18% SDS/PAGE with samples from A subjected to the subsequent MALDI-MS/MS analysis. The number of the sample is indicated on the Right. (C) Summary of the results of the MALDI-MS/MS analysis. The sample number indicated on the Right corresponds to the number given on B. Blue boxes indicate the domain organization of Rtt103 and known α-helical regions. Black vertical serifs continued as dashed vertical gray lines indicate predicted trypsin cleavage sites. Purple boxes indicate peptides detected by trypsin digestion. Yellow boxes indicate peptides detected with low signal. Horizontal purple line indicates the presumed span of Rtt103 fragment present in the gel bands.
Fig. S2.
Study of the Rtt103 coiled-coil domain. (A) Size-exclusion chromatography analysis of recombinant Rtt103 truncation constructs. A Superdex 200 10/300 GL column was used. Void volume (V0), retention volumes, and molecular masses of the protein standards are indicated at the top (gray dashed lines). (B) Evaluation of Rtt103141–246 experimental SAXS scattering data (black) against theoretical scattering data pertaining to the monomer (blue) and dimer (red) structures derived by CRYSOL (42). (C) Crystal structure of the Rtt103141–246 coiled-coil domain with the characteristic coiled-coil region (defined by SOCKET software; ref. 58). The residues that form the “knobs-into-holes” packing are highlighted according to the position in the classical coiled-coil heptad (abcdefg). The zoom of the cross-sections from selected residues is shown at Lower. Respective N- and C-termini, as well as α-helices, of two polypeptide chains are indicated. (D) Stereoview of the coiled-coil domain electron density map (2Fo−Fc density map contoured at 1.0 σ; gray mesh). (E) Multiple sequence alignment of the dimerization domain region in Rtt103 homologs (S. cerevisiae, Q05543; A. gossypii, AAL081Cp; K. lactis, KLLA0C10758p; S. pombe, CAA21273.1; C. albicans, CaO19.7662). Residues are colored according the hydrophobicity index. Alignment prepared in ClustalX (59), visualized in UCSF Chimera (57). The coiled-coil region of S. cerevisiae Rtt103 is indicated in pink.
Table S1.
Data collection and phasing for the structure of the construct Rtt103141–246
| Data collection | Peak | Inflection | High-energy remote | Low-energy remote |
| Space group | F4123 | F4123 | F4123 | F4123 |
| Cell dimensions | ||||
| a, b, c, Å | 217.14, 217.14, 217.14 | 217.14, 217.14, 217.14 | 217.14, 217.14, 217.14 | 217.14, 217.14, 217.14 |
| α, β, γ, ° | 90, 90, 90 | 90, 90, 90 | 90, 90, 90 | 90, 90, 90 |
| Wavelength | 0.979 | 0.9792 | 0.9713 | 0.9919 |
| Resolution, Å | 63.18–2.65 (2.74–2.65) | 63.18–2.65 (2.74–2.65) | 63.09–2.60 (2.69–2.60) | 54.54–2.59 (2.70–2.59) |
| Rsym, % | 15.8 (192) | 16.1 (187) | 35 (485) | 21.6 (306) |
| I / σI | 23.2 (2.0) | 25.9 (2.4) | 21.6 (1.3) | 21.9 (1.7) |
| Completeness, % | 99.9 (99.3) | 99.9 (99.2) | 100 (99.9) | 100 (99.9) |
| Redundancy | 27.8 | 37.0 | 46.8 | 29.7 |
Values in parentheses are for highest-resolution shell.
Table S2.
Refinement statistics for the structure of the construct Rtt103141–246
| Data collection | Refinement statistics |
| Resolution, Å | 48.55–2.59 |
| No. reflections | 14,127 |
| Rwork/Rfree | 0.246/0.260 |
| No. atoms | 978 |
| Protein | 935 |
| Water | 43 |
| B factors | |
| Protein | 59.81 |
| Water | 46.12 |
| rmsds | |
| Bond lengths, Å | 0.021 |
| Bond angles, ° | 0.463 |
The Rtt103 CID Binds the Extended pS2-pS7-CTD Peptide.
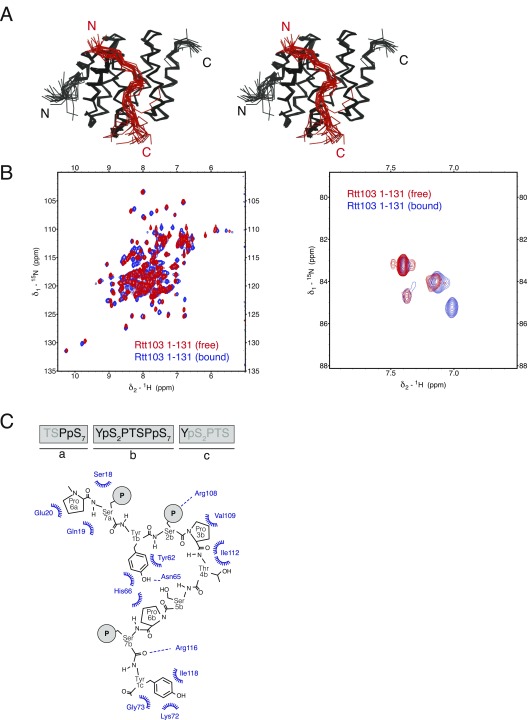
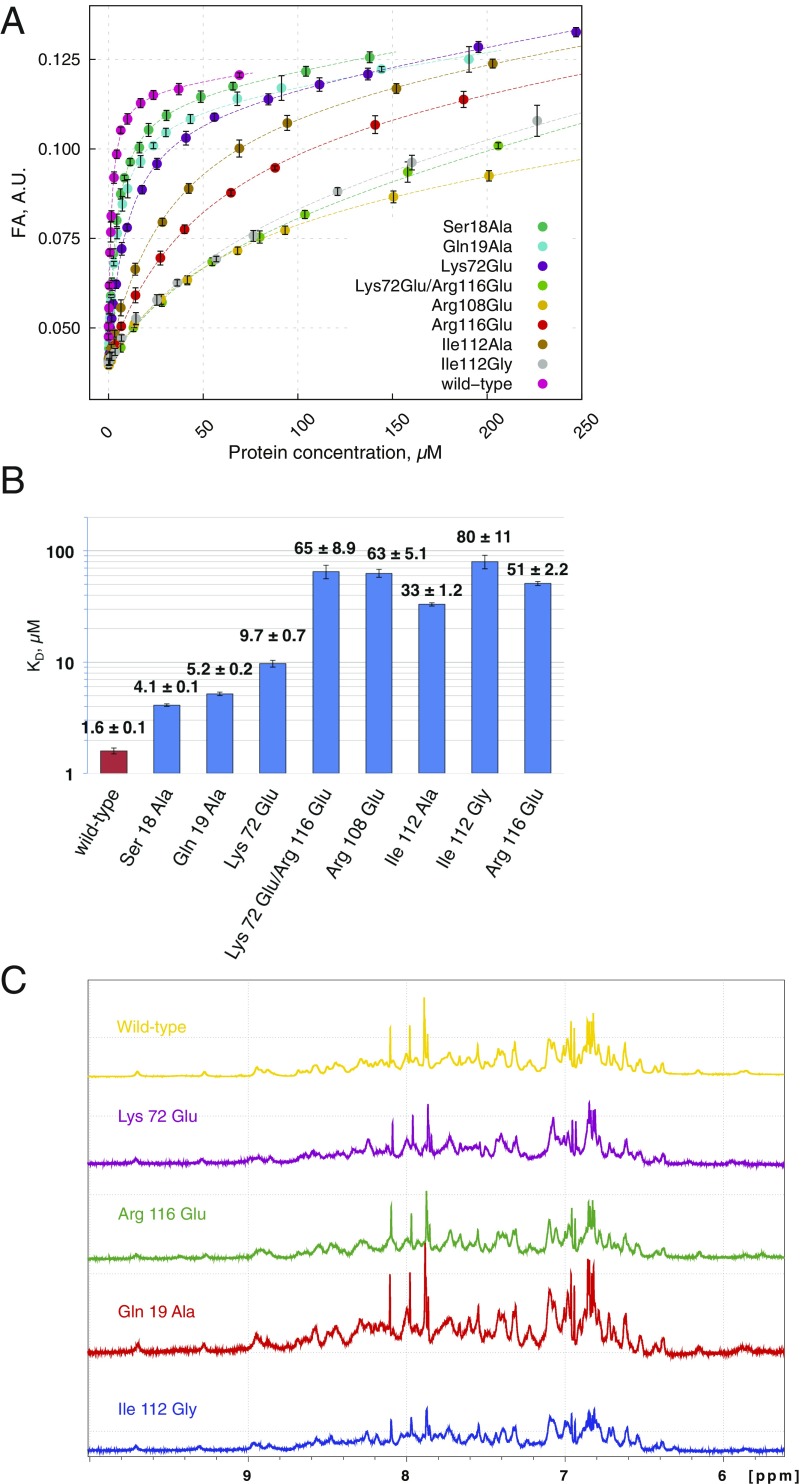
The structure of Rtt1031–131 (or CTD-interacting domain; CID) bound to a short Ser2-phosphorylated CTD moiety has previously been reported (29). Here, we used NMR to determine the structure of Rtt1031–131 bound to a longer CTD substrate (Ser2/7-phosphorylated; Tables S3 and S4), which revealed that the recognition interface of the CID is, in fact, larger than previously reported (29). Our NMR structure of Rtt1031–131 bound to the extended TSPpS7 YpS2PTSPpS7 YpS2PTS peptide (termed pS2pS7-CTD) confirmed the previously reported observation regarding the recognition of the upstream region of pS2pS7-CTD, and further revealed information regarding the recognition of the downstream region of pS2pS7-CTD (Fig. 1 C and D). The structure of Rtt103 CID is formed by eight α-helices in a right-handed superhelical arrangement. The NMR data show that the pS2pS7-CTD peptide binds at the conserved surface formed by helices α2, α4, and α7 of the Rtt103 CID (Fig. 1D and Fig. S3). NMR revealed intermolecular contacts between Rtt1031–131 and the residues P6a, pS7a, Y1b, pS2b, P3b, T4b, S5b, and Y1c of the pS2pS7-CTD peptide. Specifically, P6a lies in the proximity of the hydrophobic area formed by the N-terminal tip of the α2-helix, being involved in multiple intermolecular contacts with Ser18, Gln19, and Glu20. Residue Y1b is also docked into a hydrophobic pocket (Ile22, Tyr62) and stabilized by a hydrogen bond between its hydroxyl group and the side-chain amide group of Asn65. Residue P3b forms hydrophobic interactions with Val109 and Ile112. Residues pS2bP3bT4bS5b form a β-turn stabilized by hydrogen bonds between the pS2b carbonyl and the S5b amide, between the pS2b γ-oxygen and T4b amide, and between the pS2b phosphate and T4b hydroxyl. Perturbation of the above-described hydrophobic pocket (not affecting the structural integrity; Fig. S4C and refs. 27 and 30) caused a drop of 30- to 50-fold in the affinity between pS2pS7-CTD and Rtt1031–131 (KD = 33 ± 1.2 µM for Ile112Ala, KD = 80 ± 11 µM for Ile112Gly) (Fig. S4). In agreement with previous structural observations (29), we noted that the phosphorylation of S2b is recognized by the side chain of Arg108. Interestingly, we observed multiple close contacts between Y1c and the C-terminal parts of helices α4 and α7. The positioning of Y1c near the tip of helices α4 and α7 induces a second sharp turn in the pS2pS7-CTD peptide. The side chain of Y1c forms a broad range of hydrophobic contacts with Lys72, Gly73, and Ile118, whereas the guanidinium group of Arg116 coordinates the backbone of pS2pS7-CTD. We found that charge-swapping mutations at the interacting sites of Rtt103 (not affecting the structural integrity; Fig. S4C) resulted in pronounced affinity decrease between Rtt103 and pS2pS7-CTD (KD = 9.7 ± 0.7, 51 ± 2.2, and 65 ± 8.9 µM for Lys72Glu, Arg116Glu, and Lys72Glu/Arg116Glu, respectively), highlighting the importance of the CTD backbone interactions with Arg116. A large area of the Rtt103 CID surface is positively charged and enriched in residues that could stabilize interaction with negatively charged sites of the phosphorylated CTD peptide (Fig. 1C). Although our data did not indicate the presence of intermolecular contacts for the pS7 residues, the positions of these residues are indirectly defined by the nuclear Overhauser effects from the neighboring residues. Therefore, residues pS7 are likely involved in charge–charge interactions with Lys27 and Lys105 (which is part of the poly-Lys tract Lys103-Lys104-Lys105) (Fig. 1C). We found that the Lys27Glu mutant (perturbation of one of the pS7 binding pockets; Fig. 1C) showed lower binding only for the pS7 containing peptide (KD of 13.2 ± 0.3 μM and 28.5 ± 1 μM for wild type and Lys27Glu, respectively) but not for the pS2-containing peptide (KD of 1.6 ± 0.07 μM and 2 ± 0.8 μM for wild type and Lys27Glu, respectively). Altogether, the key finding is that the Rtt103 CID interacts with pS2pS7-CTD via a larger area than previously reported (29), specifically recognizing the downstream region of the CTD peptide. Our structure reveals that P6apS7aY1bpS2bP3bT4bS5bP6bpS7bY1c is the minimal CTD-binding moiety recognized by Rtt103.
Table S3.
NMR distance and dihedral constraints for the complex between the Rtt103 CID and the pS2pS7-CTD peptide
| NMR distance and dihedral constraints | Value |
| Distance restraints | |
| Total NOE | 3,564 |
| Intraresidue | 842 |
| Interresidue | 2,722 |
| Sequential (|i – j| = 1) | 1,667 |
| Nonsequential (|i – j| > 1) | 1,897 |
| Hydrogen bonds | 96 |
| Intermolecular distance restraints | 49 |
| Total dihedral angle restraints* | 227 |
| Protein | |
| ϕ | 101 |
| ψ | 99 |
α-helical dihedral angle restraints imposed for the backbone based on the CSI.
Table S4.
Structure statistics for the complex between the Rtt103 CID and the pS2pS7-CTD peptide
| Structure statistics | Value |
| Violations (mean and SD) | |
| Distance constraints (>0.4 Å) | 0.1 ± 0.31 |
| Dihedral angle constraints (>15º) | 15.05 ± 1.6 |
| Max. dihedral angle violation, º | 52 ± 11 |
| Max. distance constraint violation, Å | 0.31 ± 0.05 |
| Deviations from idealized geometry | |
| Bond lengths, Å | |
| Bond angles, º | 1.5 ± 0.022 |
| Average pairwise rmsd,* Å | |
| Rtt103 CID (7-12; 19-31; 54-73; 77-94; 100-116; 121-133) | |
| Heavy atoms | 1.13 ± 0.16 |
| Backbone atoms | 0.41 ± 0.16 |
| CTD (141–150) | |
| Heavy atoms | 2.38 ± 0.57 |
| Backbone atoms | 1.17 ± 0.33 |
| Complex | |
| All heavy atoms | 2.23 ± 0.43 |
| All backbone atoms | 1.77 ± 0.46 |
Pairwise rmsd was calculated among 20 refined structures.
Fig. S3.
Solution NMR structure of the Rtt103 CID with the pS2pS7-CTD peptide. (A) Overlay of the 20 lowest-energy structures of the Rtt103 CID backbone (black ribbon) in complex with pS2pS7-CTD (red ribbon), shown in stereoview. N- and C-termini are indicated. (B) Overlay of [1H15N]-HSQC spectra, with Rtt103 CID in free form (red) and bound to the pS2pS7-CTD peptide (blue). Region corresponding to the amides of protein (Left); region corresponding to the Arg side chains (Right). (C) Schematic diagram of Rtt103 CID (blue labels) and pS2pS7-CTD (black) interactions. Hydrophobic contacts are indicated by spoked arcs, whereas hydrogen bonds are indicated by dashed lines. The pS2pS7-CTD sequence used for structure determination is indicated at Upper, where residues that showed interaction with the Rtt103 CID are shown in black.
Fig. S4.
Binding affinities of Rtt103 CID mutants. (A) Equilibrium binding of Rtt103 CID with a 5,6-carboxyfluorescein-labeled TSPS Y(pS2)PTSPS Y(pS2)PTSPS peptide (extrapS2-CTD) monitored by FA. (B) Plot with the quantified binding affinities (KD) of Rtt103 CID mutants toward the extrapS2-CTD peptide. Affinities were measured by fluorescence anisotropy. Corresponding KD values (±SD of the fit) are shown. CID, CTD interacting domain. (C) Comparison of 1H-NMR spectra that shows structural integrity of the Lys72Glu (purple), Arg116Glu (green), Gln19Ala (red), Ile112Gly (blue) mutants, and wild-type Rtt103 CID (yellow); the region with NH backbone and side-chain resonances is shown. Data were collected on 700 and 850 MHz Bruker AVANCE III spectrometer at 293 K.
Two CIDs Tethered by a Coiled-Coil Domain Tumble Independently.
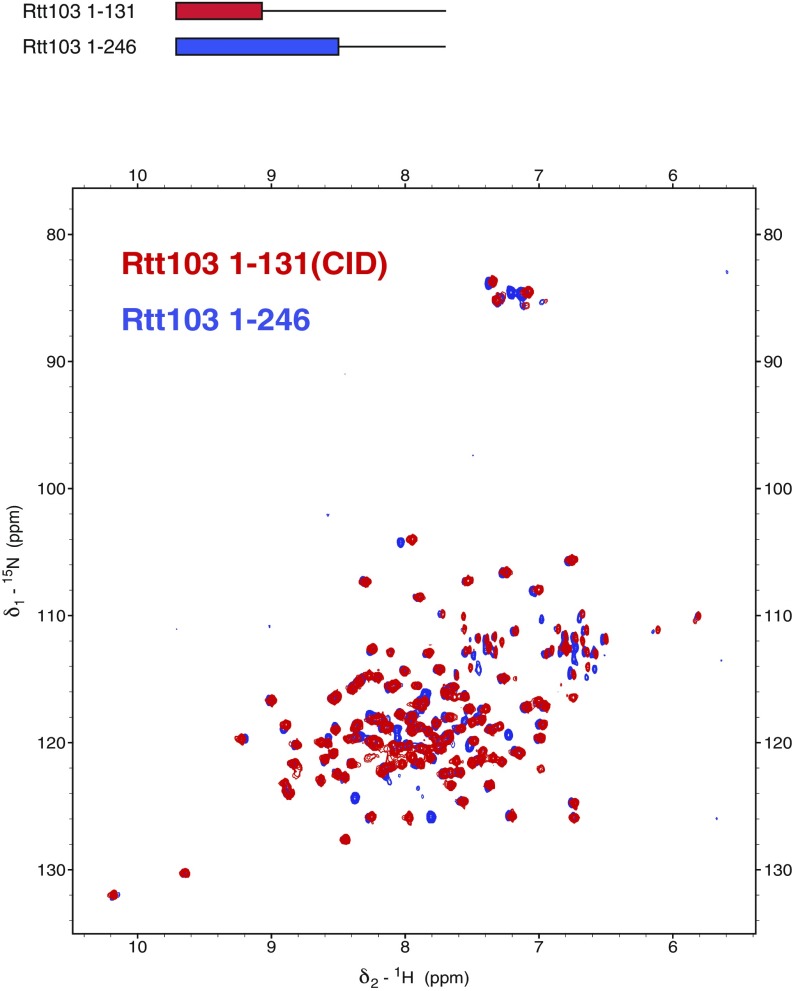
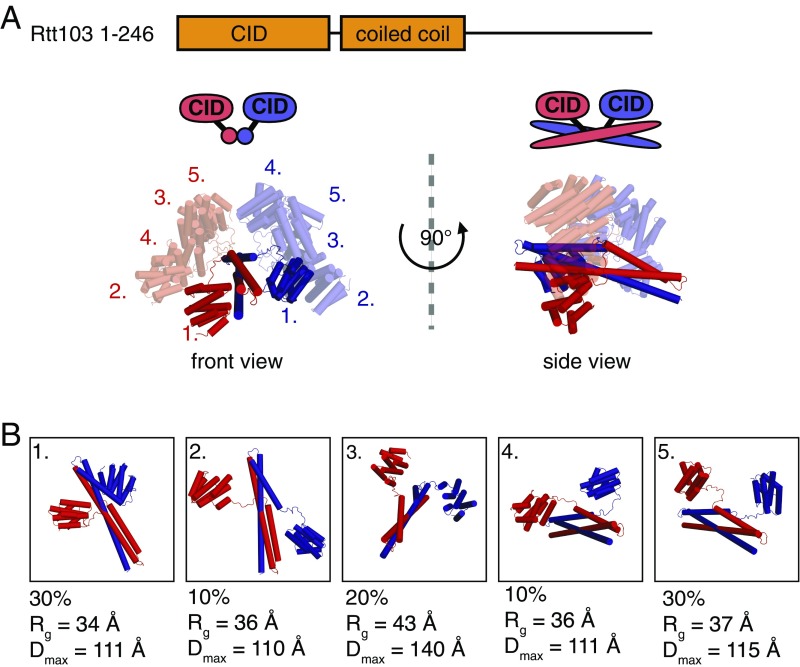
As a result of the antiparallel arrangement of the coiled coils, the Rtt103 CIDs are attached by a linker of 15 amino acids to the middle region of the coiled-coil domain. NMR investigations of the Rtt1031–246 and CID constructs showed that the CID structure is not influenced by the presence of the coiled-coil domain and that the CIDs are likely to tumble independently (Fig. S5). To visualize the arrangement of the Rtt103 CIDs relative to the coiled-coil domains, we analyzed SAXS scattering data of purified Rtt1031–246 using available atomic structures (PDB ID codes: 2KM4, 5M48) by ensemble-optimization method (EOM 2.0) (31). This approach enables deconvolving the conformational averaging into the contribution of individual conformers. The obtained models suggest that the coiled-coil domain defines the length of the protein (∼105 Å) (Fig. 2), and the linker allows the CIDs to reach all across the 105-Å-long coiled-coil domain. Thus, the CIDs could be positioned relatively close to each other but are also able to sample a large surrounding space to recognize the substrate (Movie S1). Next, we tested whether the coiled-coil–mediated dimerization of Rtt103 affects the binding to the CTD using fluorescence anisotropy (FA). We measured the binding affinity for the minimal CTD-binding moiety (SPS YpSPTSPpS YS) and a long CTD substrate (harboring two minimal CTD-binding moieties connected with a spacer; SPS YpSPTSPpS YSPTSPS YpSPTSPpS YS) with Rtt1031–246 and with the CID. We found that Rtt1031–246 binds to the minimal CTD-binding moiety with a KD of 3.3 ± 0.06 μM, and to the long CTD substrate with a KD of 0.3 ± 0.01 μM. The isolated CID binds to the minimal CTD-binding moiety with a KD of 1.65 ± 0.13 μM, and to the long CTD substrate with a KD of 0.5 ± 0.01 μM. This suggests that the dimerization increases the local concentration of CIDs that are available for the CTD binding. Altogether, the key finding is that dimerization of the Rtt103 coiled-coil domains does not promote formation of a rigid structure between the Rtt103 CIDs, but in fact helps the CIDs sample multiple conformations restricted only by their tethering to the flexible linker.
Fig. S5.
Presence of the coiled-coil domain does not influence the structure of the Rtt103 CID. Overlay of [15N,1H]-TROSY spectra of Rtt1031–246 (blue) and Rtt1031–131 (red), measured on a 950-MHz spectrometer. CID, CTD interacting domain.
Fig. 2.
The two Rtt103 CIDs are tethered by a coiled-coil domain but tumble independently. (A) Overlay of individual conformations from the ensemble of free Rtt1031–246 structures derived using the ensemble-optimization method (EOM 2.0) (31) (χ2 = 1.001); front and side views are provided. Conformations are superimposed based on structure of the coiled-coil domain. Conformations 2–5 are shown with 60% opacity. The two different polypeptide chains are shown in red and blue. (B) Individual conformations from the Rtt1031–246 ensemble derived by EOM 2.0; the fraction (%), radius of gyration (Rg), and maximum intraparticle distance (Dmax) are indicated for each conformation.
The Rtt103 Coiled-Coil Domain Restricts the Variability of the CTD–CIDs Assembly.
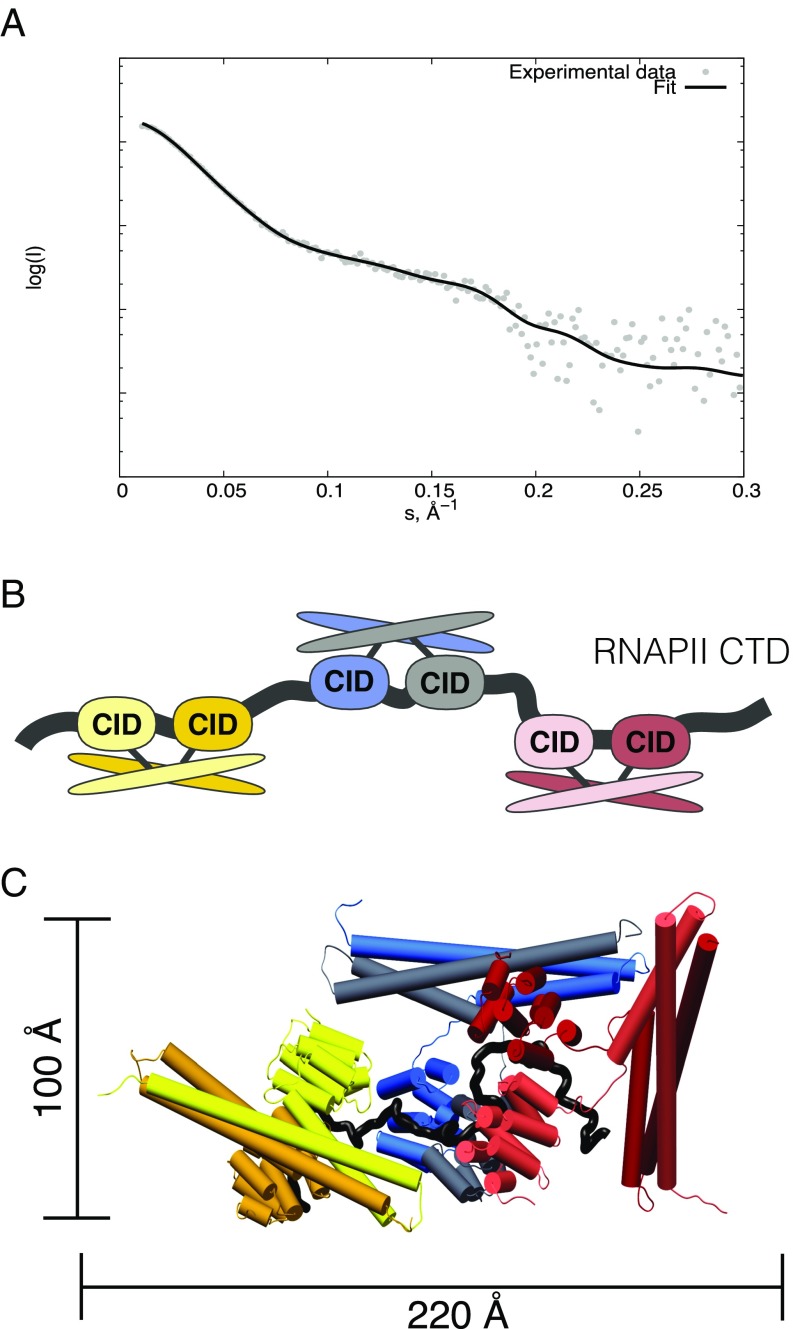
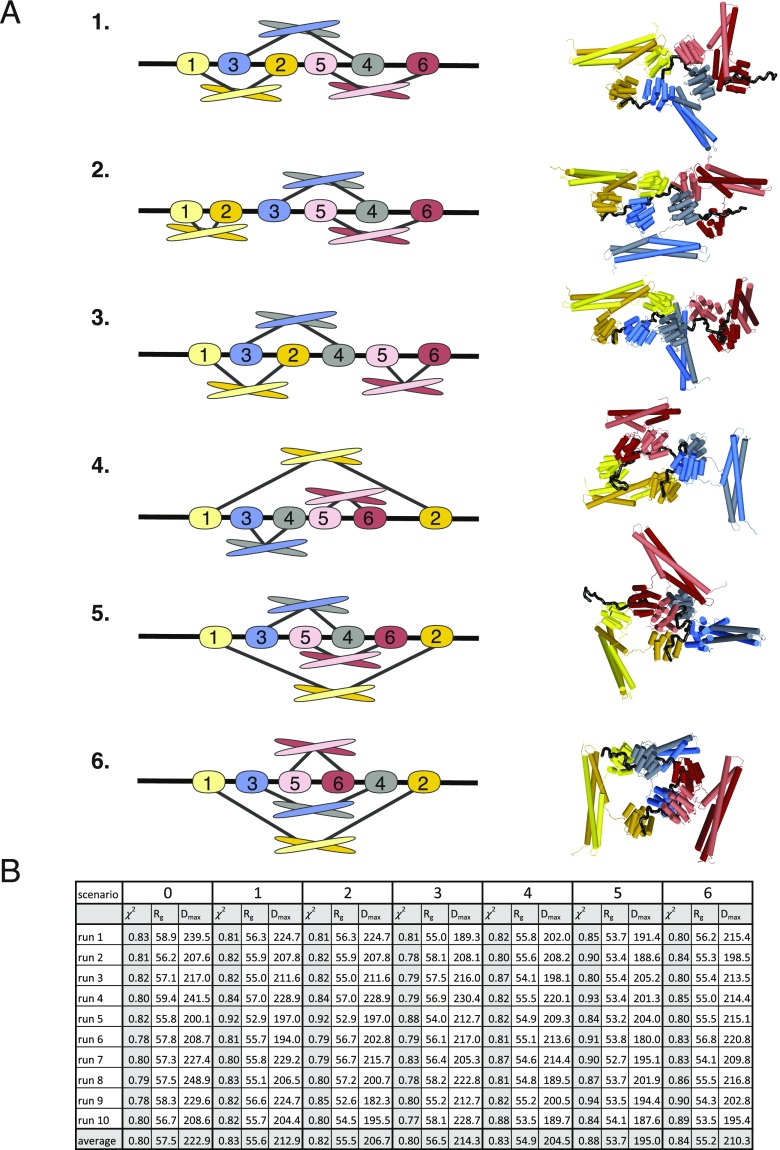
Next, we asked whether the coiled-coil-mediated dimerization of Rtt103 affects the overall fashion in which the repetitive CTD sequence is decorated with Rtt103 CIDs. The complex between Rtt1031–246 and pS2E-CTD {pSer2-CTD mimic [SPEFTCEPTSPS-(YEPTSPS)13-YEPAAADYKDDDDK]; Fig. S6} was prepared by mixing individual proteins with molar excess of Rtt1031–246, followed by size-exclusion chromatography and SAXS data collection. The estimation of the molecular mass (MM) of the complex was done using DAMMIF (32), which yielded a MM of 200 ± 5 kDa, that is close to the theoretical MM of the Rtt1031–246:CTD complex with a ratio of 6:1 (190 kDa). In terms of molecular architecture, it suggests that three Rtt103 dimers bind to a 13-repeat-long CTD upon saturation. The interpretation of the scattering data was performed using the CORAL software (33). The structures of the Rtt103 CID (PDB ID code: 5M9D) and coiled-coil domain (PDB ID code: 5M48) were combined together with the distance constraints between the CTD and Rtt103 CID and fitted against the experimental SAXS data. The calculation was repeated 10 times for each interaction scenario with a ratio of 6:1 for Rtt1031–246:CTD, which provided the best fit to the experimental data (Fig. 3 and Fig. S7). All reconstituted complexes displayed a similar elongated architecture characterized by a Dmax value of 180–250 Å (Fig. S7B). One Rtt103 dimer is accommodated on four CTD repeats (PS YEPTSPS YEPTSPS YEPTSPS YEPTS; CID recognition sites are shown in bold). In this architecture, the coiled-coil domains surround the individual Rtt103 CIDs accommodated on the CTD (Fig. 3). The shielding provided by the coiled coils restricts the flexibility of CIDs on the CTD to some extent, but promotes the stretching of the compact random coil structure of the CTD (22, 23). Interestingly, we obtained a similar quality fit to the experimental data without including the constraint that two CIDs of the dimer must bind neighboring CTD epitopes (Fig. S7). The obtained models contain CIDs accommodated in different areas of the CTD, supporting the hypothesis of residual flexibility in the core of the CTDsome shielded from the outside by coiled coils. Altogether, the key finding is that the CTDsome architecture is dynamic and allows for optimal recognition of available phosphorylation signals in the CTD. This variability is essential as the CTD contains some poorly conserved heptads (2) whose recognition is promoted by dimerization in which the coiled-coil domains prime the sampling of the CTD epitopes (Fig. 3 and Fig. S7).
Fig. S6.
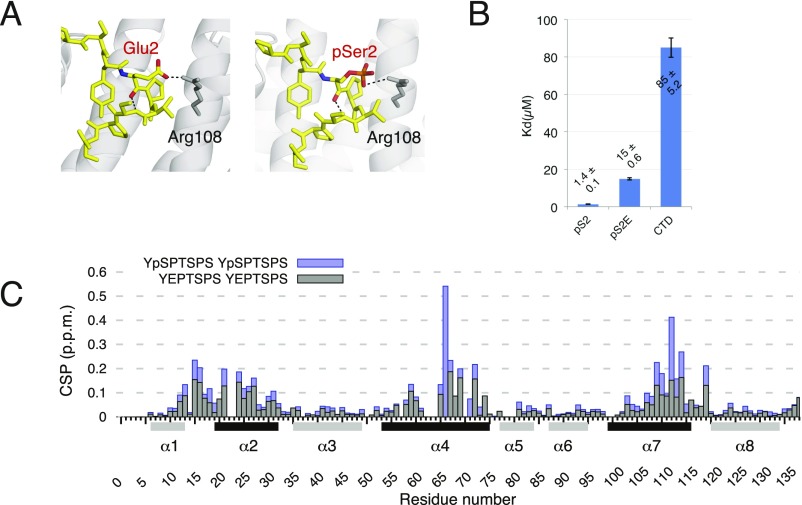
Glutamate substitution mimics CTD phosphorylation. To overcome production of high yields of homogeneously phosphorylated CTD, we prepared a phospho-mimicking mutant of CTD where pS2 is substituted by a glutamate residue (Glu2, E). [15N,1H]-HSQC titration data and binding studies confirmed that the Rtt103 CID interacts similarly with the pS2-CTD peptide and the corresponding mutant pS2E-CTD. (A) Scheme showing a putative interaction (black dashed line) between the Arg108 residue of Rtt103 and the E residue of pS2E-CTD (Left) or pS2 of pS2-CTD (Right). CTD peptides are shown as yellow sticks, whereas the Rtt103 CID is shown as gray cartoons. The conformation of the glutamate residue was modeled using PyMOL, based on the structure with PDB ID code 2L0I. (B) Binding affinities of the Rtt103 CID toward 5,6-carboxyfluorescein-labeled pS2, pS2E, and unphosphorylated CTD peptides, measured by fluorescence anisotropy. (C) Chemical shift perturbations (CSP) of the Rtt103 CID upon interaction with pS2-CTD (blue) or pS2E-CTD (gray), plotted against residue numbers corresponding to the Rtt103 CID sequence. Secondary structure elements are shown below the x axis; helices involved in the interaction with the phospho-peptides are colored in black.
Fig. 3.
Multisubunit arrangement of Rtt1031–246 across half the length of the CTD. (A) Comparison of the theoretical scattering (black) derived using CORAL based on the Rtt1031–246-CTD model against the experimental scattering data (gray). (B) Scheme showing the arrangement of the individual Rtt1031–246 molecules across half the length of the CTD (13 heptad repeats), which is the CTD construct employed during modeling using CORAL (consecutive interaction, “scenario 0,” see Fig. S7). (C) Representative model obtained from the CORAL calculation for the consecutive interaction scenario. Color coding is according to the scheme in B.
Fig. S7.
Multisubunit arrangement of Rtt1031–246 across half the length of the CTD. (A) Scheme of six different interaction scenarios (Left) used for CORAL modeling. The order in which the CIDs bind the CTD (black ribbon) repeats is indicated by numbers. Ten CORAL runs were performed for each scenario, and a representative model is shown for each (Right). (B) Table with values of goodness of the fit (χ2), radius of gyration (Rg), and maximum intraparticle distance (Dmax) for each CORAL run of each interaction scenario. Scenarios 1–6 correspond to those in A, whereas scenario 0 corresponds to that shown in Fig. 3. The values of Rg and Dmax are determined using CRYSOL (42) for each CORAL model.
Discussion
Assembly and reassembly of the CTDsome during transcription by RNAPII is important for regulation of transcription and RNA processing. However, due to the structural complexity and dynamics of the CTDsome, the mechanistic aspects of this process remain poorly understood. Here, we report an experimentally based structural model of the CTDsome, which has been derived using a combination of X-ray, NMR, and SAXS data (Fig. 3).
First, we determined that Rtt103 is capable of dimerizing in free form via a coiled-coil domain. Several CID-containing proteins are known to have multimerization regions such as the Nrd1-Nab3 heterodimerization region (34), coiled-coil region in Pcf11 (35), and coiled-coil regions in RPRD1A, RPRD1B, and RPRD2 (27, 36). The RPRD1A-RPRD1B heterodimer binds to multiple pS2-CTD repeats and exposes the pS5 sites on the CTD, which stimulates the activity of RPAP2 pS5-CTD phosphatase. It is likely that the Rtt103 scaffold is used to recruit other factors or enzymes (e.g., Rat1-Rai1) that act on the CTD. In contrast to RPRD1A and RPRD1B, which include only the CID and dimerization domain, Rtt103 has a long unstructured C-terminal part that occupies half of the protein and, therefore, could greatly impact multisubunit architectures and interactions with other RNA/protein-binding factors.
Here, we determined that the Rtt103 CID binds across three CTD heptads and that the minimal CTD binding moiety consists of the P6apS7aY1bpS2bP3bT4bS5bP6bpS7bY1c sequence. These findings indicate that the Rtt103 CID binds a longer CTD stretch than previously reported (29). Accommodation of the core P6aS7aY1bS2bP3bT4bS5b stretch of the CTD in the CID binding pocket is highly conserved among CID–CTD peptide complexes (26, 27, 37, 38). In contrast, the conformation of the upstream and especially downstream region of the CTD peptide on the CID surface varies among CID–CTD peptide complexes (26, 27, 37, 38). In our solution NMR structure, the pS2pS7-CTD peptide makes multiple contacts with a conserved Arg116 residue and exits the binding pocket between helices α4 and α7, thereby occupying almost the whole conserved surface of the CID. Similarly, the solution structure of pT4-CTD–Rtt103-CID and crystal structure of RPRD1B/RPRD1A also exhibit an elongated conformation of the CTD (27, 30). In these structures, the binding of additional residues at the C-terminal of the β-turn stretch of the CTD significantly changes the conformation of bound CTD, which could be important for the higher order arrangement of CIDs and exposure of the nonbound CTD residues to other factors (27). Additionally, the extended interaction surface of the CIDs in Rtt103 and RPRD1B/RPRD1A may partially explain their higher affinity toward the CTD compared with the affinity of the CIDs in Nrd1 and Pcf11 (38, 39).
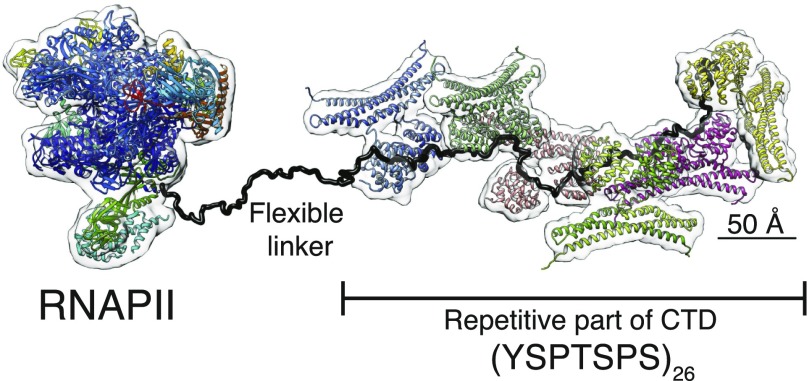
The regulation of transcription requires a complex interplay involving fast and dynamic exchange of multiple RNA/protein-binding factors. This network is largely maintained and balanced by means of a structurally adaptable CTD which increases the local concentration of factors and allosterically regulates their activity of transcription and RNA processing factors near the emerging nascent transcript. Our reconstruction of the CTD in complex with Rtt103 shows that Rtt103 can fully explore the repetitiveness and length of the CTD sequence by occupying CTD in a repetitive manner (“beads-on-a-string”) while keeping the entire arrangement flexible and dynamic. Rtt103 dimerization creates topological and mobility restraints, which, in turn, tune the protein’s affinity toward the CTD by increasing the local concentration of CIDs, and further governs the exposure of the CTD sequence to other protein-binding factors. We suggest that CTD code readers, such as Rtt103, and other CTD effector molecules form a high-order structure that is essential for the conception and interpretation of the CTD code (Fig. 4 and Movie S2). The tail-like architecture allows for quick exchange of binding factors and coordinates the regulatory networks necessary for efficient gene regulation. Interestingly, the structure of the CTD tail decorated with Rtt103 dimers appears to be fully extended and protrudes away from the invariant core of the RNAPII (Fig. 4 and Movie S2). The structural model of the Rtt103–CTDsome demonstrates how the CTD allows forming diverse and tuneable protein assemblies around the invariant core of the RNAPII, supporting the complex networks necessary for efficient gene regulation.
Fig. 4.
Model of the Rtt103-CTDsome assembly involving the full-length RNAPII CTD. The model of the RNAPII with the full-length CTD is decorated with six dimers of Rtt1031–246 (Movie S2). The structure of RNAPII (PDB ID code: 5F12) is combined with two CORAL models of the Rtt1031–246–CTD complex, where C-interacting domains (CIDs) are arranged in a consecutive manner.
Methods
A full description of the methods for protein expression, purification, and fluorescence anisotropy measurements as well as NMR, X-ray, and SAXS data collection and analysis is provided in SI Methods and Tables S5 and S6. SAXS data are deposited in Small Angle Scattering Biological Data Bank (SASBDB ID: SASDCZ2). The model and the diffraction data containing phase information was deposited to Protein Data Bank, PDB ID code: 5M48. The atomic coordinates and restraints for the NMR ensemble of the Rtt103-CID—pS2pS7-CTD complex have been deposited in the Protein Data Bank, PDB ID code: 5M9D.
Table S5.
List of peptides used in the study
| Name | (Label)-sequence (N to C terminus) | Synthesis company | Description/use |
| pS2pS7-CTD | TSP(pS) Y(pS)PTSP(pS) Y(pS)PTS | Clonestar | Solution NMR structure determination |
| FAM-extrapS2-CTD | FAM-TSPS Y(pS)PTSPS Y(pS)PTSPS | Clonestar | Fluorescence anisotropy measurements; NMR titration |
| FAM-pS2-CTD | FAM- Y(pS)PTSPS Y(pS)PTSPS | Clonestar | Fluorescence anisotropy measurements; NMR titration |
| FAM-CTD | FAM- YSPTSPS YSPTSPS | Clonestar | Fluorescence anisotropy measurements |
| FAM-short pS2pS7-CTD | FAM- SPS Y(pS)PTSP(pS) YS | Clonestar | Fluorescence anisotropy measurements |
| FAM-long pS2pS7-CTD | FAM- SPS Y(pS)PTSP(pS) YSPTSPS Y(pS)PTSP(pS) YS | Clonestar | Fluorescence anisotropy measurements |
| FAM-pS7 | FAM- YSPTSP(pS) YSPTSP(pS) | Clonestar | Fluorescence anisotropy measurements |
| FAM-pS2E-CTD | FAM- YEPTSPS YEPTSPS | Clonestar | Fluorescence anisotropy measurements |
| pS2E -CTD | YEPTSPS YEPTSPS | Clonestar | NMR titration |
| pS2-CTD | Y(pS)PTSPS Y(pS)PTSPS | Clonestar | NMR titration |
Table S6.
Oligonucleotides used in the study
| Name | Sequence (5′ to 3′) | Description/use |
| Rtt103_141_NdeI_forw | CAGCATATGTTGGTGTTACCCCAG | Forward primer for cloning of Rtt103141–246 into pET22b |
| Rtt103_246_XhoI_rev | CACCTCGAGGTCTTTAGCAGATAAAAC | Reverse primer for cloning of Rtt103141–246 into pET22b |
| Rtt103_246_forw | GTTTTATCTGCTAAAGACCTCGAGCACCACCACCACCACC | Forward primer for cloning of Rtt1031–246 |
| Rtt103_246_rev | GGTGGTGGTGGTGGTGCTCGAGGTCTTTAGCAGATAAAA C | Reverse primer for cloning of Rtt1031–246 |
| Rtt103_R108E_forw | GGGACCTAAAAAAGAAGTTGTCAGAAGTTGTGAATATAC | Forward primer for Rtt103-CID R108E mutant |
| Rtt103_R108E_rev | GTATATTCACAACTTCTGACAACTTCTTTTTTAGGTCCC | Reverse primer for Rtt103-CID R108E mutant |
| K72E_forw | CATGTTGTTCAACAGGCTGAAGGTCAAAAAATTATTC | Forward primer for Rtt103-CID K72E and K72E/R116E mutant |
| K72E_rev | GAATAATTTTTTGACCTTCAGCCTGTTGAACAACATG | Reverse primer for Rtt103-CID K72E and K72E/R116E mutant |
| Rtt103_R116E_forw | GTGAATATACTAAAAGAAGAGAATATATTTTCCAAGCAGG | Forward primer for Rtt103-CID R116E and K72E/R116E mutant |
| Rtt103_R116E_rev | CCTGCTTGGAAAATATATTCTCTTCTTTTAGTATATTCAC | Reverse primer for Rtt103-CID R116E and K72E/R116E mutant |
| sCTD universal Bam HI forw | CGTGGATCCCCGGAATTCACCTG | Forward primer for cloning of phophomimicking CTD into pET28b-SMT3 |
| sE2 13 FLAG HindIII rev | GGAAGCTTACTTATCGTCGTCATCCTTGTAATCTGCTGCTGCTGGTTCATA | Reverse primer for cloning of phophomimicking CTD into pET28b-SMT3 |
SI Methods
Cloning and Purification of Phospho-Serine Mimetic.
Template for phospho-serine mimetic was synthesized by GeneArt, Thermo Fisher Scientific. Sequence was amplified and cloned into pET28b-SMT3 (41) using BamHI and HindIII restriction sites with the addition of C-terminal FLAG-tag [protein sequence after 6xHIS-SUMO cleavage: SPEFTCEPTSPS-(YEPTSPS)13-YEPAAADYKDDDDK]. Resulted construct was verified by DNA sequencing and transformed into E. coli BL21-Codon Plus (DE3)-RIPL cells (Stratagene). For protein expression, bacteria was grown in M9 medium with 50 mg/L of kanamycin at 37 °C until OD600 ∼ 0.6, cooled down to 30 °C, induced with 0.1 mM IPTG and protein was overexpressed at 30 °C overnight. Cells were harvested by centrifugation and resuspended in the denaturing buffer (8 M urea, 50 mM Tris, 500 mM NaCl, 10 mM BME, 5 mM imidazole, 0.1% Nonidet P-40, pH20 °C = 8). The lysate was rigorously stirred at 4 °C for 1 h, cleared then by centrifugation (50,000 × g for 1 h). Soluble fraction was loaded on Ni-NTA beads (Qiagen), the bound protein was refolded on the column with the refolding buffer (50 mM Tris, 500 mM NaCl, 10 mM BME, 5 mM imidazole, 0.1% Nonidet P-40, pH4 °C = 8), and eluted with refolding buffer containing 300 mM imidazole. 6xHIS-SUMO-tag was cleaved overnight by Ulp1 protease during the dialysis into the refolding buffer. Cleaved fraction of 6xHIS-SUMO-tag was bound to Ni-NTA beads (Qiagen), flow-through containing was concentrated using Vivaspin 20 (Sartorius) concentrator with 3,000 Da cutoff, loaded on Superdex 75 10/600 (GE Healthcare), and eluted with 50 mM Tris, 500 mM NaCl, 10 mM BME, pH20 °C = 8 (room temperature).
Cloning and Purification of Rtt103.
The pET28b-Rtt103-CID S18A, Q19A, I112A, and I112G plasmids were gifts from T. Kabzinski, CEITEC, Brno, Czech Republic. Rtt103-CID-6xHIS point mutants (K72E, K72E/R116E, R108E, R116E) were obtained by QuikChange site-directed mutagenesis kit (Stratagene). Resulting constructs were verified by DNA sequencing, and then transformed into E. coli BL21-Codon Plus (DE3)-RIPL cells (Stratagene). Rtt103-CID-6xHIS (gift from A. Meinhart, Max Planck Institute for Medical Research, Heidelberg) and point mutants were expressed and purified as previously described (29).
pET21b-Rtt103-1–246 was amplified from pET21b-Rtt103 (gift from C. L. Moore, Tufts University School of Medicine, Boston) by removing residues 247–409. Rtt103141–246 was amplified from pET21b-Rtt103 and cloned into pET22b using NdeI and XhoI restriction sites. Resulting constructs containing C-terminal 6xHIS-tag were verified by DNA sequencing and then transformed into E. coli BL21-Codon Plus (DE3)-RIPL cells (Stratagene).
For the expression of Rtt1031–246, bacterial culture was grown in M9 medium with 50 mg/L of ampicillin at 37 °C until OD600 ∼ 0.3, cooled down to 20 °C, induced with 0.5 mM IPTG, and protein was overexpressed at 20 °C overnight. Cells were harvested by centrifugation and resuspended in lysis buffer [50 mM KH2PO4, 500 mM KCl, 0.5 mM EDTA, 10 mM BME, 40 mM imidazole, 10% glycerol, pH20 °C = 7 supplemented with protease inhibitor mixture (cOmplete; Roche)]. After disruption of cells, the lysate was cleared by centrifugation (50,000 × g for 1 h) and soluble fraction was loaded on HisTrap FF Crude (GE Healthcare). The column was washed by lysis buffer containing 75 mM imidazole, protein eluted by lysis buffer containing 500 mM imidazole. Buffer was exchanged to the ion-exchange buffer (25 mM KH2PO4, 50 mM KCl, 1 mM BME pH20 °C = 6.5) using HiPrep26/10 desalting (GE Healthcare). Protein was loaded on HiTrap SP HP column (GE Healthcare) equilibrated with the ion-exchange buffer and eluted with 50 mM to 1 M KCl gradient. Eluted protein was further purified on HiLoad Superdex 200 (GE Healthcare) in 25 mM KH2PO4, 300 mM KCl, 10 mM BME pH20 °C = 6.5 buffer. Protein sample was concentrated using Vivaspin 20 (Sartorius) concentrator with 10,000 Da cutoff.
For expression of Rtt103141–246, bacterial culture was grown in M9 medium with 50 mg/L ampicillin at 37 °C until OD600 ∼ 0.3, cooled down to 25 °C, induced with 0.5 mM IPTG, and protein was overexpressed at 25 °C overnight. Cells were harvested by centrifugation and resuspended in the lysis buffer [50 mM Tris, 500 mM NaCl, 10 mM BME, 40 mM imidazole, 10% glycerol, pH20 °C = 8 supplemented with protease inhibitor mixture (cOmplete; Roche)]. After disruption of cells, the lysate was cleared by centrifugation (50,000 × g for 1 h) and soluble fraction was loaded on Ni-NTA column (Qiagen), washed with lysis buffer containing 1 M NaCl and 75 mM imidazole, protein was eluted using lysis buffer containing 500 mM imidazole. Eluted protein was loaded on HiLoad 16/600 Superdex 75 (GE Healthcare) and eluted with 50 mM Tris, 500 mM NaCl, 5% glycerol, 10 mM BME, pH20 °C = 8. Protein was dialyzed to 25 mM Tris, 200 mM NaCl, 1 mM BME, pH4 °C = 8.0 and concentrated using Vivaspin 20 (Sartorius) concentrator with 3,000 Da cutoff to 6 mg/mL for crystallization. Protein was crystallized in 3.75 M sodium formate at 20 °C. For crystallization, the protein was labeled with selenomethionine by feedback inhibition of the methionine biosynthesis pathway in M9 media.
pET21b-Rtt103 was transformed into E. coli BL21-Codon Plus (DE3)-RIPL cells (Stratagene). For the expression of Rtt103, bacterial culture was grown in LB medium with 50 mg/L ampicillin at 37 °C until OD600 ∼ 0.3, cooled down to 16 °C, induced with 0.5 mM IPTG, and protein was overexpressed at 16 °C overnight. Cells were harvested by centrifugation and resuspended in the lysis buffer [50 mM Tris, 500 mM NaCl, 10 mM BME, 20 mM imidazole, pH20 °C = 8 supplemented with protease inhibitor mixture (cOmplete; Roche)]. After disruption of cells, the lysate was cleared by centrifugation (50,000 × g for 1 h) and soluble fraction was loaded on Ni-NTA column (Qiagen), washed with lysis buffer containing 1 M NaCl, protein was eluted using lysis buffer containing 500 mM imidazole. Eluted protein was loaded on HiLoad 16/600 Superdex 200 (GE Healthcare) and eluted with 50 mM Tris, 500 mM NaCl, 10% glycerol, 10 mM BME, pH20 °C = 8.
Size-Exclusion Chromatography Analysis.
Molecular weight estimation was performed using Superdex 200 10/300 GL column in buffer containing 50 mM Tris, 250 mM NaCl, 1 mM BME, pH20 °C = 8.0 at room temperature. Column was calibrated using Gel Filtration Molecular Weight Markers Kit for Molecular Weights 12,000–200,000 Da (Sigma Aldrich).
Sample Preparation and SAXS Analysis.
Rtt103141–246 was measured in 50 mM Tris, 300 mM NaCl, 10 mM BME, pH = 8.0 (4 °C) with 1.9, 4.9, and 7 mg/mL concentration at 4 °C. Data from low and high concentration measurements was merged. Rtt1031–246 was measured in 25 mM KH2PO4, 300 mM KCl, 10 mM BME, pH20 °C = 6.5 with 5.2 mg/mL concentration at 4 °C. Rtt1031–246–phospho-mimetic complex was prepared by mixing phospho-mimetic with 10-fold molar excess of Rtt1031–246. The formed complex was purified using Superdex 200 Increase 10/300 (GE Healthcare) in 25 mM KH2PO4, 300 mM KCl, 10 mM BME, pH4 °C = 6.5. The peak fractions were pooled and concentrated on Amicon Ultra 0.5 mL Centrifugal filters (Millipore) with 3,000 Da cutoff. Dilution series were measured at 4 °C.
The SAXS data were collected on the BioSAXS-1000, Rigaku at CEITEC. Data were collected at X-ray beam wavelength λ = 1.54 Å. Sample to detector (PILATUS 100K; Dectris Ltd.) distance was 0.485 m, covering a scattering vector range from 0.008 to 0.65 Å−1. For buffer and sample one 2D image was collected with an exposure time of 60 min per image. Data are plotted using Gnuplot 4.6. Evaluation of the solution scattering of the atomic models and the fitting to experimental data were performed by CRYSOL (42). Ab initio modeling was performed by DAMMIN (40). Superposition of ab initio and atomic models was performed by SUPCOMB (43).
CORAL Modeling.
Rigid body modeling was performed by CORAL (33) using Rtt103141–246 crystal structure (PDB ID code: 5M48), Rtt103-CID—pS2pS7-CTD complex structure (PDB ID code: 5M9D), protein sequences of phospho-serine mimetic and sequence of Rtt1031–246 as a constrain.
In CORAL modeling configuration setup each dimer of Rtt1031–246 was composed of two Rtt103-CIDs connected by 12-aa flexible linker to the Rtt103141–246 coiled-coil dimer. The interaction between Rtt103-CID and the CTD stretch was restrained based on the Rtt103-CID—pS2pS7-CTD complex structure, the nonbound regions of CTD were kept flexible. Different arrangements of CIDs were tested the calculation for each interaction scenario was repeated 10 times.
EOM Modeling.
Rtt1031–246 was modeled into SAXS experimental data by EOM 2.0 (31) applying standard setup using Rtt103-CID (PDB ID code: 2KM4), Rtt103141–246 (PDB ID code: 5M48) and keeping unstructured elements flexible.
Fluorescence Anisotropy.
The equilibrium binding of Rtt103 CID and its mutants to different CTD-peptides was analyzed by FA. The CTD peptides were N-terminally labeled with the 5,6-carboxyfluorescein (FAM); for the list of peptides, see Table S5. The measurements were conducted on a FluoroLog-3 spectrofluorometer (Horiba Jobin-Yvon Edison). The instrument was equipped with a thermostated cell holder with a Neslab RTE7 water bath (Thermo Scientific). Samples were excited with vertically polarized light at 467 nm, and both vertical and horizontal emissions were recorded at 516 nm. All measurements were conducted at 10 °C in 35 mM KH2PO4, 100 mM KCl (pH 6.8). Each data point is an average of three measurements. The experimental binding isotherms were analyzed by DynaFit (44).
Crystal Structure Determination.
Selenomethionine-containing crystals were subjected to multiple anomalous dispersion diffraction experiments. Specifically, the data were collected at the Se absorption edge, at the inflection point, and at high and low energy remote wavelengths. Data were processed and integrated using XDS package (45). Unmerged XDS.ASCII file containing all of the reflections was processed by the program Pointless of CCP4 software suit (46, 47), which resulted in the unambiguous F4132 space group assignment. Reflections were scaled using the program Aimless (47) of the CCP4 software suit. The same procedure was applied to all four datasets. Scaled data were analyzed by the Xtriage module of Phenix software suit (48), which indicated reliable anomalous signal extended to 3.8 Å. The data were then subjected to heavy atom search by the Hyss module of Phenix software suit while keeping the resolution at 3.8 Å (49, 50). Four possible solutions were found by Hyss (each containing six Se atoms) with a Hyss CC of 0.461. The correct solution was determined by calculating the phase and carrying out density modification by programs SOLVE and RESOLVE, respectively [both parts of Phenix software suit (48, 51]. Correct solution statistics as described in ref. 52: Estimated MAP CC × 100 = 65.13, SKEW of 0.37, FOM (figure of merit) = 0.551, R factor (of density modified map) of 0.331. The phases for the protein model were calculated by the program SOLVE, and the resulting density was further modified by the program RESOLVE (51). Phasing was carried out at the resolution of 3 Å. The resulting electron density was used for the automated model building using the program Buccaneer of the CCP4 Software Suit (47, 53). This resulted in a model, which was deemed to be 90% complete. Manual modifications included several Ramachandran plot and rotamer outliers corrections using the program Coot (54). The model was then used as a molecular replacement search model to phase a dataset processed to 2.593 Å (low energy remote) using Phaser (55). The resulting solution was subjected to Phenix.Refine (56) module of Phenix crystallographic suit of programs (48). Individual XYZ coordinates and individual B factors were refined and included TLS groups as determined by TLS motion determination server, which resulted in the overall crystallographic R and Rfree factors of 24.55% and 26.40%, respectively. Ramachandran-plot statistics: favored, 99%; allowed, 1% as defined by wwPDB validation report.
NMR Measurements and Structure Determination.
All NMR spectra for the backbone and side-chain assignments were recorded on Bruker AVANCE III HD 950, 850, and 700 MHz spectrometers equipped with cryoprobes at a sample temperature of 20 °C using 1 mM uniformly 15N,13C-labeled Rtt103-CID in 35 mM KH2PO4, 100 mM KCl, pH 6.8 (20 °C) (90% H2O/10% D2O), and 2.5 mM pS2pS7-CTD peptide. Initial nuclei assignment was transferred from Biological Magnetic Resonance Bank entries 17044 and 16411 and confirmed by CBCACONH and HCCH-TOCSY spectra. The structure of the complex was determined as previously described (30). Ramachandran-plot statistics: favored, 94%, allowed, 4%; outliers, 2% as defined by wwPDB validation report. Determination of chemical shift perturbation (CSP) value was performed as previously described (30).
Trypsin Digestion and Mass-Spectrometry Analysis.
For the limited proteolysis study, 0.8 mg/mL Rtt103 was mixed with 50 ng/µL trypsin (1:100 wt/wt; Promega). Samples were incubated at 20 °C for 5, 10, 15, 30, 45, 60, 120 min and overnight. The cleavage reaction was stopped by mixing with 4xSDS-gel loading dye and 5 min boiling at 95 °C. The samples were analyzed on 18% SDS/PAGE. One-dimensional gel areas to be analyzed were excised from the gel and after destaining and washing procedures, each gel plug was incubated with trypsin (125 ng of trypsin, 2 h, 40 °C). MALDI-MS and MS/MS analyses of tryptic digests were performed on an Ultraflextreme mass spectrometer (Bruker Daltonik) operated by FlexControl 3.3 software (Bruker Daltonik). Peptide maps were acquired in reflectron positive mode (25 kV acceleration voltage) with 800 laser shots. Peaks with minimum S/N = 10 were picked out for MS/MS analysis employing LIFT arrangement with 600 laser shots for each peptide. α-Cyano-4-hydroxycinnamic acid was used as the matrix in combination with AnchorChip target. External mass calibration procedure was employed, using a mixture of seven peptide standards (Bruker Daltonik) covering the mass range of 700–3,100 Da. The FlexAnalysis 3.3 and MS BioTools 3.2 (Bruker Daltonik) software were used for data processing. MASCOT 2.2 (MatrixScience) search engine was used for processing the MS and MS/MS data. For MALDI MS data, mass tolerance of 30 ppm was allowed for peptide mapping and 0.5 Da for MS/MS ion searches. Oxidation of methionine and propionamidylation of cysteine as optional modifications and one enzyme miscleavage were set for all searches. Peptides with statistically significant peptide score (P < 0.05) were considered. Manual MS/MS spectra assignment validation was done.
Visualization of Structures and Preparation of Movies.
Structures were visualized and movies prepared using PyMOL (The PyMOL Molecular Graphics System, Version 1.8 Schrödinger, LLC) or UCSF Chimera (57).
Supplementary Material
Acknowledgments
We thank P. Kuzmic and C. Hofr for helpful advice on binding data analysis; J. Houser and J. Kosourova for help with crystallization screens; O. Sedo and D. Fridrichova for mass-spectrometry analysis; L. Mukhamedova for collecting crystal diffraction data; and C. Jeffries and A. Panjkovich for helpful advice on SAXS data analysis. The results of this research have been acquired within the CEITEC 2020 (LQ1601) project with financial contribution made by the Ministry of Education, Youths and Sports of the Czech Republic (MEYS CR) and special support paid from the National Programme for Sustainability II funds. The scientific data were obtained with the support of Josef Dadok National NMR Centre of CEITEC, supported by the Czech Infrastructure for Integrative Structural Biology research infrastructure (LM2015043 funded by MEYS CR), the X-ray Diffraction and Bio-SAXS Core Facility, and the Proteomics Core Facility of CEITEC, supported by the project CZ.1.05/1.1.00/02.0068, financed from the European Regional Development Fund. This project has received funding from the European Research Council (ERC) under the European Union’s Horizon 2020 research and innovation programme Grant Agreement 649030 (to R.S.). This work was supported by the Czech Science Foundation Grants 13-18344S (to R.S.) and 15-24117S (to K.K.). The research leading to these results received funding from ERC under the European Union’s Seventh Framework Program Grant FP/2007-2013/ERC Grant Agreement 355855' and from EMBO installation Grant 3041 (to P.P.). This publication reflects only the author’s view and the Research Executive Agency is not responsible for any use that may be made of the information it contains.
Footnotes
The authors declare no conflict of interest.
This article is a PNAS Direct Submission.
Data deposition: The atomic coordinates and structure factors have been deposited in the Protein Data Bank, www.wwpdb.org (PDB ID codes 5M48 and 5M9D); SAXS data are deposited in Small Angle Scattering Biological Data Bank (SASBDB ID code SASDCZ2).
This article contains supporting information online at www.pnas.org/lookup/suppl/doi:10.1073/pnas.1712450114/-/DCSupplemental.
References
- 1.Eick D, Geyer M. The RNA polymerase II carboxy-terminal domain (CTD) code. Chem Rev. 2013;113:8456–8490. doi: 10.1021/cr400071f. [DOI] [PubMed] [Google Scholar]
- 2.Chapman RD, Heidemann M, Hintermair C, Eick D. Molecular evolution of the RNA polymerase II CTD. Trends Genet. 2008;24:289–296. doi: 10.1016/j.tig.2008.03.010. [DOI] [PubMed] [Google Scholar]
- 3.Harlen KM, Churchman LS. The code and beyond: Transcription regulation by the RNA polymerase II carboxy-terminal domain. Nat Rev Mol Cell Biol. 2017;18:263–273. doi: 10.1038/nrm.2017.10. [DOI] [PubMed] [Google Scholar]
- 4.West ML, Corden JL. Construction and analysis of yeast RNA polymerase II CTD deletion and substitution mutations. Genetics. 1995;140:1223–1233. doi: 10.1093/genetics/140.4.1223. [DOI] [PMC free article] [PubMed] [Google Scholar]
- 5.Liu P, Kenney JM, Stiller JW, Greenleaf AL. Genetic organization, length conservation, and evolution of RNA polymerase II carboxyl-terminal domain. Mol Biol Evol. 2010;27:2628–2641. doi: 10.1093/molbev/msq151. [DOI] [PMC free article] [PubMed] [Google Scholar]
- 6.Buratowski S. The CTD code. Nat Struct Biol. 2003;10:679–680. doi: 10.1038/nsb0903-679. [DOI] [PubMed] [Google Scholar]
- 7.Mayer A, et al. Uniform transitions of the general RNA polymerase II transcription complex. Nat Struct Mol Biol. 2010;17:1272–1278. doi: 10.1038/nsmb.1903. [DOI] [PubMed] [Google Scholar]
- 8.Mayer A, et al. CTD tyrosine phosphorylation impairs termination factor recruitment to RNA polymerase II. Science. 2012;336:1723–1725. doi: 10.1126/science.1219651. [DOI] [PubMed] [Google Scholar]
- 9.Bataille AR, et al. A universal RNA polymerase II CTD cycle is orchestrated by complex interplays between kinase, phosphatase, and isomerase enzymes along genes. Mol Cell. 2012;45:158–170. doi: 10.1016/j.molcel.2011.11.024. [DOI] [PubMed] [Google Scholar]
- 10.Kim H, et al. Gene-specific RNA polymerase II phosphorylation and the CTD code. Nat Struct Mol Biol. 2010;17:1279–1286. doi: 10.1038/nsmb.1913. [DOI] [PMC free article] [PubMed] [Google Scholar]
- 11.Tietjen JR, et al. Chemical-genomic dissection of the CTD code. Nat Struct Mol Biol. 2010;17:1154–1161. doi: 10.1038/nsmb.1900. [DOI] [PMC free article] [PubMed] [Google Scholar]
- 12.Heidemann M, Hintermair C, Voß K, Eick D. Dynamic phosphorylation patterns of RNA polymerase II CTD during transcription. Biochim Biophys Acta. 2013;1829:55–62. doi: 10.1016/j.bbagrm.2012.08.013. [DOI] [PubMed] [Google Scholar]
- 13.Suh H, et al. Direct analysis of phosphorylation sites on the Rpb1 C-terminal domain of RNA polymerase II. Mol Cell. 2016;61:297–304. doi: 10.1016/j.molcel.2015.12.021. [DOI] [PMC free article] [PubMed] [Google Scholar]
- 14.Schüller R, et al. Heptad-specific phosphorylation of RNA polymerase II CTD. Mol Cell. 2016;61:305–314. doi: 10.1016/j.molcel.2015.12.003. [DOI] [PubMed] [Google Scholar]
- 15.Harlen KM, et al. Comprehensive RNA polymerase II interactomes reveal distinct and varied roles for each phospho-CTD residue. Cell Rep. 2016;15:2147–2158. doi: 10.1016/j.celrep.2016.05.010. [DOI] [PMC free article] [PubMed] [Google Scholar]
- 16.Cramer P, et al. Architecture of RNA polymerase II and implications for the transcription mechanism. Science. 2000;288:640–649. doi: 10.1126/science.288.5466.640. [DOI] [PubMed] [Google Scholar]
- 17.Cramer P, Bushnell DA, Kornberg RD. Structural basis of transcription: RNA polymerase II at 2.8 angstrom resolution. Science. 2001;292:1863–1876. doi: 10.1126/science.1059493. [DOI] [PubMed] [Google Scholar]
- 18.Spåhr H, Calero G, Bushnell DA, Kornberg RD. Schizosacharomyces pombe RNA polymerase II at 3.6-A resolution. Proc Natl Acad Sci USA. 2009;106:9185–9190. doi: 10.1073/pnas.0903361106. [DOI] [PMC free article] [PubMed] [Google Scholar]
- 19.Meinhart A, Kamenski T, Hoeppner S, Baumli S, Cramer P. A structural perspective of CTD function. Genes Dev. 2005;19:1401–1415. doi: 10.1101/gad.1318105. [DOI] [PubMed] [Google Scholar]
- 20.Meredith GD, et al. The C-terminal domain revealed in the structure of RNA polymerase II. J Mol Biol. 1996;258:413–419. doi: 10.1006/jmbi.1996.0258. [DOI] [PubMed] [Google Scholar]
- 21.Tsai K-L, et al. A conserved Mediator-CDK8 kinase module association regulates Mediator-RNA polymerase II interaction. Nat Struct Mol Biol. 2013;20:611–619. doi: 10.1038/nsmb.2549. [DOI] [PMC free article] [PubMed] [Google Scholar]
- 22.Portz B, et al. Structural heterogeneity in the intrinsically disordered RNA polymerase II C-terminal domain. Nat Commun. 2017;8:15231. doi: 10.1038/ncomms15231. [DOI] [PMC free article] [PubMed] [Google Scholar]
- 23.Gibbs EB, et al. Phosphorylation induces sequence-specific conformational switches in the RNA polymerase II C-terminal domain. Nat Commun. 2017;8:15233. doi: 10.1038/ncomms15233. [DOI] [PMC free article] [PubMed] [Google Scholar]
- 24.Jasnovidova O, Stefl R. The CTD code of RNA polymerase II: A structural view. Wiley Interdiscip Rev RNA. 2013;4:1–16. doi: 10.1002/wrna.1138. [DOI] [PubMed] [Google Scholar]
- 25.Barillà D, Lee BA, Proudfoot NJ. Cleavage/polyadenylation factor IA associates with the carboxyl-terminal domain of RNA polymerase II in Saccharomyces cerevisiae. Proc Natl Acad Sci USA. 2001;98:445–450. doi: 10.1073/pnas.98.2.445. [DOI] [PMC free article] [PubMed] [Google Scholar]
- 26.Meinhart A, Cramer P. Recognition of RNA polymerase II carboxy-terminal domain by 3′-RNA-processing factors. Nature. 2004;430:223–226. doi: 10.1038/nature02679. [DOI] [PubMed] [Google Scholar]
- 27.Ni Z, et al. RPRD1A and RPRD1B are human RNA polymerase II C-terminal domain scaffolds for Ser5 dephosphorylation. Nat Struct Mol Biol. 2014;21:686–695. doi: 10.1038/nsmb.2853. [DOI] [PMC free article] [PubMed] [Google Scholar]
- 28.Grigoryan G, Degrado WF. Probing designability via a generalized model of helical bundle geometry. J Mol Biol. 2011;405:1079–1100. doi: 10.1016/j.jmb.2010.08.058. [DOI] [PMC free article] [PubMed] [Google Scholar]
- 29.Lunde BM, et al. Cooperative interaction of transcription termination factors with the RNA polymerase II C-terminal domain. Nat Struct Mol Biol. 2010;17:1195–1201. doi: 10.1038/nsmb.1893. [DOI] [PMC free article] [PubMed] [Google Scholar]
- 30.Jasnovidova O, Krejcikova M, Kubicek K, Stefl R. Structural insight into recognition of phosphorylated threonine-4 of RNA polymerase II C-terminal domain by Rtt103p. EMBO Rep. 2017;18:906–913. doi: 10.15252/embr.201643723. [DOI] [PMC free article] [PubMed] [Google Scholar]
- 31.Tria G, Mertens HDT, Kachala M, Svergun DI. Advanced ensemble modelling of flexible macromolecules using X-ray solution scattering. IUCrJ. 2015;2:207–217. doi: 10.1107/S205225251500202X. [DOI] [PMC free article] [PubMed] [Google Scholar]
- 32.Franke D, Svergun DI. DAMMIF, a program for rapid ab-initio shape determination in small-angle scattering. J Appl Crystallogr. 2009;42:342–346. doi: 10.1107/S0021889809000338. [DOI] [PMC free article] [PubMed] [Google Scholar]
- 33.Petoukhov MV, et al. New developments in the ATSAS program package for small-angle scattering data analysis. J Appl Crystallogr. 2012;45:342–350. doi: 10.1107/S0021889812007662. [DOI] [PMC free article] [PubMed] [Google Scholar]
- 34.Vasiljeva L, Kim M, Mutschler H, Buratowski S, Meinhart A. The Nrd1-Nab3-Sen1 termination complex interacts with the Ser5-phosphorylated RNA polymerase II C-terminal domain. Nat Struct Mol Biol. 2008;15:795–804. doi: 10.1038/nsmb.1468. [DOI] [PMC free article] [PubMed] [Google Scholar]
- 35.Xu X, Pérébaskine N, Minvielle-Sébastia L, Fribourg S, Mackereth CD. Chemical shift assignments of a new folded domain from yeast Pcf11. Biomol NMR Assign. 2015;9:421–425. doi: 10.1007/s12104-015-9622-2. [DOI] [PubMed] [Google Scholar]
- 36.Mei K, et al. Structural basis for the recognition of RNA polymerase II C-terminal domain by CREPT and p15RS. Sci China Life Sci. 2014;57:97–106. doi: 10.1007/s11427-013-4589-7. [DOI] [PubMed] [Google Scholar]
- 37.Becker R, Loll B, Meinhart A. Snapshots of the RNA processing factor SCAF8 bound to different phosphorylated forms of the carboxyl-terminal domain of RNA polymerase II. J Biol Chem. 2008;283:22659–22669. doi: 10.1074/jbc.M803540200. [DOI] [PubMed] [Google Scholar]
- 38.Kubicek K, et al. Serine phosphorylation and proline isomerization in RNAP II CTD control recruitment of Nrd1. Genes Dev. 2012;26:1891–1896. doi: 10.1101/gad.192781.112. [DOI] [PMC free article] [PubMed] [Google Scholar]
- 39.Noble CG, et al. Key features of the interaction between Pcf11 CID and RNA polymerase II CTD. Nat Struct Mol Biol. 2005;12:144–151. doi: 10.1038/nsmb887. [DOI] [PubMed] [Google Scholar]
- 40.Svergun DI. Restoring low resolution structure of biological macromolecules from solution scattering using simulated annealing. Biophys J. 1999;76:2879–2886. doi: 10.1016/S0006-3495(99)77443-6. [DOI] [PMC free article] [PubMed] [Google Scholar]
- 41.Mossessova E, Lima CD. Ulp1-SUMO crystal structure and genetic analysis reveal conserved interactions and a regulatory element essential for cell growth in yeast. Mol Cell. 2000;5:865–876. doi: 10.1016/s1097-2765(00)80326-3. [DOI] [PubMed] [Google Scholar]
- 42.Svergun D, Barberato C, Koch MHJ. CRYSOL–A program to evaluate X-ray solution scattering of biological macromolecules from atomic coordinates. J Appl Crystallogr. 1995;28:768–773. [Google Scholar]
- 43.Kozin MB, Svergun DI. Automated matching of high- and low-resolution structural models. J Appl Crystallogr. 2001;34:33–41. [Google Scholar]
- 44.Kuzmic P. DynaFit–A software package for enzymology. Methods Enzymol. 2009;467:247–280. doi: 10.1016/S0076-6879(09)67010-5. [DOI] [PubMed] [Google Scholar]
- 45.Kabsch W. XDS. Acta Crystallogr D Biol Crystallogr. 2010;66:125–132. doi: 10.1107/S0907444909047337. [DOI] [PMC free article] [PubMed] [Google Scholar]
- 46.Evans P. Scaling and assessment of data quality. Acta Crystallogr D Biol Crystallogr. 2006;62:72–82. doi: 10.1107/S0907444905036693. [DOI] [PubMed] [Google Scholar]
- 47.Winn MD, et al. Overview of the CCP4 suite and current developments. Acta Crystallogr D Biol Crystallogr. 2011;67:235–242. doi: 10.1107/S0907444910045749. [DOI] [PMC free article] [PubMed] [Google Scholar]
- 48.Adams PD, et al. The Phenix software for automated determination of macromolecular structures. Methods. 2011;55:94–106. doi: 10.1016/j.ymeth.2011.07.005. [DOI] [PMC free article] [PubMed] [Google Scholar]
- 49.McCoy AJ, Storoni LC, Read RJ. Simple algorithm for a maximum-likelihood SAD function. Acta Crystallogr D Biol Crystallogr. 2004;60:1220–1228. doi: 10.1107/S0907444904009990. [DOI] [PubMed] [Google Scholar]
- 50.Grosse-Kunstleve RW, Adams PD. Substructure search procedures for macromolecular structures. Acta Crystallogr D Biol Crystallogr. 2003;59:1966–1973. doi: 10.1107/s0907444903018043. [DOI] [PubMed] [Google Scholar]
- 51.Terwilliger T. SOLVE and RESOLVE: Automated structure solution, density modification and model building. J Synchrotron Radiat. 2004;11:49–52. doi: 10.1107/s0909049503023938. [DOI] [PubMed] [Google Scholar]
- 52.Terwilliger TC, et al. Decision-making in structure solution using Bayesian estimates of map quality: The PHENIX AutoSol wizard. Acta Crystallogr D Biol Crystallogr. 2009;65:582–601. doi: 10.1107/S0907444909012098. [DOI] [PMC free article] [PubMed] [Google Scholar]
- 53.Cowtan K. The Buccaneer software for automated model building. 1. Tracing protein chains. Acta Crystallogr D Biol Crystallogr. 2006;62:1002–1011. doi: 10.1107/S0907444906022116. [DOI] [PubMed] [Google Scholar]
- 54.Emsley P, Cowtan K. Coot: Model-building tools for molecular graphics. Acta Crystallogr D Biol Crystallogr. 2004;60:2126–2132. doi: 10.1107/S0907444904019158. [DOI] [PubMed] [Google Scholar]
- 55.McCoy AJ, et al. Phaser crystallographic software. J Appl Crystallogr. 2007;40:658–674. doi: 10.1107/S0021889807021206. [DOI] [PMC free article] [PubMed] [Google Scholar]
- 56.Afonine PV, et al. Towards automated crystallographic structure refinement with phenix.refine. Acta Crystallogr D Biol Crystallogr. 2012;68:352–367. doi: 10.1107/S0907444912001308. [DOI] [PMC free article] [PubMed] [Google Scholar]
- 57.Pettersen EF, et al. UCSF Chimera–A visualization system for exploratory research and analysis. J Comput Chem. 2004;25:1605–1612. doi: 10.1002/jcc.20084. [DOI] [PubMed] [Google Scholar]
- 58.Walshaw J, Woolfson DN. Socket: A program for identifying and analysing coiled-coil motifs within protein structures. J Mol Biol. 2001;307:1427–1450. doi: 10.1006/jmbi.2001.4545. [DOI] [PubMed] [Google Scholar]
- 59.Larkin MA, et al. Clustal W and Clustal X version 2.0. Bioinformatics. 2007;23:2947–2948. doi: 10.1093/bioinformatics/btm404. [DOI] [PubMed] [Google Scholar]
Associated Data
This section collects any data citations, data availability statements, or supplementary materials included in this article.


