Abstract
Menopause is associated with bone loss and enhanced visceral adiposity. We have shown previously that a polyclonal antibody (Ab) to the β-subunit of the pituitary hormone Fsh increases bone mass in mice. Here, we report that this Ab sharply reduces adipose tissue in wild type mice, phenocopying genetic Fshr haploinsufficiency. The Ab also causes profound beiging, increases cellular mitochondrial density, activates brown adipose tissue, and enhances thermogenesis. These actions result from the specific binding of Ab to Fshβ to block its action. Our studies uncover novel opportunities for co-treating obesity and osteoporosis.
Fsh favors mammalian procreation by synthesizing and releasing estrogen from ovarian follicles. Circulating FSH levels become elevated in response to ovarian failure as the ability to procreate ceases at menopause. It is during the late perimenopause, a period characterized by relatively stable estrogen and rising FSH levels, that bone loss occurs at its most rapid rate1, 2. There is also a sharp increase in visceral adiposity during this life stage, which coincides with the emergence of disrupted energy balance and reduced physical activity3. While the subsequent decline in estrogen explains menopausal bone loss in large part, effects of estrogen deprivation on visceral fat and whole body metabolism remain less clear4. We therefore questioned whether, by targeting FSH, we could not only prevent bone loss, but also reduce visceral adiposity and improve energy homeostasis.
Fsh Ab Reduces High Fat Diet-Induced Obesity
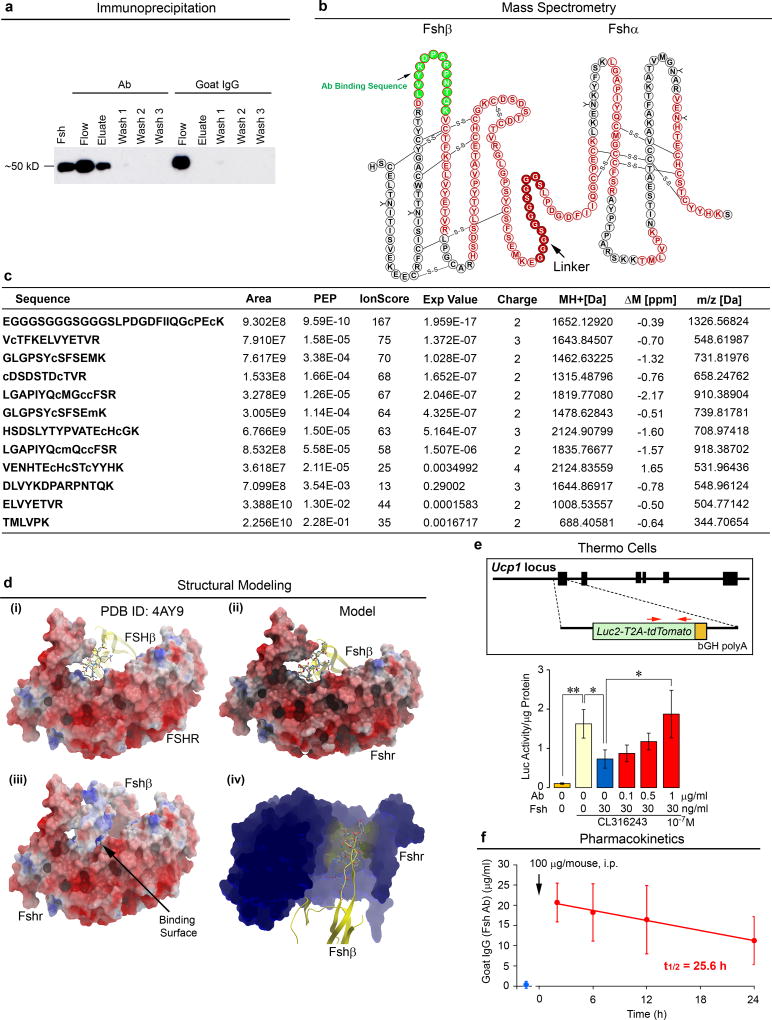
A polyclonal antibody (Ab), raised to a 13-amino acid Fshβ sequence, LVYKDPARPNTQK, inhibits ovariectomy-induced bone loss5–7. To establish that the Ab binds to and interrupts the interaction of Fshβ with its receptor, recombinant mouse Fsh was passed through resin with immobilized Fsh Ab or goat IgG, and fractions immunoblotted with a monoclonal Fsh Ab (Hf2) raised against the human LVYKDPARPKIQK motif. Extended Data Fig. 1a shows a ~50 kD band in both elution and flow-through fractions passed through immobilized Fsh Ab, whereas with immobilized goat IgG, all protein appeared in flow-through. LC-MS/MS of the Ab-immunoprecipitated eluate yielded 10 peptides corresponding to the Fshα-Fshβ chimera (Extended Data Figs. 1b and 1c), definitively establishing Fsh as the binding target of the Ab.
We questioned whether the Ab, which was raised to the LVYKDPARPNTQK sequence6, could block the interaction of Fsh with the mouse Fshr (Extended Data Fig. 1d). The crystal structure of the human FSH-FSHR complex (PDB ID 4AY9) with the motif LVYKDPARPKIQK was used to model mouse Fsh(LVYKDPARPNTQK)-Fshr interactions (Extended Data Fig. 1d). Importantly, the loop from Fshβ (yellow) containing the peptide sequence tucked into a small groove in the Fshr, so that binding of an Ab to this sequence would inevitably block access of Fshβ to its Fshr binding site (Extended Data Fig. 1d–iv). To test whether the Ab reverses Fsh-induced inhibition of Ucp1, a master regulator of adipocyte beiging and thermogenesis8, 9, we used immortalized dedifferentiated brown adipocytes derived from the ThermoMouse (a.k.a. Thermo cells), in which the Ucp1 promoter drives a Luc2-T2A–tdTomato reporter10 (Extended Data Fig. 1e). Exogenous Fsh (30 ng/mL) inhibited Luc2 activity in medium devoid of Fsh, and Ab reversed this inhibition in a concentration-dependent manner (complete at 1 µg/mL Ab). To determine whether a serum concentration of at least 1 µg/mL would result from a single i.p. injection of 100 µg Ab, we performed ELISAs. Mice injected with Ab revealed a sharp increase in plasma Fsh Ab, measured as goat IgG, at 2 hours and levels remained at ≥10 µg/mL up to at least 24 hours (t1/2 = 25.6 hours) (Extended Data Fig. 1f).
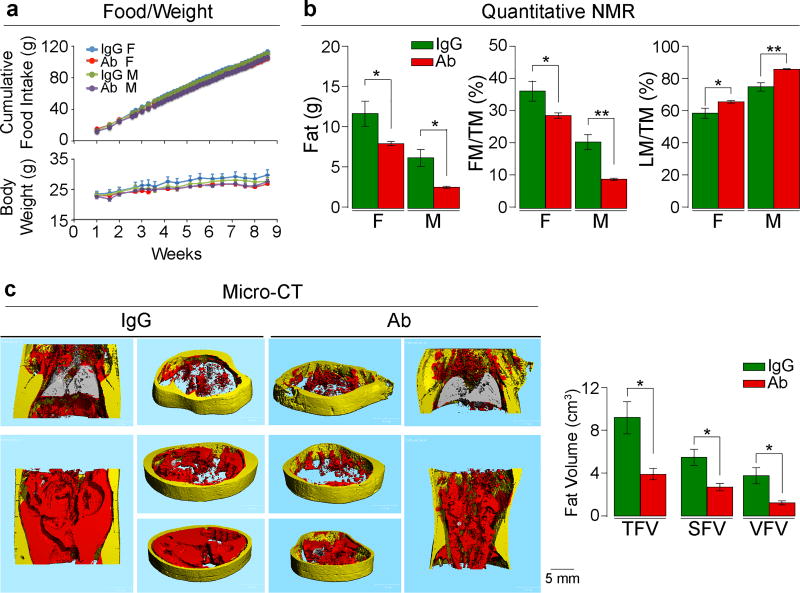
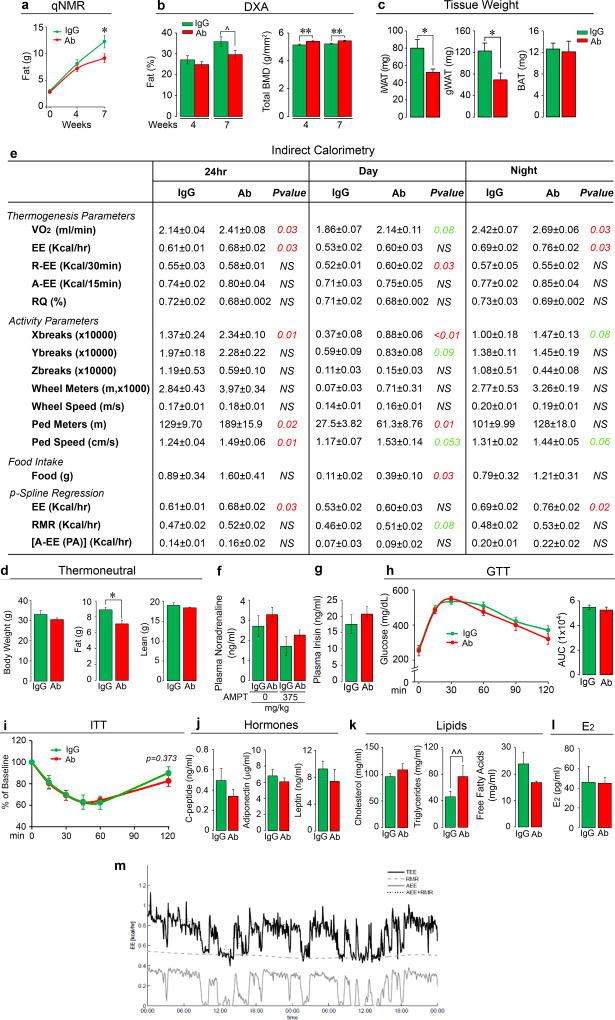
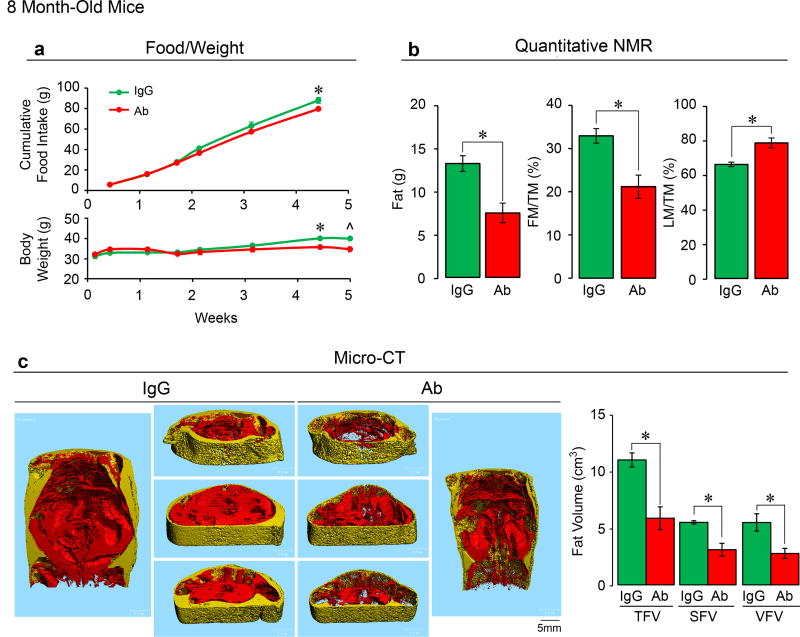
Independently, the laboratories of M.Z. and C.J.R. examined the effect of Fsh Ab or goat IgG, injected at 200 µg/day, i.p., on fat mass in 3-month-old wild type male and female C57BL/6J mice, which were either pair-fed on, or allowed ad libitum access to, a high-fat diet. Body weight increased over 8 weeks with near-equal food intake in both male and female mice, with no significant difference in either sex between Ab and goat IgG (Fig. 1a). Quantitative NMR (qNMR) showed a reduction in body fat and an increase in lean mass/total mass (LM/TM) in mice treated with Ab (Fig. 1b). Data were reproduced using qNMR, dual energy X-ray absorptiometry (DXA), and tissue weight measurements at 7 weeks (Extended Data Figs. 2a–c). DXA also showed a significant increase in bone mineral density at both 4 and 7 weeks (Extended Data Fig. 2b). Micro-computed tomography (micro-CT) of distinct thoracoabdominal WAT compartments revealed significant decreases in visceral and subcutaneous adiposity in Ab-treated mice (Fig. 1c). Namely, total (TFV), subcutaneous (SFV) and visceral fat volume (VFV) were all lower in Ab- versus IgG-treated groups (Fig. 1c). No difference was observed in interscapular brown adipose tissue (BAT) by weight (Extended Data Fig. 2c). Similar results were obtained using 8-month-old mice (Extended Data Fig. 3), and under thermoneutral conditions at 30°C (Extended Data Fig. 2d).
Figure 1. Fsh Antibody Reduces Obesity in Mice on a High-Fat Diet.
Fsh antibody (Ab) or goat IgG (200 µg/day/mouse, i.p.) injected for 8 weeks into 3-month-old female (F) and male (M) C57BL/6J mice pair-fed on high-fat diet. Shown are food intake and body weight (a); fat mass, fat mass/total mass (FM/TM) and lean mass/TM (LM/TM) by quantitative NMR (n=4 or 5 mice/group) (b); and total (TFV), subcutaneous (SFV) and visceral (VFV) fat volume by micro-CT (representative coronal and transverse sections from the same experiment; visceral, red; subcutaneous, yellow) (n=5 mice/group) (c). Two-tailed Student’s T-test; *P≤0.05, **P≤0.01; mean ± SEM.
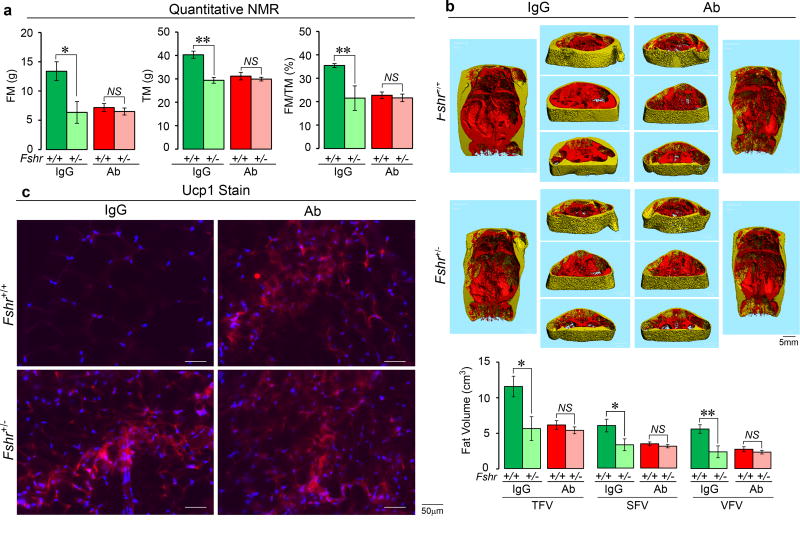
We tested the hypothesis that Fshr-deficient mice will phenocopy the effect of Ab treatment, and that the anti-adiposity actions of the Fsh Ab will be attenuated in genetic Fshr deficiency. IgG-treated male Fshr+/− mice showed reductions in total and fat mass on qNMR, and in TFV, SFV and VFV on micro-CT (Extended Data Figs. 4a and 4b). There was no further reduction in any parameter when the Fshr+/− mice were treated with Ab (Extended Data Figs. 4a and 4b), proving that the Ab acts by suppressing the Fsh axis in vivo. Equally importantly, that haploinsufficient Fshr+/− mice phenocopied the anti-adiposity actions of Fsh Ab suggests that Fsh is a dominant physiologic regulator of fat mass.
On indirect calorimetry using metabolic cages, mice treated with Ab showed increases in energy expenditure (EE) and oxygen consumption (VO2), which were accompanied by increased physical activity parameters, including X-beam breaks and walking distance and speed (Extended Data Fig. 2e). Independently performed penalized spline (p-Spline) regression showed that physical activity, mainly consisting of walking (not running), did not contribute to the increased EE (Extended Data Fig. 2e). Specifically, EE due to physical activity [A-EE (PA)] was not different between Ab- and IgG-treated groups. Instead, mice displayed an elevated daytime resting EE (R-EE), which corresponded to the noted trend (P=0.08) in resting metabolic rate (RMR) on p-Spline regression. The latter findings together suggest that Ab-induced beiging, rather than physical activity, contributes to thermogenesis and leanness, similarly to other studies11, 12. This is fully consistent with Ab-induced increases in Ucp1 in both BAT and WAT, as noted below.
We explored known links of physical activity with endocrine mediators of beiging or leanness, which can also affect bone mass13–15. Groups of mice fed on high fat diet were injected with Ab or IgG (200 µg/mouse/day) for 7 weeks, following which half of each group received the tyrosine hydroxylase inhibitor alpha-methyl-p-tyrosine (AMPT). Plasma noradrenaline levels were not significantly different between IgG- and Ab-treated groups either without or following AMPT (Extended Data Fig. 2f). Likewise, plasma irisin levels were indistinguishable between IgG- and Ab-treated mice (Extended Data Fig. 2g), and meteorin-like (metrnl) remained undetectable in plasma.
Both glucose tolerance (GTT) and insulin tolerance testing (ITT) showed no improvements with Ab (Extended Data Figs. 2h and 2i). Consistent with this, plasma C-peptide, adiponectin and leptin levels were unchanged (Extended Data Fig. 2j). Circulating total cholesterol and free fatty acids were also not different, but there was a marginal increase in plasma triglycerides in Ab-treated mice (Extended Data Fig. 2k). Ab also did not affect serum estradiol (E2) levels (Extended Data Fig. 2l).
Fsh Ab Reduces Adiposity in Ovariectomized Mice
The perimenopausal transition is associated with increases in total body fat and decrements in energy expenditure and physical activity, all of which impact quality of life3. This clinical phenotype has often been documented in rodents post-ovariectomy, as well as in chronic hypoestrogenemic models, such as in female Erα−/−, aromatase−/− and Fshr−/− mice4, 16–18, although in our hands, female Fshr−/− mice are not obese. While in female mice, genetic Fshr deficiency does not seem to protect against the pro-adiposity effects of severe chronic hypoestrogenemia, we questioned whether acute suppression of Fsh by an Fsh Ab can, through parallel mechanisms, not only attenuate bone loss6, but also reduce body fat and improve energy homeostasis. Clinically, this is important during the late perimenopause, when the onset of central adiposity is accompanied by relatively stable estrogen and increasing Fsh levels1.
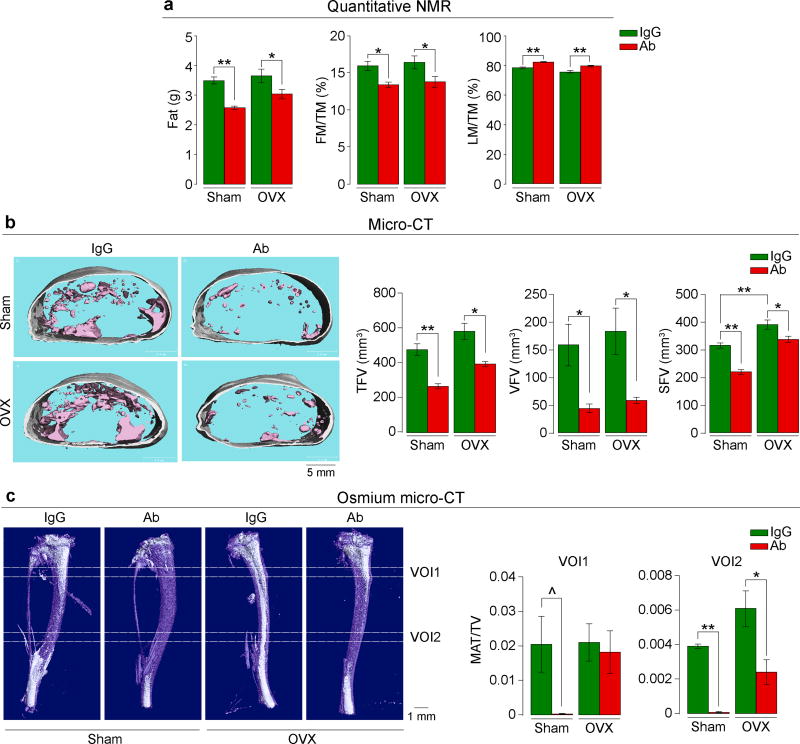
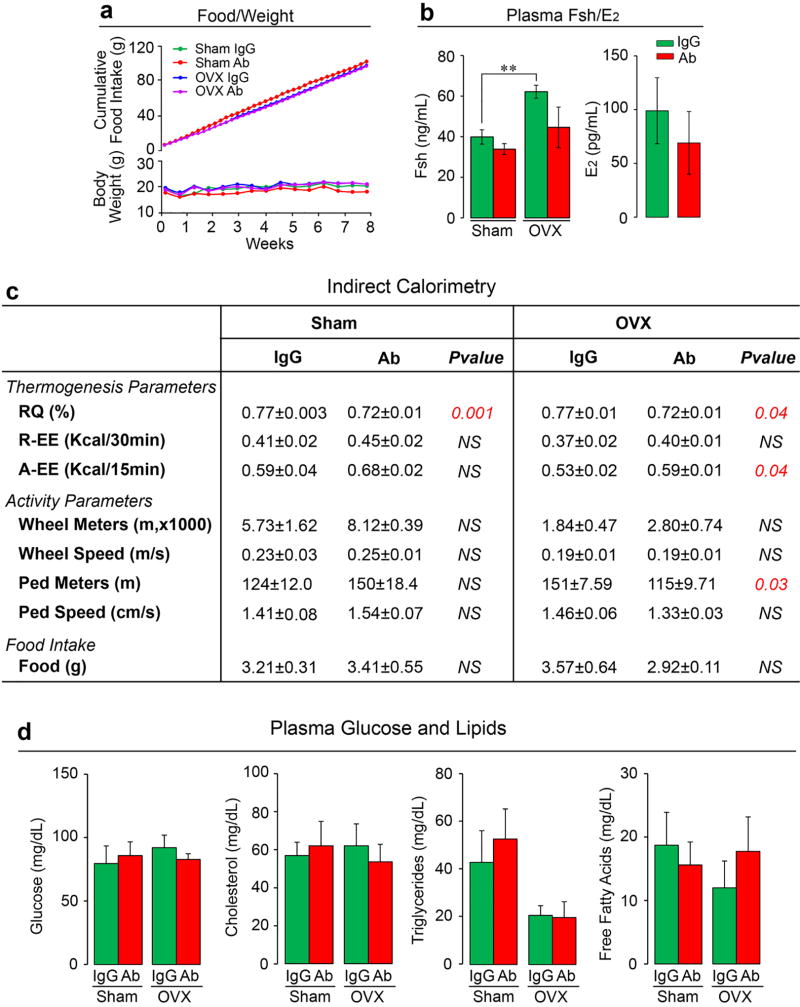
We pair-fed female mice with normal chow, so that their food intake was near-identical over 8 weeks of treatment with Fsh Ab or IgG given i.p. post-ovariectomy or sham-operation. Unlike mice fed on a high fat diet (Fig. 1a), these mice on normal chow did not show an increase in total body weight over time (Extended Data Fig. 5a). However, Ab-treated sham-operated mice showed a significantly reduced body weight compared to IgG injected mice (Excel Spreadsheet for Extended Data Fig. 5a; c.f. Extended Data Fig. 6a). Quantitative NMR showed a significant reduction in fat mass and increased LM/TM with Ab in both the sham-operated and ovariectomized groups (Fig. 2a). Ab also reduced TFV, VFV and SFV significantly in both groups (Fig. 2b). Furthermore, osmium micro-CT revealed decrements in marrow adipose volume in Ab-treated mice (Fig. 2c). Ovariectomy expectedly resulted in a significant increase in plasma Fsh levels (Extended Data Figure 5b). To ensure that a higher circulating Fsh is blocked effectively, we used 200 or 400 µg/mouse/day of Ab in the ovariectomy group, as opposed to a 100 µg/mouse/day dose in sham-operated group. Of note, despite Fsh being bound to Ab (Extended Data Fig. 1a), total plasma Fsh levels (ELISA) were not significantly different between Ab- and IgG-treated mice (Extended Data Figure 5b), confirming previous data6. Also, while serum estrogen levels trended to be lower, there was no significant difference between Ab- or IgG-treated groups as noted previously6 (Extended Data Figure 5b and Figure 2l).
Figure 2. Fsh Antibody Reduces Adiposity in Ovariectomized Mice.
Ovariectomized or sham-operated mice on normal chow injected with Fsh antibody (Ab) or goat IgG (200–400 µg/day) for 8 weeks. Shown are fat mass, fat mass/total mass (FM/TM) and lean mass/TM (LM/TM) (n=5 or 9 mice/group, pooled) (a). Total (TFV), visceral (VFV) and subcutaneous (SFV) fat volume in mice fed ad libitum (transverse sections; pink, visceral; white, subcutaneous) (n=5 mice/group) (b). Bone marrow adipose tissue (white) quantitated as MAT/total volume (TV) at two voxels of interest (VOI1 and VOI2) (n=3 mice/group) (c). Images in (b) and (c) are from the respective experiments. Two-tailed Student’s T-test; ^P=0.067, *P≤0.05, **P≤0.01; mean ± SEM.
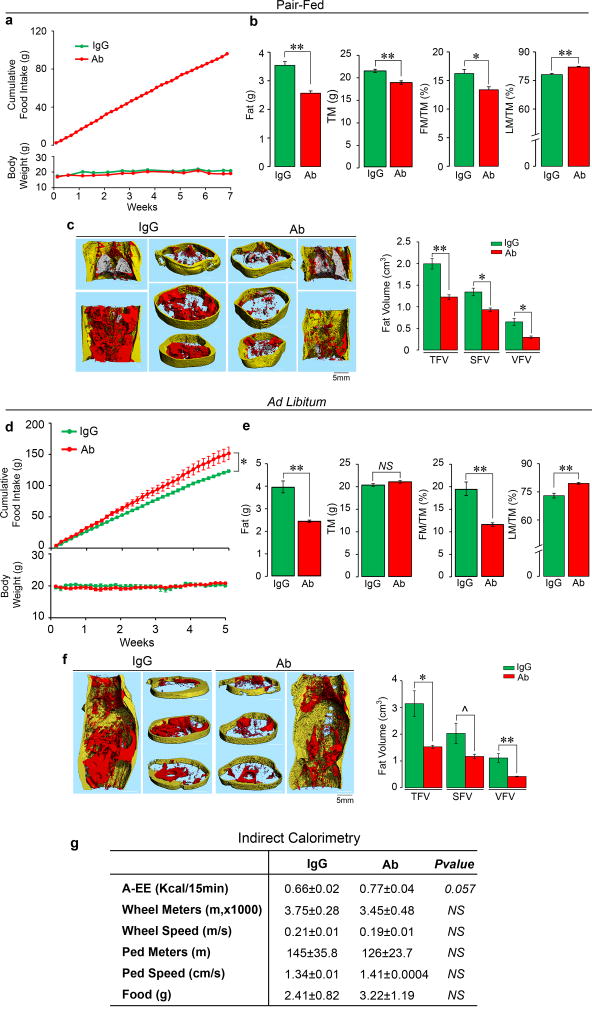
It was interesting that sham-operated mice were equally responsive to Ab (Fig. 2). We thus repeated the study using 3-month-old C57BL/6J mice that were either pair-fed or given normal chow ad libitum (see Methods for details) (Extended Data Fig. 6). There were significant reductions in total body weight at various time points in mice pair fed on chow (Extended Data Fig. 5a and Fig. 6a and Excel Spreadsheets). The Ab also reduced fat mass and FM/TM, as well as abdominal TFV, SFV and VFV (Extended Data Figs. 6b and 6c). In contrast, when allowed ad libitum access to chow, despite their increased food intake, Ab-injected mice did not show a decrease in total body weight, but displayed similar reductions in fat mass, and abdominal TFV, SFV and VFV (Extended Data Figs. 6d–f, and accompanying Excel Spreadsheets).
Indirect calorimetry showed that the Fsh Ab enhanced active EE and reduced RQ in sham-operated and/or ovariectomized mice (Extended Data Fig. 5c). These thermogenic responses were not associated with significant increases in parameters of physical activity; instead, there was an unexplained decrease in walking distance in the ovariectomized Ab-treated group (Extended Data Fig. 5c). Likewise, a marginal increase in active EE with Ab was noted in wild type mice on normal chow with no change in physical activity (Extended Data Fig. 6g). Overall, therefore, physical activity did not contribute to Ab-induced thermogenesis, or indeed, leanness in ovariectomized or wild type mice on normal chow. There were no differences in plasma levels of glucose, cholesterol, triglyceride or free fatty acids between IgG- and Ab-treated groups on normal chow (Extended Data Fig. 5d).
Blocking Adipocyte Fshrs Induces Ucp1 Expression
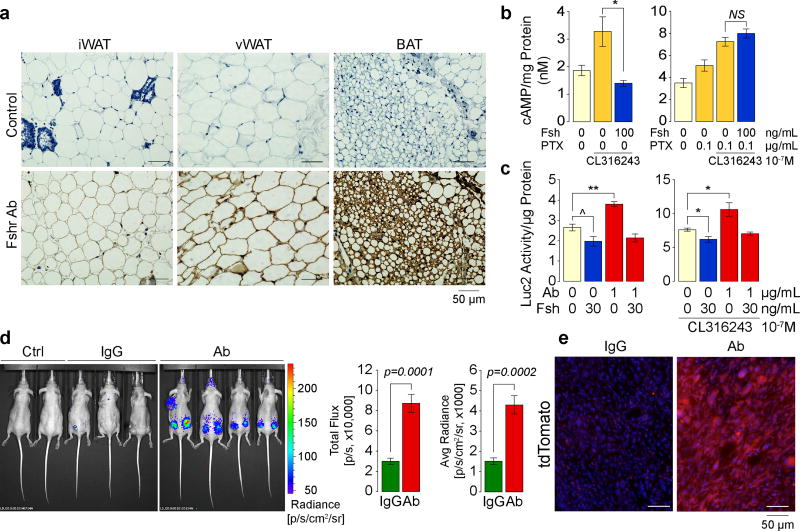
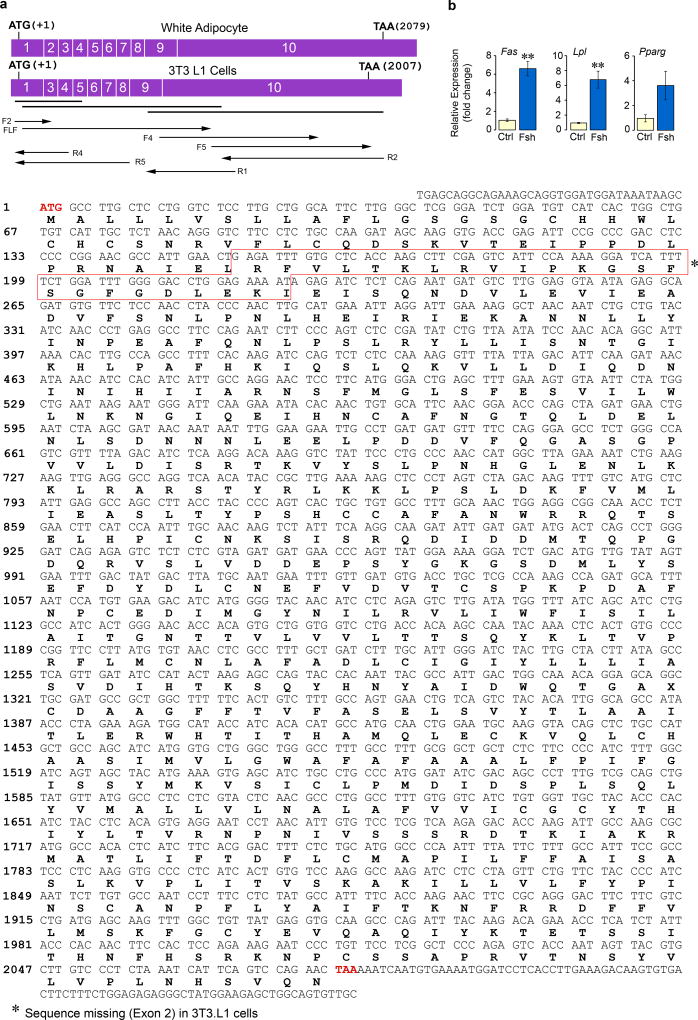
Fshr cDNA and protein has been identified in fat tissue and adipocytes19, 20, as well as by us, on osteoclasts and mesenchymal stem cells5, 6. Here, we have Sanger sequenced full-length Fshr cDNA from primary murine mesenchymal stem cells derived from ear lobes (MSC-ad) and 3T3.L1 cells (Extended Data Fig. 7a). The Fshr protein, which we confirm through immunostaining of inguinal and visceral white adipose tissue (WAT) and brown adipose tissue (BAT) (Fig. 3a), is signaling-efficient and functional in its ability to inhibit cAMP (Fig. 3b) and stimulate the lipogenic genes Fas and Lpl (Extended Data Fig. 7b). However, in contrast to its coupling with Gs in ovarian follicular cells, the adipocyte Fshr couples to Gi5, 20. Thus, in differentiated 3T3.L1 adipocytes, while Fsh abrogated the increase in cAMP triggered by the Arb3 agonist CL-316,243, this inhibition was reversed in the presence of the Gi inhibitor pertussis toxin (Fig. 3b).
Figure 3. Ab Blocks Fsh-Fshr Interaction to Activate Ucp1.
Immunostaining with an anti-Fshr antibody of inguinal (iWAT) and visceral WAT (vWAT) and BAT sections (see Methods) (representative from 4 mice/group) (a). Cyclic AMP levels in differentiated 3T3.L1 cells (3 biologic samples, in duplicate) (b). Luc2 activity in Thermo cells cultured in 10% (v/v) FBS (containing Fsh) (three biological replicates) (c). Luc2 radiance in nu/nu mice (normal chow) injected with Ab or IgG (200 µg/day, i.p., 8 weeks) after implantation of 1.5×10⁶ Thermo cells into both flanks (two mice were also transplanted in upper trunk) (3 and 4 mice/group) (d). Ctrl: two non-transgenic mice injected with D-Luciferin. (e) tdTomato fluorescence in frozen sections of cell-implanted areas from the experiment in (d). Two-tailed Student’s T-test, *P≤0.05, **P≤0.01, ^P=0.0756; mean ± SEM.
As elevated cAMP by Arb3 signaling stimulates Ucp121, we explored whether Fsh inhibited this induction of Ucp1 using Thermo cells (ref: Extended Data Fig. 1e). Experiments in the presence of serum, which contains Fsh at 15–40 ng/mL22, showed that the Ab (1 µg/mL) induced Luc2 (Ucp1) expression without Fsh addition, irrespective of the presence of CL-316,243 (Fig. 3c). This stimulation was reversed by the further addition of Fsh (30 ng/mL), establishing Fsh specificity (Fig. 3c, c.f. Extended Data Fig. 1e). We implanted Thermo cells into both flanks of 3-month-old nu/nu mice and injected IgG or Ab (200 µg/mouse/day) for 8 weeks. A dramatic increase in Luc2 radiance was noted upon injection of D-Luciferin (Fig. 3d). For confirmation, we examined tdTomato fluorescence (red) in iWAT frozen sections. Consistent with enhanced Luc2 radiance, Ab-treated mice showed a marked increase in tdTomato expression (Fig. 3e). Together, the data suggest that the Ab, by blocking Fsh action on the Fshr, activates Ucp1.
Fsh Ab Triggers Beiging of White Adipocytes
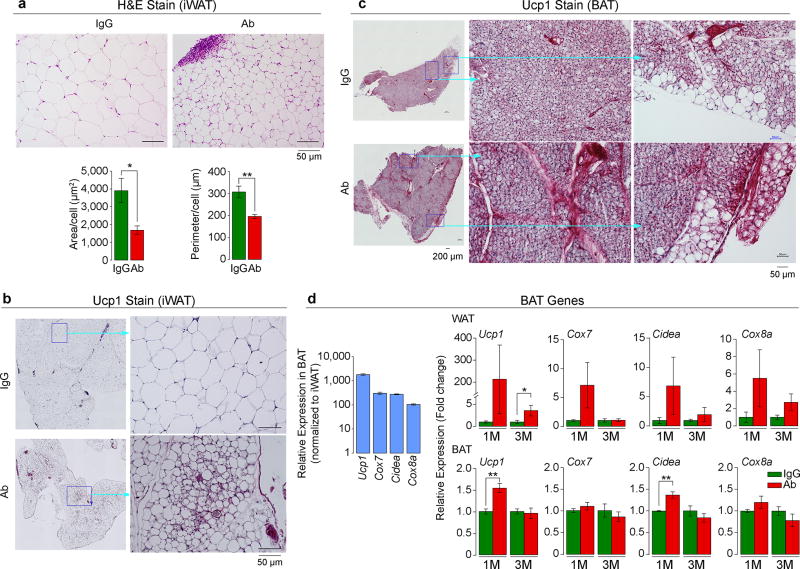
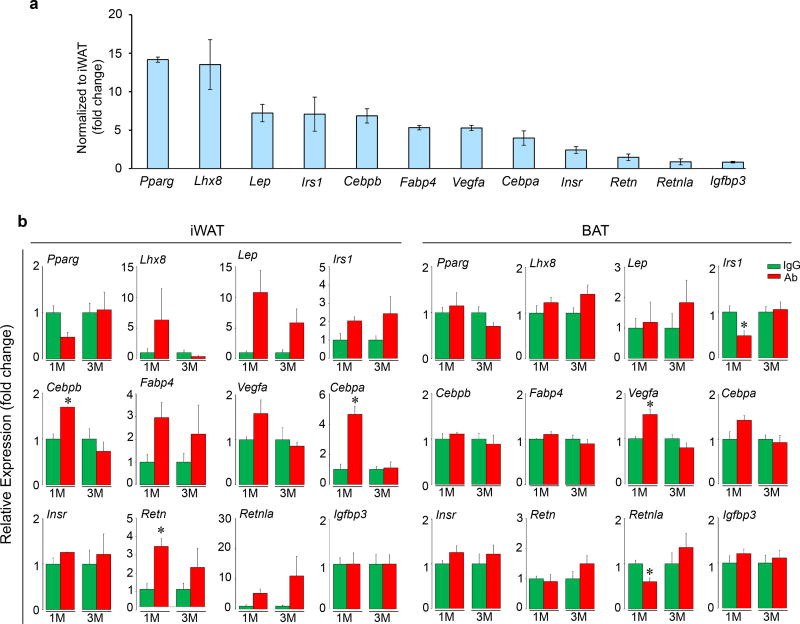
To determine whether the Fsh Ab induces Ucp1-rich beige-like adipose tissue in vivo, wild type mice pair-fed on high-fat diet were injected with Ab or IgG. Ab-treated mice displayed marked reductions in adipocyte area and perimeter in sections of inguinal fat pads, consistent with adipocyte beiging23 (Fig. 4a). Furthermore, there was a marked increase in Ucp1 immunolabeling both in iWAT and BAT (Figs. 4b and 4c). This was accompanied at 1 and/or 3 months with increases in the expression in iWAT of browning genes24, 25 (Fig. 4d and Extended Data Fig. 8). Increases were also noted in Ucp1, Cidea, Cebpa, and Vegfa expression in BAT at 1 month, commensurate with the early activation of the thermogenic gene program (Fig. 4d and Extended Data Fig. 8).
Figure 4. Fsh Ab Induces Beige-Like Adipose Tissue.
Cell size and perimeter in hematoxylin/eosin-stained sections of inguinal white adipose tissue (iWAT) (a), as well as Ucp1 immunostaining of iWAT (b) and BAT (c) following injection of Fsh antibody (Ab) or goat IgG (200 µg/mouse, i.p., 8 weeks) to 3 month-old C57BL/6J mice pair-fed on high-fat diet (n=4 or 5 mice/group). (d) Relative expression of genes in BAT and WAT at 1 and/or 3 months of Ab or IgG treatment (M) (normalized to housekeeping genes and to IgG) (3 or 6 biologic replicates, in triplicate, by qPCR). Two-tailed Student’s T-test; mean ± SEM; *P≤0.05, **P≤0.01.
Faithfully phenocopying the effect of Ab, subcutaneous WAT from Fshr+/− mice treated with IgG showed evidence of smaller, beige-like adipocytes with more intense Ucp1 immunostaining (Extended Data Fig. 4c). This effect was not enhanced with Ab injections into Fshr+/− mice, again confirming Fsh Ab specificity (Extended Data Fig. 4c). We are currently uncertain whether Fsh Ab-induced beige adipocytes are derived from a committed adipogenic precursor, or from the conversion of mature white adipocytes, or represent a combination of both mechanisms26, 27.
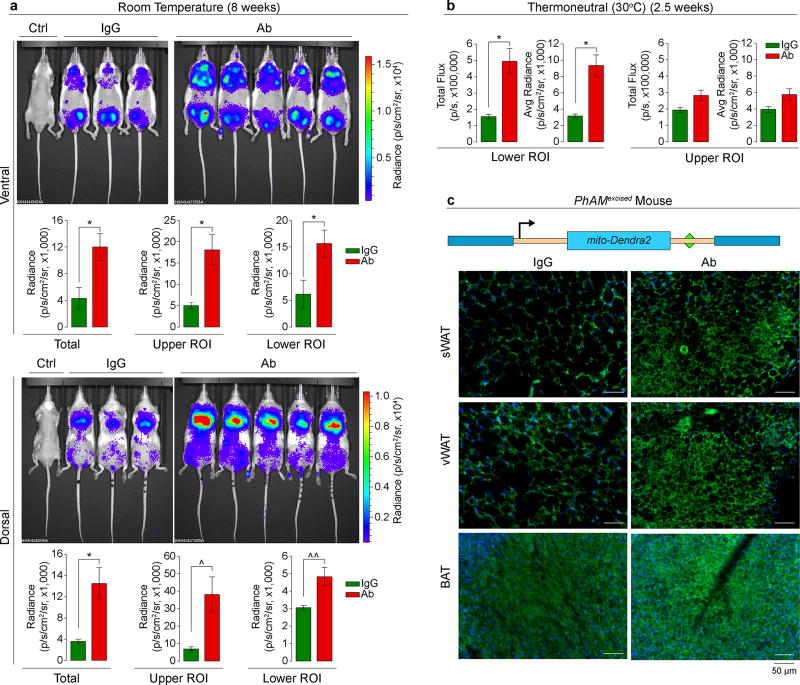
As a complementary in vivo test for beiging, we imaged SV129 ThermoMice (Fig. 5), in which a transgenic Ucp1 promoter drives the Luc2-T2A–tdTomato reporter10 (Extended Data Fig. 1e). ThermoMice were pair-fed on a high-fat diet and injected with Ab or IgG (200 µg/mouse/day). We measured Luc2 radiance from both ventral and dorsal surfaces for optimal visualization of inguinal (WAT-rich plus testes) and interscapular (BAT-rich) regions, respectively. Control non-transgenic mice injected with D-luciferin showed no emitted radiance. Ab triggered marked increases in Luc2 radiance, prominently in the inguinal region, at 8 weeks (Fig. 5a). Importantly, these increases were equally pronounced with a short, 2.5-week treatment under thermoneutrality (30°C) (Fig. 5b; also refer to: Extended Data Fig. 2d). These data together confirm that Ab triggers beiging, which does not result from environmental cold exposure.
Figure 5. Fsh Ab Triggers Ucp1 Activation and Enhances Mitochondrial Biogenesis.
Three-month-old male ThermoMice pair-fed on high-fat diet and treated with Fsh antibody (Ab) or goat IgG (200 µg/mouse) for 8 weeks at room temperature (n as shown) (a) or 2.5 weeks at thermoneutral (30°C) conditions (n=3 or 4 mice/group) (b). ROI, region of interest. Ctrl, non-transgenic mice injected with D-Luciferin. Two-tailed Student’s T-test; *P≤0.05, ^P=0.060, ^^P=0.051; mean ± SEM. Construct used to generate the PhAMexcised mouse (mito: Cox8 mitochondria-localizing signal)30. Fluorescence captured in subcutaneous WAT (sWAT), visceral WAT (vWAT) and BAT after 2 weeks of Ab or IgG injection (c). Representative images from experiment using 3 mice/group.
Beiging is associated with an increase in mitochondrial density28, 29. We used the PhAMexcised mouse, in which a fluorescent protein from the octocoral Dendronephthya, Dendra2, is fused to a Cox8 mitochondrial targeting signal, yielding mito-Dendra2 (Fig. 5c)30. Frozen sections of sWAT, vWAT and BAT from Ab-treated PhAMexcised mice (4 weeks) showed a dramatic increase in fluorescence, and smaller, more condensed, adipocytes in WAT (Fig. 5c). These data show that Fsh blockade induces mitochondrial biogenesis, which is consistent with Ucp1 activation.
DISCUSSION
The long-held belief that pituitary hormones act solely on master targets was first questioned when we documented GPCRs for Tsh, Fsh, Acth, oxytocin and vasopressin on bone cells5, 31–33. These evolutionarily conserved hormones and their receptors have primitive roles, and exist in invertebrate species as far down as coelenterates. It is not surprising therefore that each such hormone has multiple hitherto unrecognized functions in mammalian integrative physiology, and hence, becomes a potential target for therapeutic intervention.
Here, we confirm in two separate laboratories that blocking the access of Fsh to its receptor using an epitope-specific polyclonal Ab results not only in increased bone mass6, but also in a remarkable reduction in adiposity, coupled with the production of mitochondria-rich, Ucp1-high thermogenic adipose tissue. Fsh inhibits Ucp1 expression by reducing cAMP levels, with the Ab causing a sharp, time-dependent increase in Ucp1 in both BAT and WAT compartments. The latter effects, best observed in the ThermoMouse, are associated with alterations in cell morphology, gene expression, and mitochondrial biogenesis that are all consistent with adipocyte beiging.
The use of anti-obesity agents, consisting mainly of those that reduce appetite or inhibit nutrient absorption, is compromised by issues of poor efficacy and unacceptable side effects34. Thus, the therapeutic armamentarium for obesity currently pales in comparison with that of other public health hazards of similar or lesser magnitudes, such as hypertension, diabetes or osteoporosis. Among targets that induce beige adipose tissue, the Arb3 pathway with its numerous downstream molecules, prominently C/EBPβ and PRDM16, are best characterized24, 25, 34, 35, but agents that modulate these are not sufficiently well developed to be tested in people34. Moreover, potential targets, such as C/EBPβ and PPARG, are expressed ubiquitously and during growth and development, which makes tissue specificity an issue.
Previous human studies and particularly the Study of Women’s Health Across the Nations (SWAN), an observational cohort of pre-, peri-, and postmenopausal women followed over a decade, have suggested that a phase of rapid bone loss ensues two to three years prior to the onset of menopause when FSH levels are rising and estrogen levels are relatively stable1, 2. Furthermore, even after the onset of menopause, estrogen replacement therapy does not always suppress serum FSH levels into the premenopausal range36, and women often continue to lose bone and further accrue visceral fat. Our study supports these tenets, but more importantly provides mechanistic insights into the clinical problem of peri- and postmenopausal weight gain and disrupted energy balance3, 4. With that said, high FSH levels during puberty in both sexes have been reported to coincide with increases in thermogenic BAT. This apparent discrepancy may arise from concurrent increases in sex steroids, specifically androgens, which are known to enhance BAT activity37.
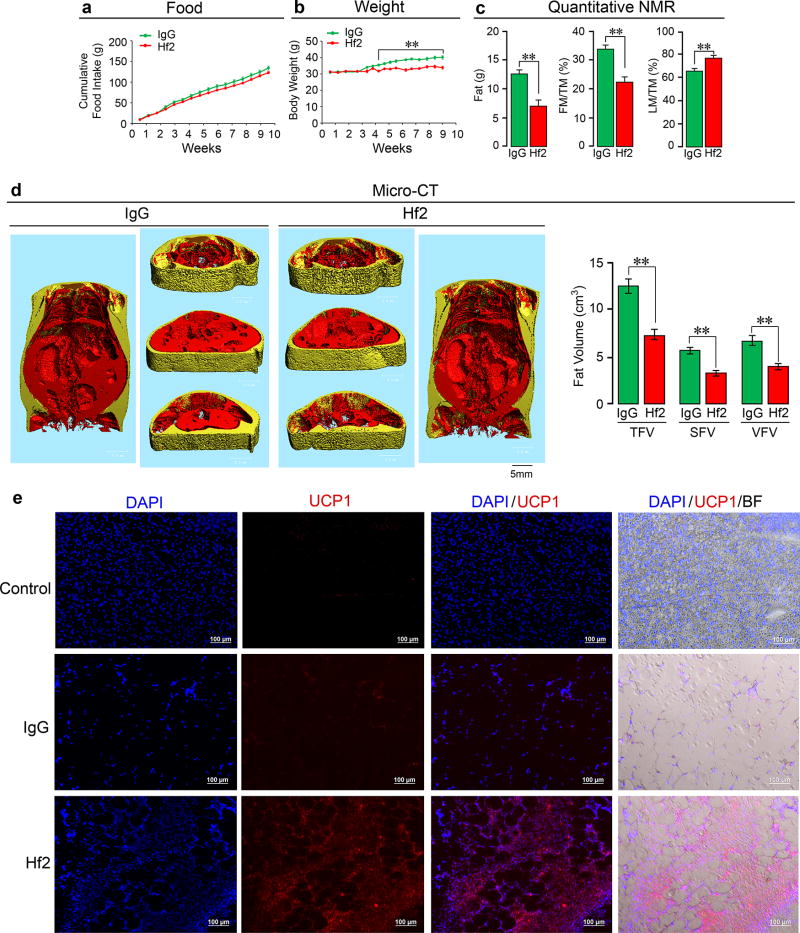
In view of evidence for white adipose tissue beiging and reduced adiposity with our polyclonal Fsh Ab, we have gone on to develop a monoclonal Ab, Hf2, to a corresponding human FSHβ epitope (LVYKDPARPKIQK); this differs by two amino acids from the mouse epitope. We find that Hf2 binds both human and mouse FSHβ, and its injection into mice on a high-fat diet phenocopies the effects of the polyclonal Ab in not only reducing subcutaneous and visceral fat, but also inducing beiging (Extended Data Fig. 9).
A humanized Hf2 or its equivalent may not only be efficacious in reducing visceral and subcutaneous fat in people, but might also provide benefit for certain medical conditions associated with visceral adiposity, such as metabolic syndrome, cardiovascular disease, cancer, diabetes, and polycystic ovarian syndrome38, 39. Certain of these complications are thought to arise from proinflammatory cytokines, including IL-6 and TNFα, which could additionally benefit from known effects of lowering FSH40. Finally, in view of concurrent osteoprotection6, we envisage a potential role for an FSH-blocking agent in treating both postmenopausal osteoporosis and obesity.
METHODS
Fsh Peptides
Recombinant mouse Fsh was obtained from R&D (8576-FS). For the cyclic AMP assay, we used fully glycosylated Fsh24 (provided by Dr. T. Raj Kumar)41. It is important for bone and fat assays to use the fully glycosylated form, due to sub-optimal actions of the hypoglycosylated glycoform41.
Immunoprecipitation
Recombinant mouse Fsh (Fshα-Fshβ chimera, 2 µg) was passed through resin (Pierce Co-Immunoprecipitation Kit, 26149, Thermo Scientific) with immobilized Fsh Ab or goat IgG. Elution, flow-through, and consecutive wash fractions were collected and immunoblotted with an in-house monoclonal Fsh Ab (Hf2) (generated by GeneScript).
Mass Spectrometry
The immunoprecipitated eluate (from above) was reduced (DTT, Sigma), alkylated (iodoaceteamide, Sigma), and trypsinized (trypsin, Promega). Peptides were analyzed by reversed phased (12 cm/75 µm, 3 µm C18 beads, Nikkyo Technologies) LC-MS/MS (Ultimate 3000 nano-HPLC system coupled to Q-Exactive Plus mass spectrometer, Thermo Scientific). Peptides were separated using a gradient increasing from 6% buffer B/94% buffer A to 50% buffer B/50% buffer A in 34 minutes (buffer A: 0.1% formic acid; buffer B: 0.1% formic acid in 80% acetonitrile) and analyzed in a combined data dependent (DDA)/parallel reaction monitoring (PRM) experiment42. Six Fsh peptides were targeted. Tandem MS spectra were recorded at a resolution of 17,500 with m/z of 100 as the lowest mass. Normalized collision energy was set at 27, with automatic gain control (AGC) target and maximum injection time being 2×10⁵ and 60 ms, respectively. Tandem MS data were extracted and queried against a protein database containing the Fshα-Fshβ chimera sequence concatenated with an E.coli background database and known common contaminants43 using Proteome Discoverer 1.4 (Thermo Scientific) and MASCOT 2.5.1 (Matrix Science). Acetyl (Protein N-term) and Oxidation (M) were chosen as variable modifications while all cysteines were considered carbamidomethylated. 10 ppm and 20 mDa were used as mass accuracy for precursors and fragment ions, respectively. Matched peptides were filtered using 1% False Discovery Rate calculated by Percolator44 and, in addition, required that a peptide was matched as rank 1 and that precursor mass accuracy was better than 5 ppm. The area of the three most abundant peptides per protein45 was used to estimate approximately the abundance of matched proteins.
Computational Modeling
The crystal structure of the human FSH in complex with the entire ectodomain of the human FSHR was used as the template (PDB id 4AY9) for comparative modeling46. The sequence of the epitope on mouse Fshβ differs by only two amino acids (DLVYKDPARPKIQK→DLVYKDPARPNTQK). Several models of the modified Fshβ epitope were constructed using the ICM software47. Restrained minimization was carried out to remove any steric clashes. The final model was selected on the basis of the lowest Cα RMSD value after superimposition on the template structure (0.2Å). The structure of the Fshr resembles a right hand palm, with the main body as the palm and the protruding hairpin loop as the thumb46. The Fshβ binds in the small groove generated between the palm and the thumb. The electrostatic surfaces generated reveal a complementary surface charge between the Fshr and Fshβ.
Mice
Colonies of male and/or female wild type C57BL/6J mice, nu/nu, male Fshr+/− mice, male ThermoMice and male PhAMexcised mice, originally obtained from The Jackson Lab, were maintained in-house at Icahn School of Medicine at Mount Sinai and/or Maine Medical Center Research Institute. Mice were subjected to standard 12-hour light/dark cycles (6 AM to 6 PM) and fed as below. For thermoneutrality experiments, mice were housed in temperature controlled cages (30°C). All protocols were approved by the Institutional Animal Care and Use Committees of the respective institutions.
Pharmacokinetics
Three-month-old wild type C57BL/6 mice (n=15) were injected, i.p., with a single dose of Ab (100 µg/mouse), with groups of 3 mice being sacrificed at 0, 2, 6, 12 or 24 hours. Collected plasma was subject to in-house ELISA, in which two rabbit anti-goat IgGs, one of which was labeled with HRP (HRP-IgG from Jackson ImmunoResearch, Cat. # 305-035-046 and unlabeled IgG from Thermo Scientific, # 31133), were used to sandwich-capture goat IgG.
Feeding
Depending on the experiment, 3-, 6- or 8-month-old C57BL/6J mice were pair-fed or allowed ad libitum access to a high-fat diet (DIO Formula D12492, 60% fat; Research Diets, Inc., New Brunswick, NJ.) or regular chow (Laboratory Rodent Diet 5001; LabDiet, St Louis, MO) for up to 8 weeks, during which cumulative food intake was measured near-daily, in addition to measurements of body weight, around twice-a-week. For pair-feeding, the amount of chow consumed ad libitum by the IgG group was given to the Ab-treated group. For the ad libitum protocol used at Maine Medical Center both groups were allowed free access to food, with the left-over chow being counted to determine food intake. For specific experiments (Extended Data Figs. 6d–f) performed at Mount Sinai, the Ab-treated group was allowed ad libitum access to food and the same amount of chow was given to IgG group, with the left-over chow being counted to determine food intake of the IgG group. Ab was injected at doses between 100 and 400 µg/mouse as noted in the individual Figure Legends. Numbers of mice per group are indicated in Figure Legends.
Measurement of Body Fat
Several complementary approaches, namely quantitative nuclear magnetic resonance (qNMR), microcomputed tomography (micro-CT), dual energy X-ray absorptiometry (DXA), osmium micro-CT for bone marrow fat quantitation, and tissue weight measurements, were utilized to examine total body fat, as well as fat volume/weight in different adipose tissue compartments.
Quantitative Nuclear Magnetic Resonance
For qNMR, live mice were placed into a thin-walled plastic cylinder, with freedom to turn around. An Echo3-in-1 NMR analyzer (Echo Medical) was used to measure fat, lean and total mass, per manufacturer.
Microcomputed Tomography
For micro-CT, we followed the protocol of Judex et al48. VivaCT-40 (Scanco AG, Bassersdorf, Switzerland) with a detector size of 1024×256 pixels was utilized for imaging fat and measuring fat volume in thoracolumbar compartments. Mice were anaesthetized by purging the chamber with 5% isoflurane and O2 for 5 to 10 minutes (X.E.G.) or with Avertin (C.J.R.) and positioned with both legs extended. The torso of each mouse was scanned at an isotropic voxel size of 76 µm (45 kV, 133 µA) and a 200 ms integration time. Two-dimensional gray scale image slices were reconstructed into a 3-dimensional tomogram, with a Gaussian filter (σ = 0.8, support = 1) applied to reduce noise. Scans were reconstructed between the proximal end of L1 and the distal end of L5. The head and feet were not scanned and/or evaluated because of the relatively low amount of adiposity in these regions, and to allow for a decrease in scan time and radiation exposure to the animals. Regions of fat were manually traced and thresholded at 5% maximum grayscale value. The high resolution of this method allows for the imaging of both subcutaneous white adipose tissue (sWAT) and visceral WAT (vWAT). An automated algorithm was used to quantify the volume of vWAT and sWAT using previously described methods.49, 50
Dual Energy X-Ray Absorptiometry
BMD and body fat measurements were performed using a Lunar Piximus DXA, with a precision of <1.5%51. Anaesthetized mice were subject to measurements, with the cranium excluded. The instrument was calibrated each time before use by employing a phantom per manufacturer’s recommendation.
Osmium Quantitation of Marrow Fat
Osmium staining for marrow fat was performed in collaboration with the Small Animal Imaging Core and the Physiology Core at Maine Medical Center, using previously published methods52. Briefly, tibias were isolated, fixed with 10% formalin for 24 hours, washed, and then decalcified for 14 days in EDTA. Upon further washing, bones were stained for 48 hours in 1% osmium tetraoxide. Following subsequent washes, bones were scanned in PBS with an energy level of 55 kVp, and intensity of 145 µA using the VivaCT-40 (Scanco AG, Bassersdorf, Switzerland). The integration time was set to 500 ms at a maximum isometric voxel size of 10.5 µm at a high-resolution setting. Two voxels of interest (VOIs) were selected shown in Fig. 2c.
Indirect Calorimetry
Indirect calorimetry was performed, as previously49, using the Promethion Metabolic Cage System (Sable Systems, Las Vegas, NV) located in the Physiology Core of Maine Medical Center Research Institute. Data acquisition and instrument control were performed using MetaScreen software (v.2.2.18) and raw data processed using ExpeData (v.1.8.2) (Sable Systems). An analysis script detailing all aspects of data transformation was used. The study consisted of a 12-hour acclimation period followed by a 72-hour sampling duration. Each metabolic cage in the 16-cage system consisted of a cage with standard bedding, a food hopper, water bottle, and “house-like enrichment tube” for body mass measurements, connected to load cells for continuous monitoring, as well as 11.5 cm running wheel connected to a magnetic reed switch to record revolutions. Ambulatory activity and position were monitored using XYZ beam arrays with a beam spacing of 0.25 cm. From this data, mouse pedestrial locomotion and speed within the cage were calculated. Respiratory gases were measured using the GA-3 gas analyzer (Sable Systems) equipped with a pull-mode, negative-pressure system. Air flow was measured and controlled by FR-8 (Sable Systems), with a set flow rate of 2000 mL/min. Oxygen consumption (VO2) and carbon dioxide production (VCO2) (not shown) were reported in mL/minute. Water vapor was measured continuously and its dilution effect on O2 and CO2 were compensated mathematically in the analysis stream. Energy expenditure (EE) was calculated using: kcal/h=60*(0.003941*VO2+0.001106*VCO2) (Weir Equation) and respiratory quotient (RQ) was calculated as VCO2/VO2. Ambulatory activity and wheel running were determined simultaneously with the collection of the calorimetry data. We used two independent methods to derive resting energy expenditure (REE) and active energy expenditure from the time-dependent calorimetry and activity data. First, we determined REE as the average EE of 30-minute intervals of no activity, and active EE as the average EE of 15 minutes of the most active states. Second, we used penalized spline regression to estimate the continuous REE [or resting metabolic rate (RMR)] and active EE related to physical activity [AEE (PA)], using four equidistant knots/day in the spline function and optimizing the activity related preprocessing parameters with respect to the regression residuals53, 54. Sleep hours were determined as any inactivity lasting greater than 40 seconds or more. This latter analysis provided us with an independent verification for a lack of relationship between physical activity and EE53, 54 (Extended Data Fig. 2m).
Insulin Tolerance Test (ITT) and Glucose Tolerance Test (GTT)
Mice were tested after 4 weeks of treatment with Ab or IgG for glucose and insulin tolerance. For GTT, mice were placed in a clean cage with water and fasted overnight (16 hours), following which glucose (1 g/kg) was administered i.p., and blood glucose levels measured at 0, 15, 30, 60, 90 and 120 minutes post-injection using the OneTouch Ultra Glucometer (LifeScan, Inc., Milpitas, CA, USA) per manufacturer’s instructions. For ITT, Ab- or IgG-treated mice were fed ad libitum and injected i.p. with insulin (1 U/kg). Glucose levels were measured at 0, 15, 30, 45, 60 and 120 minutes after injection.
In Vivo Luciferase Imaging
In the ThermoMouse, a luciferase reporter construct, Luc2-T2A–tdTomato, is inserted into the Ucp1 locus on the Y-chromosome (see Extended Data Fig. 1e)10. Activation of Ucp1 expression leads to upregulation of Luc2, which can be quantitated in vivo by radiance (luminescence) measurements using IVIS Spectrum In Vivo Imaging System (Perkin Elmer) following the injection of D-Luciferin (10 µL/g). 3-month-old male ThermoMice were treated with Fsh Ab or goat IgG (200 µg/day/mouse) for 2.5 (under thermoneutral conditions at 30°C) or 8 weeks (at room temperature) while being pair-fed on high-fat diet, followed by D-Luciferin injection and radiance capture from ventral and/or dorsal surfaces of entire body, lower and upper body regions of interest (ROI). In separate experiments, Thermo cells (1.5×10⁶) were implanted into both flanks of nu/nu mice, which were fed on normal chow and injected with Ab (200 µg/mouse/day) for 8 weeks, following which Luc2 radiance was quantitated post D-Luciferin. As basal levels of Ucp1 expression can be variable in transgenic mice, and could therefore confound data interpretation, we routinely perform an early time point for radiance capture at 5 minutes post-D-luciferin. This allows us to evaluate ‘basal’ Ucp1 expression, and mice whose measured total flux and/or average radiance at the 5-minute time point is >1SD from the mean of group is/are excluded. For independent confirmation, frozen sections of resected areas where cells had been implanted were examined for tdTomato fluorescence.
Cell Lines
We used immortalized dedifferentiated brown adipocytes derived from the ThermoMouse (a.k.a. Thermo cells), in which the Ucp1 promoter drives a Luc2-T2A–tdTomato reporter10, kindly provided by Dr. Shingo Kajimura (UCSF). 3T3.L1 cells were purchased from ATCC. Neither cell lines were authenticated, nor were they tested for mycoplasma.
Histology, Immunodetection, qPCR and ELISA
Tissues were subject to hematoxylin/eosin staining or immunocytochemistry by protocols described earlier55. Images were captured using the Keyence or Zeiss microscope. Immunocytochemistry for Fshrs used standard protocols and an anti-Fshr Ab (Lifespan, Cat. #LS-A4004). tdTomato and mito-Dendra2 fluorescence was examined in frozen, 15-µm sections, respectively. Quantitative PCR was performed using appropriate primer sets using Prism 7900-HT (Applied Biosystems Inc.)56. For cAMP measurements, cells were treated for 20 minutes with Fsh and/or CL-316,243, with or without a 16-hour pre-incubation with pertussis toxin (100 ng/mL; European Pharmacopoeia) (in the presence of 0.1 mM IBMX). Cyclic AMP was measured in cell extracts using an ELISA kit (Cayman, 581001). For irisin and metrnl measurements, we used ELISAs (Phoenix, EK-067-29 and R&D, DY7867, respectively). Plasma Fsh and E2 levels were measured by ELISAs (Biotang, M7581 and M7619, respectively).
Noradrenaline (NA) Levels
32 mice fed on a high fat diet were treated with Ab or IgG (200 µg/mouse/day) for 7 weeks. Half of each group was sacrificed at the outset following blood draw, and the other half was injected with alpha-methyl-p-tyrosine (AMPT; 250 mg/kg), with a supplemental dose (125 mg/kg) two hours later. After a further two hours, both groups were sacrificed following blood draw. Extraction and HPLC was conducted at the Core CTSI Laboratory at Yale medical School (courtesy: Ralph Jacobs).
Statistics
From preliminary micro-CT data, we found a dramatic, up to threefold difference, in fat volumes with 4 to 5 mice per group. Using a pre-specified effect size (x1-x2)/s of 3, a normalized Z-score at α=0.05 (Zα) of 1.96, and assuming that standard deviation (S) is half the width of the confidence interval (W) [N=4Zα2S2/W2], 4 mice/group was noted to be sufficient for 95% statistical significance at 0.8 power (α=0.05, β=0.20). Statistically significant differences between any two groups were examined using a two-tailed Student’s t-test, given equal variance. P values were considered significant at or below 0.05.
Randomization, Blinding and Exclusion
Mice were randomly picked for injection with IgG or Ab to ensure equal distribution of body weight across the groups. Technicians who generated and analyzed micro-CT and qNMR data at Dr. Guo’s lab at Columbia University and Dr. Buettner’s lab at Mount Sinai, respectively, were blind to the mouse groups (Figs. 1 and 2, Extended Data Figs. 3, 4, and 6 and 9). Additionally, the technician at the Mount Sinai Imaging Core Facility, who generated data with Thermo mice (Fig. 5) and Thermo cell implants into nu/nu mice (Fig. 3d), was also blind to the mouse groups. Important to note, the fundamental data was confirmed at Dr. Rosen’s lab at Maine Medical Center (Extended Data Table 1). For experiments with Thermo mice, basal Luc2 measurements following D-Luciferin injections were made prior to sampling. Luc2 radiance at 5 minutes is expected to be low. We made a pre-specified determination that if Luc2 radiance in a given mouse exceeded 1SD of the mean, that mouse was excluded. One mouse was excluded based on this criterion.
DATA AVAILABILITY STATEMENT
The authors declare that all data supporting the findings of this study are available within the paper and as Source Data files. Specifically, all Source Data for Figures 1 to 5 and Extended Data Figures 1 to 9 has been deposited with Nature as Excel Spreadsheets (for bar graphs) and as pdf files (for raw immunoblot scans). Extended Data Table 1 attributes specific experimental sets to individual principal investigators.
Extended Data
Extended Data Figure 1. Ab Blocks Fsh-Fshr Interaction at Physiologic Fsh Concentrations in Plasma.
Recombinant mouse Fsh (Fshα-Fshβ chimera, 2 µg) was passed through resin (Pierce Co-Immunoprecipitation Kit, 26149, Thermo Scientific) with immobilized polyclonal Fsh Ab or goat IgG. Elution (Eluate), flow-through (Flow), and consecutive wash fractions (Wash) were collected and immunoblotted, as shown, with a mouse monoclonal Fsh Ab (Hf2) (a). The sequence of the Fshα-Fshβ chimera is shown (b). Peptides from the trypsinized eluate matched by mass spectrometry are marked in red, with the linker peptide shown in red solid circles. Ab was raised against LVYKDPARPNTQK (green-filled circles) (b). (c) Eluted fraction was trypsinized and analyzed by liquid chromatography tandem mass spectrometry (LC-MS/MS). Data were extracted and queried against a protein database containing the Fshα-Fshβ chimera sequence using Proteome Discoverer 1.4 (Thermo Scientific) and MASCOT 2.5.1 (Matrix Science). Oxidated methionine and carbamidomethylated cysteine residues are shown in small letters (m and c, respectively) (Methods for details). Crystal structure of the human FSH-FSHR complex (PDB id: 4AY9; FSHα not shown for clarity) indicates that the loop from the FSHβ subunit (yellow), containing the sequence LVYKDPARPKIQK (highlighted as sticks), tucks into a small groove generated by the FSHR (d–i). Computational modelling of Fsh bearing the peptide sequence LVYKDPARPNTQK shows an identical binding mode (d-ii). Positively charged residues (blue) of the peptide surface complement the negatively charged residues (red) of the Fshr binding site to generate strong electrostatic interactions at the binding surface (arrow) (d-iii). Given the small size of the groove (d-iv), binding of Ab to the peptide sequence will completely shield Fshβ from entering the Fshr binding pocket. That the Ab blocked Fsh action was confirmed experimentally using dedifferentiated brown adipocytes (Thermo cells), immortalized from the ThermoMouse (Jackson Labs)10. The latter has a Luc2-T2A–tdTomato transgene inserted at the initiation codon of the Ucp1 gene10 (e). Thermo cells retain BAT capacity and report Ucp1 activation using Luc2 as reporter. The effect of Fsh (30 ng/mL) and Fsh Ab (concentrations as noted) on Ucp1 expression was tested without fetal bovine serum (no endogenous Fsh) with the Arb3 agonist CL-316,243 (10−7 M). Notably, 1 µg/mL Fsh Ab completely abolished the inhibitory effect of near-circulating levels of Fsh on Ucp1 expression (e) (also see Fig. 3c). Mean ± SD; *P≤0.05, **P≤0.01; in triplicate. Fsh Ab measured as goat IgG in mouse serum (ELISA) following single injection of Ab (100 µg, i.p.) yielded serum goat IgG (Ab) concentrations that were 10–20-fold higher than those required to inhibit Fsh action in vitro (t1/2 = 25.6 hours) n=3/group (f). Two-tailed Student’s T-test, Mean ± SEM.
Extended Data Figure 2. Effect of Fsh Ab on Body Fat and Energy Homeostasis in Mice Fed on a High-Fat Diet.
Results in Fig. 1 were confirmed independently by C.J.R.’s laboratory using quantitative NMR (qNMR) (n=12/group) (a), dual energy X-ray absorptiometry (DXA) (n=12 or 11/group) (b), and tissue weight measurements for inguinal (iWAT) and gonadal (gWAT) and brown adipose tissue (BAT) (n=9 or 10/group) (c). Fsh Ab effects on body fat under thermoneutral (30°C) conditions (d). 3-month-old male mice were housed at 30°C, fed on high-fat diet, and injected with Ab or IgG (200 µg/mouse/day, i.p.) for 3 weeks for measurements of body weight and fat and lean mass (qNMR) (n=3 or 4/group). Indirect calorimetry (e) (metabolic cages) showing 24-hour, day and night parameters of thermogenesis, namely O2 consumption (VO2), energy expenditure (EE), resting EE (R-EE), active EE (A-EE), and respiratory quotient (RQ), as well as physical activity parameters, including X-, Y- and Z-breaks, running distance (Wheel Meters), running speed (Wheel Speed), walking distance (Ped Meters) and walking speed (Ped Speed), and food intake (e). The data was independently analyzed by J.B.v.K. using penalized Spline (p-Spline) regression, with EE, resting metabolic rate (RMR) and physical activity-related EE [A-EE (PA)] shown (see Methods for details) (n=4/group). (f) Plasma noradrenaline levels (HPLC, courtesy Ralph Jacobs, Yale School of Medicine) measured in samples from groups of 3-month-old female mice treated with Ab or goat IgG (200 µg/mouse/day, i.p.) for 7 weeks, following which half the animals within the respective groups were sacrificed, and the other half were treated with the tyrosine hydroxylase inhibitor alpha-methyl-p-tyrosine (AMPT, 250 mg/kg, injection repeated after 2 hours with 125 mg/kg, i.p.) (n=7 or 8/group). Blood was drawn 2 hours following the last AMPT injection. (g) Plasma irisin levels (ELISA kit, Phoenix, EK-067-29) were measured following treatment of 3-month-old mice with Ab or goat IgG (200 µg/mouse/day, i.p., 5 and 7/group for IgG and Ab, respectively). We also measured serum meteorin-like (metrnl) (ELISA kit, R&D, DY7867) – all samples were below assay detection. Glucose tolerance testing (GTT) (n=12/group) (h) or insulin tolerance testing (ITT) (3 and 4/group for IgG and Ab, respectively) (i) showed no significant difference between mice receiving Fsh Ab or IgG (AUC: area under curve). Effect of Fsh Ab or IgG on plasma C-peptide (n=3 or 4/group), adiponectin (n=5/group) or leptin levels (n=5/group) (j); on total cholesterol, triglycerides or free fatty acids (n=5/group) (k); and estradiol (E2) (n=5 or 4/group) (l). Two-Tailed Student’s T-Test; *P≤0.05, **P≤0.01, ^P=0.0588, ^^P=0.065, or as shown; mean ± SEM. (m) Decomposition of TEE with p-Spline regression (e). Continuous time estimates of the RMR and AEE (PA) (shown as AEE) are shown for a typical calorimetry and activity dataset. The p-Spline regression model estimates the RMR from the correlation in time between the activity and energy expenditure data by minimizing the difference between the actual and predicted energy expenditure (AEE + RMR). By using a spline function instead of a constant intercept in the regression model, natural time variations that occur in the RMR can be determined and accurate estimates of the average RMR and AEE are obtained (for details, see Methods).
Extended Data Figure 3. Fsh Antibody Markedly Reduces High-Fat Diet-Induced Obesity in 8-Month-Old Mice.
Effect of Fsh antibody (Ab) or goat IgG (200 µg/day/mouse, i.p.) injected daily into 8-month-old C57BL/6 male mice (Charles Rovers) pair-fed on high-fat diet (n=2 or 3 mice/group) (HFD, see Methods). Shown are food intake and body weight (a); fat mass, fat mass/TM (FM/TM) and lean mass/TM (LM/TM) (b); and total (TFV), subcutaneous (SFV) and visceral (VFV) fat volume (coronal and transverse sections; visceral, red; subcutaneous, yellow) (c). Two-Tailed Student’s T-Test; *P≤0.05; ^P=0.06, mean ± SEM.
Extended Data Figure 4. Fshr-Haploinsufficient Mice Phenocopy the Anti-Adiposity Action of Fsh Ab and Fail to Respond to Ab, Confirming In Vivo Ab Specificity.
Effect of Fsh antibody (Ab) or goat IgG (200 µg/day/mouse, i.p.) in male wild-type (Fshr+/+) or Fshr-haploinsufficient (Fshr+/−) mice that were pair-fed on high-fat diet (HFD, see Methods) (n=3 or 5 mice/group). Shown are total mass (TM), fat mass (FM), and FM/TM (quantitative NMR) (a), as well as total (TFV), subcutaneous (SFV) and visceral (VFV) fat volume (micro-CT, coronal and transverse sections; visceral, red; subcutaneous, yellow) (b). Ucp1 immunostaining of subcutaneous WAT sections showed smaller and densely staining beige-like cells in Fshr+/− mice and in Fsh Ab-treated wild type mice. Two-Tailed Student’s T-Test; *P≤0.05, **P≤0.01; mean ± SEM.
Extended Data Figure 5. Fsh Ab Effects in Ovariectomized Mice.
Ovariectomized or sham-operated mice on normal chow injected with Fsh antibody (Ab) or goat IgG (200 or 400 µg/mouse/day to sham-operated and ovariectomized mice, respectively) (see Methods and Fig. 2). Shown are food intake and body weight (a) (n=5/group); plasma Fsh and estrogen (E2) levels (plasma E2 mostly undetectable after ovariectomy) (n=4 or 5/group) (b). Indirect calorimetry (metabolic cages) showing 24-hour respiratory quotient (RQ), resting EE (R-EE), active EE (A-EE), running distance (Wheel Meters), running speed (Wheel Speed), walking distance (Ped Meters), walking speed (Ped Speed) and food intake (n=4/group) (c). Absent effects of Fsh Ab or IgG on plasma glucose, total cholesterol, triglycerides or free fatty acids (n=4 or 5 mice/group) (d). Two-Tailed Student’s T-Test; **P≤0.01, or as shown.
Extended Data Figure 6. Fsh Ab Reduces Body Fat in Mice Fed on Normal Chow.
Three-month-old C56BL/6J female mice were either pair-fed (a–c) or fed ad libitum (d–f) with normal chow and injected with Fsh Ab or IgG (100 µg/mouse/day) for 7 and 5 weeks, respectively. For pair-feeding, the amount of chow consumed ad libitum by the IgG group was given to the Ab-treated group. For ad libitum feeding, the Ab-treated group was allowed ad libitum access to food and the same amount of chow was given to IgG group, with the left-over chow measured to determine food intake of the IgG group (see Methods). A significant increase in food intake by Ab-treated mice was noted in the ad libitum feeding protocol (d). Nonetheless, as with mice on a high-fat diet, in either feeding protocol (c.f. Fig. 1 and Extended Data Fig. 2), Ab caused a significant decrease in total mass (TM), fat mass (FM) and FM/TM and increase in lean mass/TM (LM/TM) on quantitative NMR (b) in mice that were pair fed. Body weight (a) was also reduced (see Excel Spreadsheet for P-values). However, while Ab-treated mice consumed significantly more chow compared to IgG-injected mice, they showed decrements in FM and FM/TM, but did not show a reduction in TM (e) or body weight (d) (also refer to Excel Spreadsheet for P-values). Micro-CT showed profound decreases in thoracoabdominal fat, visualized in representative coronal and transverse sections (red, visceral fat; yellow, subcutaneous fat), and upon quantitation of total (TFV), subcutaneous (SFV) and visceral fat volumes (VFV) (c, f) in both groups (n=4 or 5/group for a-f). Indirect calorimetry (metabolic cages) showing active EE (A-EE), running distance (Wheel Meters), running speed (Wheel Speed), walking distance (Ped Meters), walking speed (Ped Speed) and food intake (n=4/group) (g). Two-Tailed Student’s T-Test; *P≤0.05, **P≤0.01, ^P=0.069, or as shown.
Extended Data Figure 7. Sanger Sequencing Confirms Expression of Fshrs on Adipocytes.
Total RNA was extracted from adipocytes derived from mesenchymal stem cells (MSC-ad) that were isolated from mouse ear lobes or 3T3.L1 cells (a) and cultured in differentiation medium (MDI, containing IBMX, dexamethasone, and insulin). Total RNA was reverse transcribed and PCR performed using overlapping primer sets (bold lines) to amplify three large cDNA fragments. Overlapping regions covered by primers for Sanger sequencing are shown by arrows. The sequence of the Fshr in MSC-ad cells was identical to murine ovarian Fshr (GenBank ID: NM_013523.3) (a). However, the 3T3.L1 Fshr lacked exon 2 and displayed three amino acid variations (H158Y, F190L and K243E), but was fully functional in terms of its ability to reduce cAMP levels and Ucp1 expression in response to Fsh (c.f. Figs. 3b and 3c). (b) Fsh also triggered an upregulation of the lipogenic genes Fas and Lpl with a marginal increase in Pparg (**P≤0.01, fold-change; qPCR, three biologic replicates, in triplicate). The presence of a signaling-efficient Fshr in adipocytes is consistent with FSHR gene expression in human adipose tissue in GTex and GeneCard databases (http://www.gtexportal.org/home/gene/FSHR; http://www.genecards.org/cgi-bin/carddisp.pl?gene=FSHR&keywords=fshr). We likewise find in the mouse that Fshr expression in WAT is lower than that in the ovary: 1.00±0.47 vs 13.8±1.31 (P<0.01, fold-change, n=3 or 4 mice/group, qPCR, in triplicate). Two-tailed Student’s t-Test, Mean ± SEM shown.
Extended Data Figure 8. Fsh Ab Alters Gene Expression in WAT and BAT.
Three-month-old C57BL/6J mice pair-fed on high-fat diet were injected daily for 8 weeks with Fsh antibody (Ab) or goat IgG (200 µg/mouse/day, i.p.). Shown is the relative expression of genes (names noted) in BAT versus WAT (a) (normalized to housekeeping genes and inguinal WAT, iWAT). Consistent with adipocyte beiging was enhanced brown gene expression (qPCR) in iWAT and BAT at 1 and/or 3 months (M) (normalized to housekeeping genes and to IgG) (b). Two-tailed Student’s t-Test; mean ± SEM; *P≤0.05 (qPCR, n=3 or 6 biological replicates, measured in triplicate). Please also refer to Fig. 4d.
Extended Data Figure 9. Monoclonal Antibody Hf2 Against a Human FSHβ Epitope Markedly Reduces Body Weight and White Adipose Tissue and Induces Beiging in Mice Fed on a High-Fat Diet.
The monoclonal antibody Hf2 was raised against the 13-amino-acid-long human FSHβ sequence (LVYKDPARPKIQK), which corresponds to the mouse Fshβ sequence (LVYKDPARPNTQK) against which the polyclonal Ab was raised (please refer to Extended Data Fig. 1). Hf2 specifically binds human Fshβ in an ELISA. We have also sequenced Hf2 (data available on request). Shown is the effect of a ~9-week exposure to Hf2 or mouse IgG (200 µg/day/mouse, i.p.), injected daily into 6-month-old C57BL/6J mice pair-fed on high-fat diet (see Methods). Food intake (a), body weight (b), fat mass, fat mass/total mass (FM/TM) and lean mass/TM (LM/TM) (quantitative NMR) (c), and total (TFV), subcutaneous (SFV) and visceral (VFV) fat volume (micro-CT, coronal and transverse sections; visceral, red; subcutaneous, yellow) (d) are shown (n=5/group for a–d). Fluorescence and bright field micrographs showing Ucp1 immunostaining in frozen sections of visceral WAT (vWAT) (e). DAPI: nuclear staining. Negative control: irrelevant IgG in place of first antibody. There is a dramatic increase in Ucp1 immunostaining with Ab in vWAT, together with cell condensation, reminiscent of beiging. Statistics: Two-tailed Student’s t-Test, **P≤0.01; mean ± SEM. For body weight changes, please see Excel Spreadsheet. The proof-of-concept study shows that a profound anti-obesity action can result from targeting FSHβ with a monoclonal Ab, a prelude to translational efforts towards the future use of a humanized Hf2 or its equivalent in people.
Extended Data Table 1. Strategy to confirm datasets at the laboratories of Mount Sinai Bone Program and Maine Medical Center Research Institute.
The Fsh antibody was developed in 2008 in the laboratory of M.Z., and its effect on bone in ovariectomized mice was documented in around 2012 (refs 6, 7). Shortly after the recent discovery of its anti-adiposity action, M.Z. shared the antibody with C.J.R. in an attempt to synchronously replicate key findings in a different laboratory. Results were confirmed independently by investigators at the Mount Sinai Bone Program (M.Z., L.S., T.Y., and P. Liu) and Maine Medical Center Research Institute (C.J.R.), as well as, in specific instances where warranted, by external collaborators (H.M., S.H., C.B., Z.B., T.F.D., and X.E.G). This process involved free exchange of reagents and data and cross-confirmation at all levels to enhance rigor, transparency, and reproducibility. Furthermore, once the paper was accepted, the authors from both institutions went back to the Source Data to be doubly certain of their veracity, and in certain instances, the data were independently checked by a more distantly involved group (R.L.). Source Data are provided as Excel spreadsheets (for bar graphs) and a PDF file (for the raw immunoblot relating to Extended Data Fig. 1a). In this table, we attribute individual figure panels to specific principal investigators, which we hope will provide a new format for enhancing transparency and rigor.
| Figure | Primary PI | Collaborating PI |
|---|---|---|
| 1a | L.S. | |
| 1b | M.Z./P.Liu | C.B. |
| 1c | M.Z./P.Liu | X.E.G. |
| 2a | M.Z./P.Liu | C.B. |
| 2b | C.J.R. | |
| 2c | C.J.R. | |
| 3a | L.S./M.Z. | |
| 3b | T.Y. | |
| 3c | M.Z. | C.J.R. |
| 3d | M.Z./P.Liu | |
| 3e | M.Z./P.Liu | |
| 4a | M.Z./P.Liu | |
| 4b | M.Z./P.Liu | |
| 4c | M.Z./P.Liu | |
| 4d | L.S. | T.Y. |
| 5a | M.Z./P.Liu | |
| 5b | M.Z./P.Liu | |
| 5c | P.Liu | |
| Ext. 1a | T.Y. | |
| Ext. 1b | T.Y. | H.M. |
| Ext. 1c | H.M. | |
| Ext. 1d | S.H. | |
| Ext. 1e | M.Z. | C.J.R. |
| Ext. 1f | T.Y. | |
| Ext. 2a | C.J.R. | |
| Ext. 2b | C.J.R. | |
| Ext. 2c | C.J.R. | |
| Ext. 2d | C.J.R. | |
| Ext. 2e | C.J.R. | J.B.v.K. |
| Ext. 2f | T.Y. | |
| Ext. 2g | T.Y | |
| Ext. 2h | C.J.R. | |
| Ext. 2i | C.J.R. | |
| Ext. 2j | L.S. | |
| Ext. 2k | L.S. | |
| Ext. 2l | L.S. | |
| Ext 2m | C.J.R. | J.B.v.K. |
| Ext. 3a | L.S. | |
| Ext. 3b | M.Z./P.Liu | C.B. |
| Ext. 3c | M.Z./P.Liu | X.E.G. |
| Ext. 4a | M.Z./P.Liu | C.B. |
| Ext. 4b | M.Z./P.Liu | X.E.G. |
| Ext. 4c | M.Z./P.Liu | |
| Ext. 5a | L.S. | |
| Ext. 5b | L.S. | T.Y. |
| Ext. 5c | C.J.R. | |
| Ext. 5d | L.S. | C.J.R. |
| Ext. 6a | L.S. | |
| Ext. 6b | M.Z./P.Liu | C.B. |
| Ext. 6c | M.Z./P.Liu | X.E.G. |
| Ext. 6d | L.S. | |
| Ext. 6e | M.Z./P.Liu | C.B. |
| Ext. 6f | M.Z./P.Liu | X.E.G. |
| Ext. 6g | C.J.R. | |
| Ext. 7a | L.S. | Z.B. |
| Ext. 7b | L.S. | |
| Ext. 7c | L.S. | |
| Ext. 8a | L.S. | T.Y. |
| Ext. 8b | L.S. | T.Y. |
| Ext. 9a | L.S. | |
| Ext. 9b | L.S. | |
| Ext. 9c | M.Z./P.Liu | C.B. |
| Ext. 9d | M.Z./P.Liu | X.E.G. |
| Ext. 9e | P.Liu |
Acknowledgments
Work at Mount Sinai was supported by the NIH [R01 DK80459 and DK113627 (M.Z., T.F.D. and L.S.), AG40132, AG23176, AR06592 (M.Z.), and AR06066 (M.Z. and N.G.A.)]. Work at Maine Medical Center Research Institute was supported by: NIGMS P30 GM106391, P30 GM103392 and the NIDDK R24 DK092759-06 to C.J.R; Physiology Core Facility P20 GM103465, NIGMS COBRE in Stem Cell Biology and Regenerative Medicine. We are grateful to Dr. Jay Cao for advice on micro-CT imaging. T.R.K. acknowledges the NIH (P01 AG029531).
Footnotes
Patent: Icahn School of Medicine at Mount Sinai has filed a provisional patent application that covers the application of FSH inhibition to decrease body fat (Provisional US Patent # 62/368,651). Mone Zaidi is listed as inventor.
Disclosures: Mone Zaidi will receive royalties and/or licensing fees per Mount Sinai policies, in case aforementioned patent is commercialized. Mone Zaidi also consults for Merck, Roche, Novartis, and a number of financial consulting platforms.
Contributions: M.Z. and C.J.R conceived and supervised the experiments; P. Liu, E.R.-R., V.E.D., W.A-A., J.L., and P. Lu examined effect of Fsh Ab on adiposity; E.R.-R., V.E.D., J.B.v.K., and C.J.R. did metabolic testing; B.Z., S.T.R., Y.E.Y., X.Z., F.Y., E.X.G., E.R.-R., V.E.D. P. Liu, and C.J.R. generated micro-CT data; A.C.S., V.S., D.J.O., C.B. and P. Liu generated quantitative NMR data; W.A.-A., Y.Z., N.G.A. and P. Liu designed and performed studies with Thermo and PhAMexcised mice; Y.J., S.D., T.Y., P. Liu, S.I., L.-L.Z., Z.B. and L.S. documented functional adipocyte Fshrs; Y.J., S.D., P.T., A.G., and T.Y. carried out signaling experiments; T.Y. and L.S. performed ELISAs; S.H. conducted computational modeling; Y.J., T.Y., and H.M. carried out mass spectrometric studies; T.R.K. provided fully glycosylated Fsh; J.I., S.E., A.B., R.L., T.F.D, M.R.R. and M.I.N. helped design experiments and evaluate data; P. Liu, R.L., T.Y., L.S., C.J.R. and M.Z. checked the datasets; P. Liu, T.Y., L.S., C.J.R. and M.Z. wrote the paper.
References
- 1.Randolph JF, Jr, et al. The value of follicle-stimulating hormone concentration and clinical findings as markers of the late menopausal transition. J. Clin. Endocrinol. Metab. 2006;91:3034–3040. doi: 10.1210/jc.2006-0243. [DOI] [PubMed] [Google Scholar]
- 2.Sowers MR, et al. Endogenous hormones and bone turnover markers in pre- and perimenopausal women: SWAN. Osteoporos Int. 2003;14:191–197. doi: 10.1007/s00198-002-1329-4. [DOI] [PubMed] [Google Scholar]
- 3.Thurston RC, et al. Gains in body fat and vasomotor symptom reporting over the menopausal transition: the study of women’s health across the nation. Am. J. Epidemiol. 2009;170:766–774. doi: 10.1093/aje/kwp203. [DOI] [PMC free article] [PubMed] [Google Scholar]
- 4.Van Pelt RE, Gavin KM, Kohrt WM. Regulation of Body Composition and Bioenergetics by Estrogens. Endocrinol. Metab. Clin. North Am. 2015;44:663–676. doi: 10.1016/j.ecl.2015.05.011. [DOI] [PMC free article] [PubMed] [Google Scholar]
- 5.Sun L, et al. FSH directly regulates bone mass. Cell. 2006;125:247–260. doi: 10.1016/j.cell.2006.01.051. doi:S0092-8674(06)00372-2 [pii] [DOI] [PubMed] [Google Scholar]
- 6.Zhu LL, et al. Blocking antibody to the beta-subunit of FSH prevents bone loss by inhibiting bone resorption and stimulating bone synthesis. Proc. Natl. Acad. Sci. U. S. A. 2012;109:14574–14579. doi: 10.1073/pnas.1212806109. [DOI] [PMC free article] [PubMed] [Google Scholar]
- 7.Zhu LL, et al. Blocking FSH action attenuates osteoclastogenesis. Biochem. Biophys. Res. Commun. 2012;422:54–58. doi: 10.1016/j.bbrc.2012.04.104. [DOI] [PMC free article] [PubMed] [Google Scholar]
- 8.Cohen P, Spiegelman BM. Brown and Beige Fat: Molecular Parts of a Thermogenic Machine. Diabetes. 2015;64:2346–2351. doi: 10.2337/db15-0318. [DOI] [PMC free article] [PubMed] [Google Scholar]
- 9.Cypess AM, Kahn CR. Brown fat as a therapy for obesity and diabetes. Curr. Opin. Endocrinol. Diabetes Obes. 2010;17:143–149. doi: 10.1097/MED.0b013e328337a81f. [DOI] [PMC free article] [PubMed] [Google Scholar]
- 10.Galmozzi A, et al. ThermoMouse: an in vivo model to identify modulators of UCP1 expression in brown adipose tissue. Cell Rep. 2014;9:1584–1593. doi: 10.1016/j.celrep.2014.10.066. [DOI] [PMC free article] [PubMed] [Google Scholar]
- 11.Kim M, et al. Fish oil intake induces UCP1 upregulation in brown and white adipose tissue via the sympathetic nervous system. Sci. Rep. 2015;5:18013. doi: 10.1038/srep18013. [DOI] [PMC free article] [PubMed] [Google Scholar]
- 12.Petruzzelli M, et al. A switch from white to brown fat increases energy expenditure in cancer-associated cachexia. Cell Metab. 2014;20:433–447. doi: 10.1016/j.cmet.2014.06.011. [DOI] [PubMed] [Google Scholar]
- 13.Bostrom P, et al. A PGC1-alpha-dependent myokine that drives brown-fat-like development of white fat and thermogenesis. Nature. 2012;481:463–468. doi: 10.1038/nature10777. [DOI] [PMC free article] [PubMed] [Google Scholar]
- 14.Rao RR, et al. Meteorin-like is a hormone that regulates immune-adipose interactions to increase beige fat thermogenesis. Cell. 2014;157:1279–1291. doi: 10.1016/j.cell.2014.03.065. [DOI] [PMC free article] [PubMed] [Google Scholar]
- 15.Colaianni G, et al. The myokine irisin increases cortical bone mass. Proc. Natl. Acad. Sci. U. S. A. 2015;112:12157–12162. doi: 10.1073/pnas.1516622112. [DOI] [PMC free article] [PubMed] [Google Scholar]
- 16.Danilovich N, et al. Estrogen deficiency, obesity, and skeletal abnormalities in follicle-stimulating hormone receptor knockout (FORKO) female mice. Endocrinology. 2000;141:4295–4308. doi: 10.1210/endo.141.11.7765. [DOI] [PubMed] [Google Scholar]
- 17.Jones ME, et al. Aromatase-deficient (ArKO) mice accumulate excess adipose tissue. J. Steroid Biochem. Mol. Biol. 2001;79:3–9. doi: 10.1016/s0960-0760(01)00136-4. [DOI] [PubMed] [Google Scholar]
- 18.Lindberg MK, et al. Estrogen receptor specificity for the effects of estrogen in ovariectomized mice. J. Endocrinol. 2002;174:167–178. doi: 10.1677/joe.0.1740167. [DOI] [PubMed] [Google Scholar]
- 19.Cui H, et al. FSH stimulates lipid biosynthesis in chicken adipose tissue by upregulating the expression of its receptor FSHR. J. Lipid Res. 2012;53:909–917. doi: 10.1194/jlr.M025403. [DOI] [PMC free article] [PubMed] [Google Scholar]
- 20.Liu XM, et al. FSH regulates fat accumulation and redistribution in aging through the Galphai/Ca(2+)/CREB pathway. Aging cell. 2015;14:409–420. doi: 10.1111/acel.12331. [DOI] [PMC free article] [PubMed] [Google Scholar]
- 21.Wu J, Cohen P, Spiegelman BM. Adaptive thermogenesis in adipocytes: is beige the new brown? Genes Dev. 2013;27:234–250. doi: 10.1101/gad.211649.112. [DOI] [PMC free article] [PubMed] [Google Scholar]
- 22.Jimenez M, et al. Validation of an ultrasensitive and specific immunofluorometric assay for mouse follicle-stimulating hormone. Biol. Reprod. 2005;72:78–85. doi: 10.1095/biolreprod.104.033654. [DOI] [PubMed] [Google Scholar]
- 23.Wu J, et al. Beige adipocytes are a distinct type of thermogenic fat cell in mouse and human. Cell. 2012;150:366–376. doi: 10.1016/j.cell.2012.05.016. [DOI] [PMC free article] [PubMed] [Google Scholar]
- 24.Jimenez-Preitner M, et al. Plac8 is an inducer of C/EBPbeta required for brown fat differentiation, thermoregulation, and control of body weight. Cell Metab. 2011;14:658–670. doi: 10.1016/j.cmet.2011.08.008. [DOI] [PubMed] [Google Scholar]
- 25.Kajimura S, et al. Initiation of myoblast to brown fat switch by a PRDM16-C/EBP-beta transcriptional complex. Nature. 2009;460:1154–1158. doi: 10.1038/nature08262. [DOI] [PMC free article] [PubMed] [Google Scholar]
- 26.Rosenwald M, Perdikari A, Rulicke T, Wolfrum C. Bi-directional interconversion of brite and white adipocytes. Nat. Cell Biol. 2013;15:659–667. doi: 10.1038/ncb2740. [DOI] [PubMed] [Google Scholar]
- 27.Wang QA, Tao C, Gupta RK, Scherer PE. Tracking adipogenesis during white adipose tissue development, expansion and regeneration. Nat. Med. 2013;19:1338–1344. doi: 10.1038/nm.3324. [DOI] [PMC free article] [PubMed] [Google Scholar]
- 28.Cedikova M, et al. Mitochondria in White, Brown, and Beige Adipocytes. Stem Cells Int. 2016;2016:6067349. doi: 10.1155/2016/6067349. [DOI] [PMC free article] [PubMed] [Google Scholar]
- 29.Shabalina IG, et al. UCP1 in brite/beige adipose tissue mitochondria is functionally thermogenic. Cell Rep. 2013;5:1196–1203. doi: 10.1016/j.celrep.2013.10.044. [DOI] [PubMed] [Google Scholar]
- 30.Pham AH, McCaffery JM, Chan DC. Mouse lines with photo-activatable mitochondria to study mitochondrial dynamics. Genesis. 2012;50:833–843. doi: 10.1002/dvg.22050. [DOI] [PMC free article] [PubMed] [Google Scholar]
- 31.Abe E, et al. TSH is a negative regulator of skeletal remodeling. Cell. 2003;115:151–162. doi: 10.1016/s0092-8674(03)00771-2. doi:S0092867403007712 [pii] [DOI] [PubMed] [Google Scholar]
- 32.Sun L, et al. Functions of vasopressin and oxytocin in bone mass regulation. Proc. Natl. Acad. Sci. U. S. A. 2016;113:164–169. doi: 10.1073/pnas.1523762113. [DOI] [PMC free article] [PubMed] [Google Scholar]
- 33.Zaidi M. Skeletal remodeling in health and disease. Nat. Med. 2007;13:791–801. doi: 10.1038/nm1593. [DOI] [PubMed] [Google Scholar]
- 34.Giordano A, Frontini A, Cinti S. Convertible visceral fat as a therapeutic target to curb obesity. Nat. Rev. Drug Discov. 2016;15:405–424. doi: 10.1038/nrd.2016.31. [DOI] [PubMed] [Google Scholar]
- 35.Cinti S. Adipose tissues and obesity. Ital. J. Anat. Embryol. 1999;104:37–51. [PubMed] [Google Scholar]
- 36.Kawai H, Furuhashi M, Suganuma N. Serum follicle-stimulating hormone level is a predictor of bone mineral density in patients with hormone replacement therapy. Arch. Gynecol. Obstet. 2004;269:192–195. doi: 10.1007/s00404-003-0532-7. [DOI] [PubMed] [Google Scholar]
- 37.Ryu JW, et al. DHEA administration increases brown fat uncoupling protein 1 levels in obese OLETF rats. Biochem. Biophys. Res. Commun. 2003;303:726–731. doi: 10.1016/s0006-291x(03)00409-1. [DOI] [PubMed] [Google Scholar]
- 38.Despres JP, Lemieux I. Abdominal obesity and metabolic syndrome. Nature. 2006;444:881–887. doi: 10.1038/nature05488. [DOI] [PubMed] [Google Scholar]
- 39.Hayes MG, et al. Genome-wide association of polycystic ovary syndrome implicates alterations in gonadotropin secretion in European ancestry populations. Nat. Commun. 2015;6:7502. doi: 10.1038/ncomms8502. [DOI] [PMC free article] [PubMed] [Google Scholar]
- 40.Iqbal J, Sun L, Kumar TR, Blair HC, Zaidi M. Follicle-stimulating hormone stimulates TNF production from immune cells to enhance osteoblast and osteoclast formation. Proc. Natl. Acad. Sci. U. S. A. 2006;103:14925–14930. doi: 10.1073/pnas.0606805103. doi:0606805103 [pii] [DOI] [PMC free article] [PubMed] [Google Scholar]
- 41.Bousfield GR, Butnev VY, White WK, Hall AS, Harvey DJ. Comparison of Follicle-Stimulating Hormone Glycosylation Microheterogenity by Quantitative Negative Mode Nano-Electrospray Mass Spectrometry of Peptide-N Glycanase-Released Oligosaccharides. J. Glycomics Lipidomics. 2015;5 doi: 10.4172/2153-0637.1000129. [DOI] [PMC free article] [PubMed] [Google Scholar]
- 42.Peterson AC, Russell JD, Bailey DJ, Westphall MS, Coon JJ. Parallel reaction monitoring for high resolution and high mass accuracy quantitative, targeted proteomics. Molecular & cellular proteomics : MCP. 2012;11:1475–1488. doi: 10.1074/mcp.O112.020131. [DOI] [PMC free article] [PubMed] [Google Scholar]
- 43.Bunkenborg J, Garcia GE, Paz MI, Andersen JS, Molina H. The minotaur proteome: avoiding cross-species identifications deriving from bovine serum in cell culture models. Proteomics. 2010;10:3040–3044. doi: 10.1002/pmic.201000103. [DOI] [PubMed] [Google Scholar]
- 44.Spivak M, Weston J, Bottou L, Kall L, Noble WS. Improvements to the percolator algorithm for Peptide identification from shotgun proteomics data sets. Journal of proteome research. 2009;8:3737–3745. doi: 10.1021/pr801109k. [DOI] [PMC free article] [PubMed] [Google Scholar]
- 45.Silva JC, Gorenstein MV, Li GZ, Vissers JP, Geromanos SJ. Absolute quantification of proteins by LCMSE: a virtue of parallel MS acquisition. Molecular & cellular proteomics : MCP. 2006;5:144–156. doi: 10.1074/mcp.M500230-MCP200. [DOI] [PubMed] [Google Scholar]
- 46.Jiang X, et al. Structure of follicle-stimulating hormone in complex with the entire ectodomain of its receptor. Proc Natl Acad Sci U S A. 2012;109:12491–12496. doi: 10.1073/pnas.1206643109. [DOI] [PMC free article] [PubMed] [Google Scholar]
- 47.Abagyan R, Totrov M, Kuznetsov D. ICM - a new method for protein modeling and design. Applications to docking and structure prediction from the distorted native conformation. J Comp Chem. 1994;15:488–506. [Google Scholar]
- 48.Judex S, et al. Quantification of adiposity in small rodents using micro-CT. Methods. 2010;50:14–19. doi: 10.1016/j.ymeth.2009.05.017. [DOI] [PMC free article] [PubMed] [Google Scholar]
- 49.DeMambro VE, et al. Igfbp2 Deletion in Ovariectomized Mice Enhances Energy Expenditure but Accelerates Bone Loss. Endocrinology. 2015;156:4129–4140. doi: 10.1210/en.2014-1452. [DOI] [PMC free article] [PubMed] [Google Scholar]
- 50.Lublinsky S, Ozcivici E, Judex S. An automated algorithm to detect the trabecular-cortical bone interface in micro-computed tomographic images. Calcified tissue international. 2007;81:285–293. doi: 10.1007/s00223-007-9063-8. [DOI] [PubMed] [Google Scholar]
- 51.Sun L, et al. Disordered osteoclast formation and function in a CD38 (ADP-ribosyl cyclase)-deficient mouse establishes an essential role for CD38 in bone resorption. FASEB journal : official publication of the Federation of American Societies for Experimental Biology. 2003;17:369–375. doi: 10.1096/fj.02-0205com. [DOI] [PubMed] [Google Scholar]
- 52.Scheller EL, et al. Use of osmium tetroxide staining with microcomputerized tomography to visualize and quantify bone marrow adipose tissue in vivo. Methods in enzymology. 2014;537:123–139. doi: 10.1016/B978-0-12-411619-1.00007-0. [DOI] [PMC free article] [PubMed] [Google Scholar]
- 53.van Klinken JB, van den Berg SA, van Dijk KW. Practical aspects of estimating energy components in rodents. Front. Physiol. 2013;4:94. doi: 10.3389/fphys.2013.00094. [DOI] [PMC free article] [PubMed] [Google Scholar]
- 54.Van Klinken JB, van den Berg SA, Havekes LM, Willems Van Dijk K. Estimation of activity related energy expenditure and resting metabolic rate in freely moving mice from indirect calorimetry data. PloS one. 2012;7:e36162. doi: 10.1371/journal.pone.0036162. [DOI] [PMC free article] [PubMed] [Google Scholar]
- 55.Liu P, et al. Anabolic actions of Notch on mature bone. Proceedings of the National Academy of Sciences of the United States of America. 2016;113:E2152–2161. doi: 10.1073/pnas.1603399113. [DOI] [PMC free article] [PubMed] [Google Scholar]
- 56.Yuen T, Wurmbach E, Pfeffer RL, Ebersole BJ, Sealfon SC. Accuracy and calibration of commercial oligonucleotide and custom cDNA microarrays. Nucleic acids research. 2002;30:e48. doi: 10.1093/nar/30.10.e48. [DOI] [PMC free article] [PubMed] [Google Scholar]
Associated Data
This section collects any data citations, data availability statements, or supplementary materials included in this article.
Data Availability Statement
The authors declare that all data supporting the findings of this study are available within the paper and as Source Data files. Specifically, all Source Data for Figures 1 to 5 and Extended Data Figures 1 to 9 has been deposited with Nature as Excel Spreadsheets (for bar graphs) and as pdf files (for raw immunoblot scans). Extended Data Table 1 attributes specific experimental sets to individual principal investigators.


